

Impact of growth matrix on pharmacodynamics of antimicrobial drugs for pig pneumonia pathogens
- PMID: 28645327
- PMCID: PMC5481914
- DOI: 10.1186/s12917-017-1086-4
Impact of growth matrix on pharmacodynamics of antimicrobial drugs for pig pneumonia pathogens
Abstract
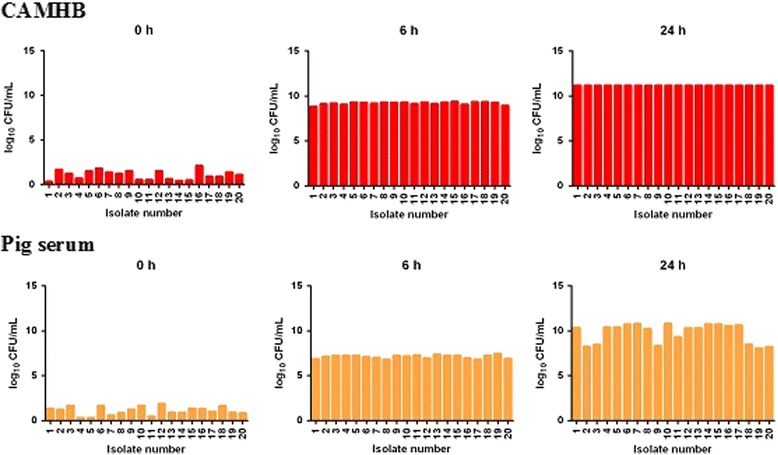
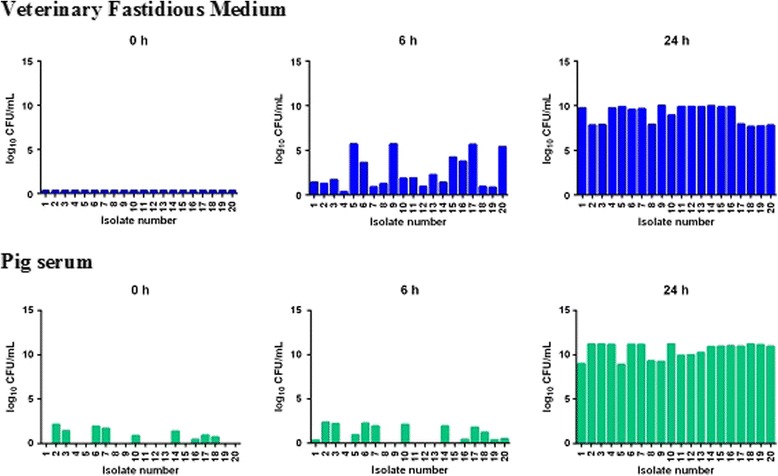
Background: The most widely used measure of potency of antimicrobial drugs is Minimum Inhibitory Concentration (MIC). MIC is usually determined under standardised conditions in broths formulated to optimise bacterial growth on a species-by-species basis. This ensures comparability of data between laboratories. However, differences in values of MIC may arise between broths of differing chemical composition and for some drug classes major differences occur between broths and biological fluids such as serum and inflammatory exudate. Such differences must be taken into account, when breakpoint PK/PD indices are derived and used to predict dosages for clinical use. There is therefore interest in comparing MIC values in several broths and, in particular, in comparing broth values with those generated in serum. For the pig pneumonia pathogens, Actinobacillus pleuropneumoniae and Pasteurella multocida, MICs were determined for three drugs, florfenicol, oxytetracycline and marbofloxacin, in five broths [Mueller Hinton Broth (MHB), cation-adjusted Mueller Hinton Broth (CAMHB), Columbia Broth supplemented with NAD (CB), Brain Heart Infusion Broth (BHI) and Tryptic Soy Broth (TSB)] and in pig serum.
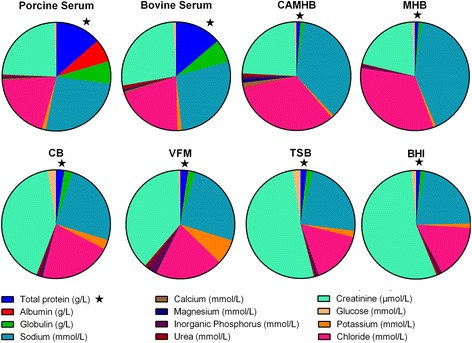
Results: For each drug, similar MIC values were obtained in all broths, with one exception, marbofloxacin having similar MICs for three broths and 4-5-fold higher MICs for two broths. In contrast, for both organisms, quantitative differences between broth and pig serum MICs were obtained after correction of MICs for drug binding to serum protein (fu serum MIC). Potency was greater (fu serum MIC lower) in serum than in broths for marbofloxacin and florfenicol for both organisms. For oxytetracycline fu serum:broth MIC ratios were 6.30:1 (P. multocida) and 0.35:1 (A. pleuropneumoniae), so that potency of this drug was reduced for the former species and increased for the latter species. The chemical composition of pig serum and broths was compared; major matrix differences in 14 constituents did not account for MIC differences. Bacterial growth rates were compared in broths and pig serum in the absence of drugs; it was concluded that broth/serum MIC differences might be due to differing growth rates in some but not all instances.
Conclusions: For all organisms and all drugs investigated in this study, it is suggested that broth MICs should be adjusted by an appropriate scaling factor when used to determine pharmacokinetic/pharmacodynamic breakpoints for dosage prediction.
Keywords: A. Pleuropneumoniae; Florfenicol; Marbofloxacin; Minimum inhibitory concentration; Oxytetracycline; P. Multocida.
Figures
Similar articles
-
Factors influencing the potency of marbofloxacin for pig pneumonia pathogens Actinobacillus pleuropneumoniae and Pasteurella multocida.Res Vet Sci. 2017 Apr;111:93-98. doi: 10.1016/j.rvsc.2016.11.011. Epub 2016 Nov 26. Res Vet Sci. 2017. PMID: 28113129
-
What is the true in vitro potency of oxytetracycline for the pig pneumonia pathogens Actinobacillus pleuropneumoniae and Pasteurella multocida?J Vet Pharmacol Ther. 2017 Oct;40(5):517-529. doi: 10.1111/jvp.12386. Epub 2017 Jan 18. J Vet Pharmacol Ther. 2017. PMID: 28101885 Free PMC article.
-
Potency of marbofloxacin for pig pneumonia pathogens Actinobacillus pleuropneumoniae and Pasteurella multocida: Comparison of growth media.Res Vet Sci. 2017 Apr;111:43-48. doi: 10.1016/j.rvsc.2016.11.001. Epub 2016 Nov 25. Res Vet Sci. 2017. PMID: 27940285
-
Amoxicillin-current use in swine medicine.J Vet Pharmacol Ther. 2018 Jun;41(3):356-368. doi: 10.1111/jvp.12482. Epub 2018 Jan 19. J Vet Pharmacol Ther. 2018. PMID: 29352469 Review.
-
Application of pharmacokinetic/pharmacodynamic concepts to the development of treatment regimens for sporadic canine urinary tract infections: Challenges and paths forward.J Vet Pharmacol Ther. 2022 Sep;45(5):415-425. doi: 10.1111/jvp.13088. Epub 2022 Jul 30. J Vet Pharmacol Ther. 2022. PMID: 35906854 Review.
Cited by
-
Pasteurella multocida specific bacteriophage suppresses P. multocida-induced inflammation: identification of genes related to bacteriophage signaling by Pasteurella multocida-infected swine nasal turbinate cells.Genes Genomics. 2020 Feb;42(2):235-243. doi: 10.1007/s13258-019-00898-4. Epub 2019 Dec 18. Genes Genomics. 2020. PMID: 31853889
-
Assessment of the phytochemical composition and antimicrobial properties of Tapinanthus bangwensis leaves hosted by the branches of Persea americana.BMC Complement Med Ther. 2023 Feb 3;23(1):34. doi: 10.1186/s12906-023-03860-w. BMC Complement Med Ther. 2023. PMID: 36737748 Free PMC article.
-
Minimum Inhibitory Concentration (MIC) and Minimum Bactericidal Concentration (MBC) for Twelve Antimicrobials (Biocides and Antibiotics) in Eight Strains of Listeria monocytogenes.Biology (Basel). 2021 Dec 29;11(1):46. doi: 10.3390/biology11010046. Biology (Basel). 2021. PMID: 35053044 Free PMC article.
References
-
- Toutain PL, Lees P. Integration and modelling of pharmacokinetic and pharmacodynamic data to optimize dosage regimens in veterinary medicine. J Vet Pharmacol Ther. 2004;27(6):467-7. - PubMed
MeSH terms
Substances
LinkOut - more resources
Full Text Sources
Other Literature Sources
Medical
Molecular Biology Databases
