Comparative Study
. 2017 Aug 7;216(8):2305-2313.
doi: 10.1083/jcb.201701084. Epub 2017 Jun 23.

The glycolytic enzyme phosphofructokinase-1 assembles into filaments

Affiliations
Comparative Study

The glycolytic enzyme phosphofructokinase-1 assembles into filaments

Bradley A Webb et al. J Cell Biol. .

Abstract

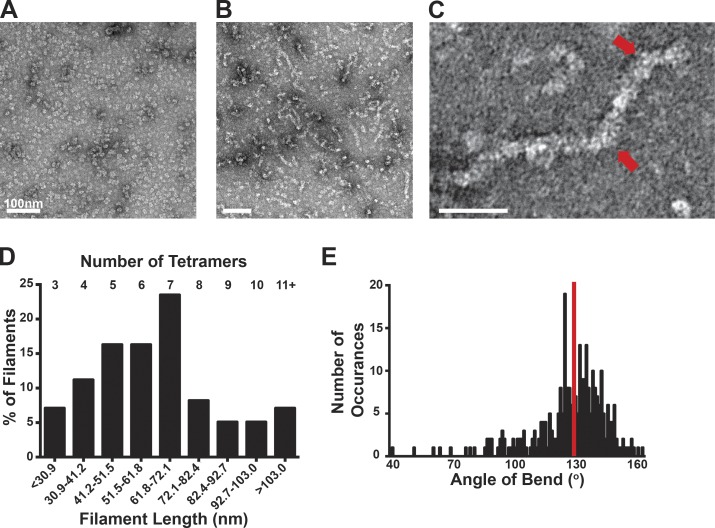
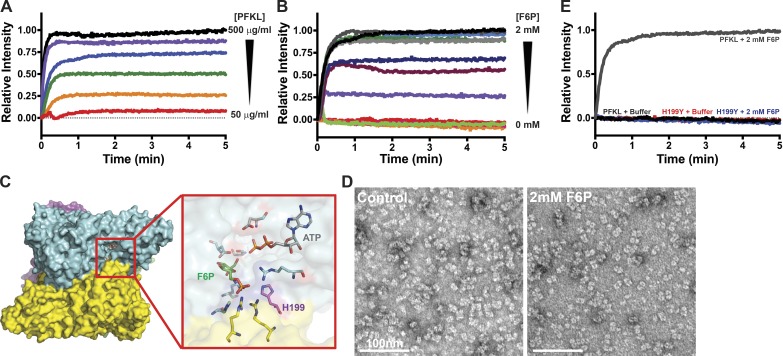
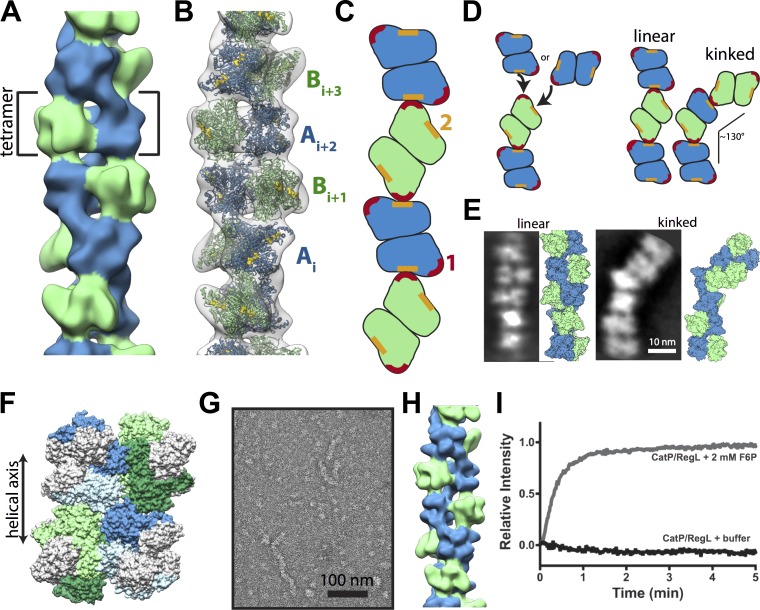
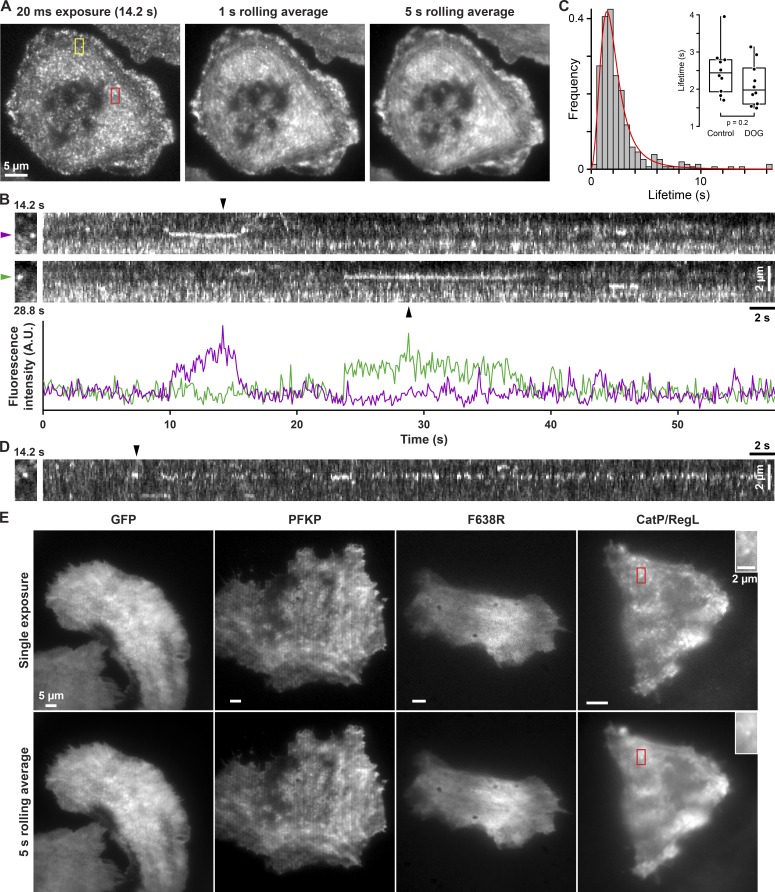
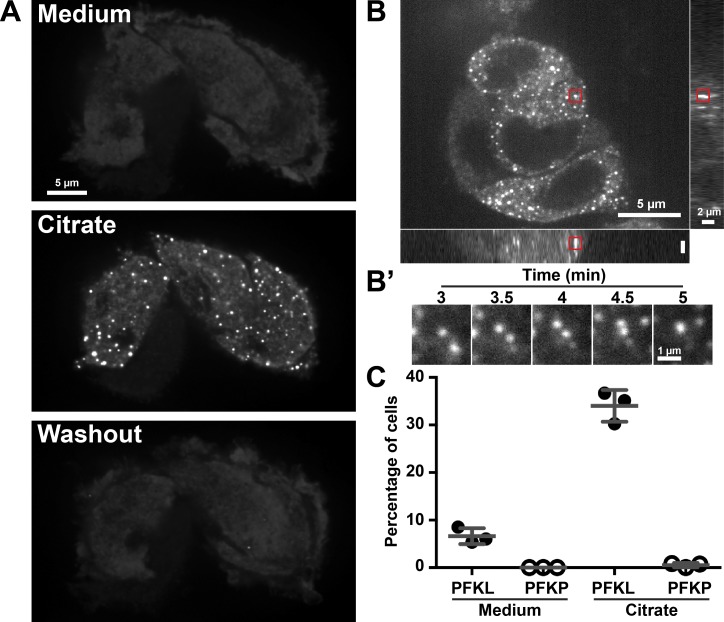
Despite abundant knowledge of the regulation and biochemistry of glycolytic enzymes, we have limited understanding on how they are spatially organized in the cell. Emerging evidence indicates that nonglycolytic metabolic enzymes regulating diverse pathways can assemble into polymers. We now show tetramer- and substrate-dependent filament assembly by phosphofructokinase-1 (PFK1), which is considered the "gatekeeper" of glycolysis because it catalyzes the step committing glucose to breakdown. Recombinant liver PFK1 (PFKL) isoform, but not platelet PFK1 (PFKP) or muscle PFK1 (PFKM) isoforms, assembles into filaments. Negative-stain electron micrographs reveal that filaments are apolar and made of stacked tetramers oriented with exposed catalytic sites positioned along the edge of the polymer. Electron micrographs and biochemical data with a PFKL/PFKP chimera indicate that the PFKL regulatory domain mediates filament assembly. Quantified live-cell imaging shows dynamic properties of localized PFKL puncta that are enriched at the plasma membrane. These findings reveal a new behavior of a key glycolytic enzyme with insights on spatial organization and isoform-specific glucose metabolism in cells.


Figures

Figure 1.
Figure 1.
PFKL forms filaments of stacked tetramers. (A and B) TEM images of PFKL in control buffer (A) and in buffer containing 2 mM F6P (B). (C) Higher-magnification TEM image of a PFKL filament in the presence of 2 mM F6P. Red arrows highlight bends in the filament. (D) Chart of binned length determined relative to the percentage of filaments from 98 PFKL filaments measured from two separate protein preparations. The approximate number of tetramers that each bin represents is shown at the top of the chart. (E) Angle of bend determined relative to number of occurrences for a total of 290 bends measured from three separate protein preparations. The red line represents the mean of 124°.
Figure 2.
Figure 2.
PFKL filament formation is concentration- and F6P-dependent. (A) 90° light scattering of 50–500 µg/ml PFKL upon the addition of 2 mM F6P at time 0. Red, 50 µg/ml; orange, 100 µg/ml; green, 150 µg/ml; blue, 200 µg/ml; purple, 400 µg/ml; black, 500 µg/ml. (B) 90° light scattering at the 200 µg/ml PFKL upon the addition of the indicated concentration of F6P at time 0. Red, 0 mM; orange, 0.25 mM; pink, 0.5 mM; green, 0.6 mM; purple, 0.7 mM; maroon, 0.75 mM; dark blue, 0.8 mM; light blue, 0.9 mM; dark green, 1.0 mM; light gray, 1.25 mM; dark gray, 1.5 mM; black, 2.0 mM. (C) Location of His199 in the F6P binding pocket of PFK1. (D) TEM images of PFKL-H199Y in control buffer (left) and in buffer containing 2 mM F6P (right). (E) 90° light scattering at 200 µg/ml PFKL or PFKL-H199Y upon the addition of 2 mM F6P at time 0. Data are representative of three determinations from two separate protein preparations.
Figure 3.
Figure 3.
Architecture of PFKL filament. (A) Negative-stain 3D reconstruction of the PFKL at 25-Å resolution. The PFKL tetramer is the repeating helical unit. Dimers on each half of the tetramer, colored blue or green, are engaged in different assembly contacts. (B) Fit of the PFKP crystal structure into the EM structure, with distinct A and B dimers labeled. (C) Diagram of longitudinal interactions between A and B dimers. (D) PFKL tetramers can add to the end of a filament through interfaces 1 or 2, resulting in either a continued linear polymer or a kink of ∼130°. (E) Examples of linear and straight filaments from reference-free means of PFKL segments with corresponding molecular models. (F) Model of CatP/RegL chimera with the catalytic domain of PFKP (gray) and the regulatory domain of PFKL (colored blue for dimer A and green for dimer B) interacting in the filament. (G) Negative-stain micrograph of the CatP/RegL in the presence of F6P. (H) Reconstruction of CatP/RegL at 25-Å resolution. (I) 90° light scattering at the 200 µg/ml CatP/RegL upon the addition of buffer alone (black line) or 2 mM F6P (gray line) at time 0. Data are representative of three determinations from two separate protein preparations.
Figure 4.
Figure 4.
PFKL forms dynamic particles in MTLn3 rat breast cancer cells. (A) TIRF image of PFKL-EGFP expressing MTLn3 rat mammary adenocarcinoma cell from a time-lapse sequence acquired at 10 frames per second and 1-s (10 frames) and 5-s (50 frames) rolling averages highlighting docked PFKL-EGFP particles. (B) Kymographs showing docked PFKL-EGFP particles in the yellow box indicated in A. Black arrowheads correspond with the individual time points shown on the left. The plot shows fluorescence intensity of the two example particles highlighted by colored arrowheads as a function of time. (C) Docked PFKL-EGFP lifetime distribution from control cells (n = 306 particles from 10 cells). Histogram bin width was set according to the Freedman–Diaconis rule. The red line is a log-logistic fit of the lifetime distribution. The inset is a box plot of the mean particle docking time per cell for control cells or cells treated with 2-deoxyglucose (DOG; n = 298 particles from 10 cells) for 23 h. A t test was used to determine statistical significance. (D) Kymograph of the area in the red box indicated in A showing PFKL-EGFP particles docking at the similar location over the course of the video. (E) Single exposure and 5-s rolling averages for MTLn3 cells expressing EGFP or various EGFP-PFK1 constructs as labeled. The frame rate of time-lapse sequences was: EGFP, 2.6 frames per second; PFKP-EGFP, 1.5 frames per second; PFKL-F638R-EGFP, 2.8 frames per second; CatP/RegL-EGFP, 2.9 frames per second. Higher-magnification images of the areas of the red boxes in the CatP/RegL-EGFP cells highlight a docked particle. Data are representative of three independent cell preparations.
Figure 5.
Figure 5.
Citrate reversibly induces the formation of large PFKL-EGFP punctae. (A) Spinning-disk confocal image of PFKL-EGFP–expressing MTLn3 cells from a time-lapse sequence acquired at two frames per minute. Cells were imaged in growth medium for 5 min before the addition of 10 mM citrate. After imaging for 5 min, the citrate-containing medium was replaced with growth medium, and cells were imaged for an additional 5 min. Medium, image directly before the addition of 10 mM citrate; citrate, image 4 min after the addition of citrate; washout, image 5 min after removal of citrate-containing buffer. (B) Spinning-disk confocal z-stack of PFKL-EGFP–expressing cells 4 min after the addition of 10 mM citrate. (B′) Area of the red box in B at the time indicated after the addition of citrate. (C) Percentage of MTLn3 cells expressing either PFKL-EGFP or PFKP-EGFP showing the formation of large punctae in growth medium or 4 min after the addition of 10 mM citrate. Error bars represent means ± SD. Data are representative of three independent cell preparations.

Comment in

Similar articles

Cited by

References

    1. Albe K.R., Butler M.H., and Wright B.E.. 1990. Cellular concentrations of enzymes and their substrates. J. Theor. Biol. 143:163–195. 10.1016/S0022-5193(05)80266-8 - DOI - PubMed
    1. Attanasio F., Caldieri G., Giacchetti G., van Horssen R., Wieringa B., and Buccione R.. 2011. Novel invadopodia components revealed by differential proteomic analysis. Eur. J. Cell Biol. 90:115–127. 10.1016/j.ejcb.2010.05.004 - DOI - PubMed
    1. Barry R.M., Bitbol A.-F., Lorestani A., Charles E.J., Habrian C.H., Hansen J.M., Li H.-J., Baldwin E.P., Wingreen N.S., Kollman J.M., and Gitai Z.. 2014. Large-scale filament formation inhibits the activity of CTP synthetase. eLife. 3:e03638 10.7554/eLife.03638 - DOI - PMC - PubMed
    1. Beaty N.B., and Lane M.D.. 1983. The polymerization of acetyl-CoA carboxylase. J. Biol. Chem. 258:13051–13055. - PubMed
    1. Beckner M.E., Stracke M.L., Liotta L.A., and Schiffmann E.. 1990. Glycolysis as primary energy source in tumor cell chemotaxis. J. Natl. Cancer Inst. 82:1836–1840. 10.1093/jnci/82.23.1836 - DOI - PubMed

Publication types

MeSH terms

Associated data