

Increased glomerular filtration rate and impaired contractile function of mesangial cells in TRPC6 knockout mice
- PMID: 28646178
- PMCID: PMC5482875
- DOI: 10.1038/s41598-017-04067-z
Increased glomerular filtration rate and impaired contractile function of mesangial cells in TRPC6 knockout mice
Abstract
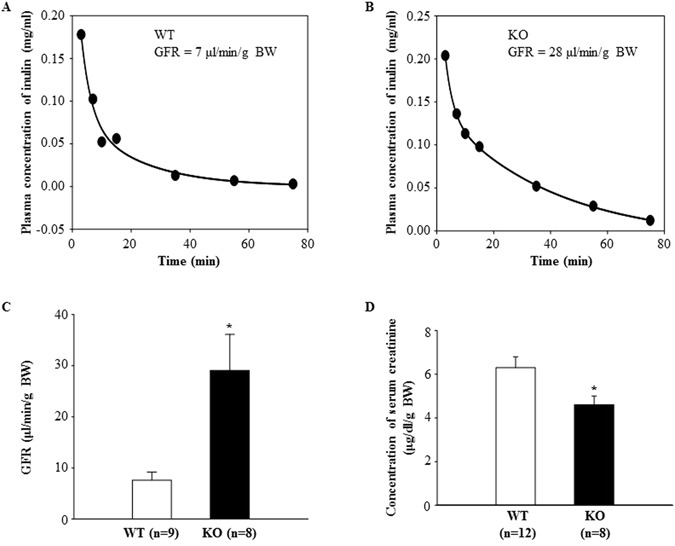
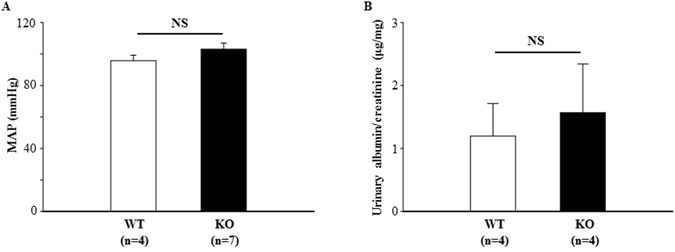
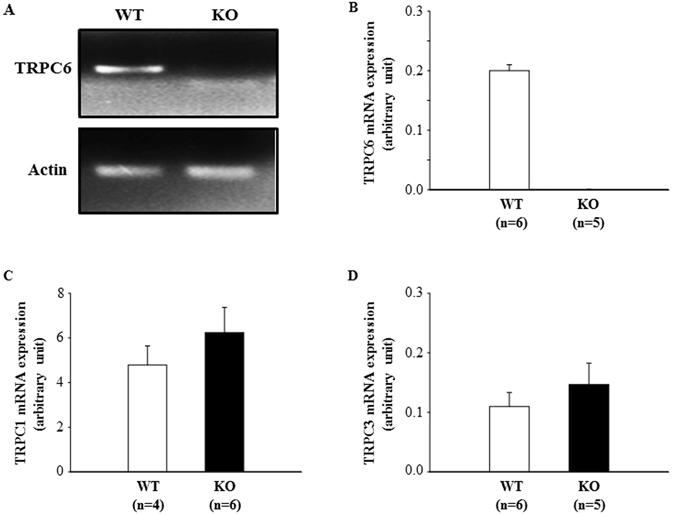
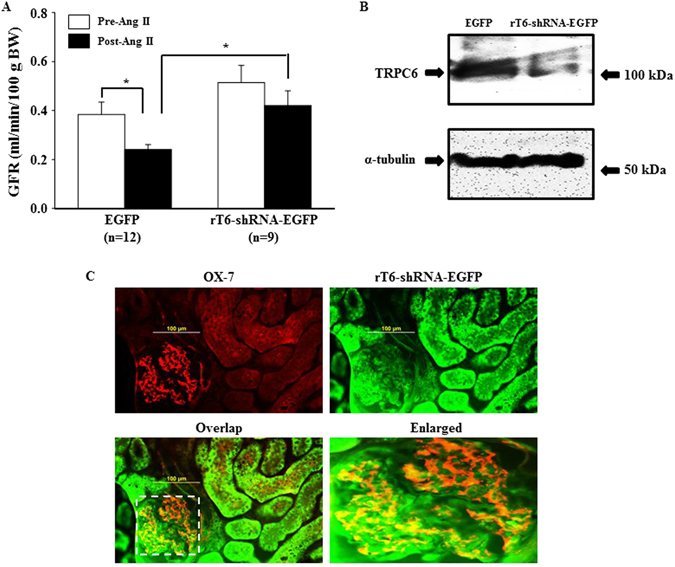
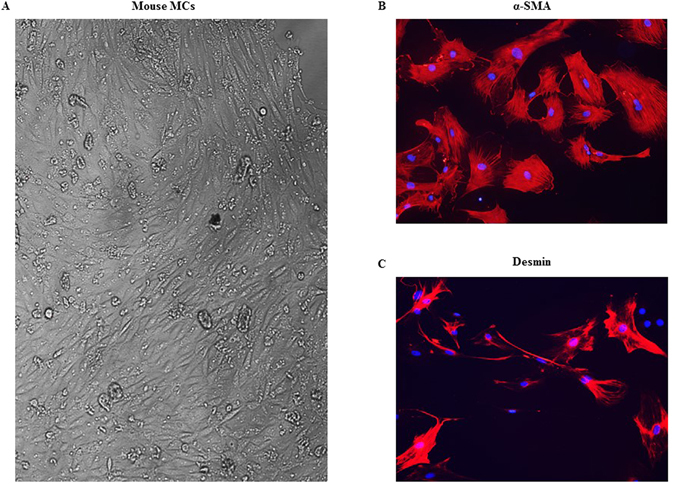
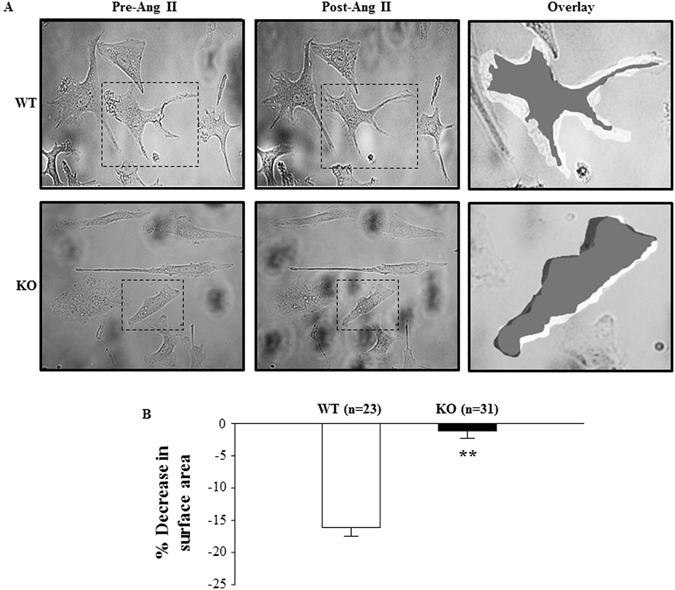
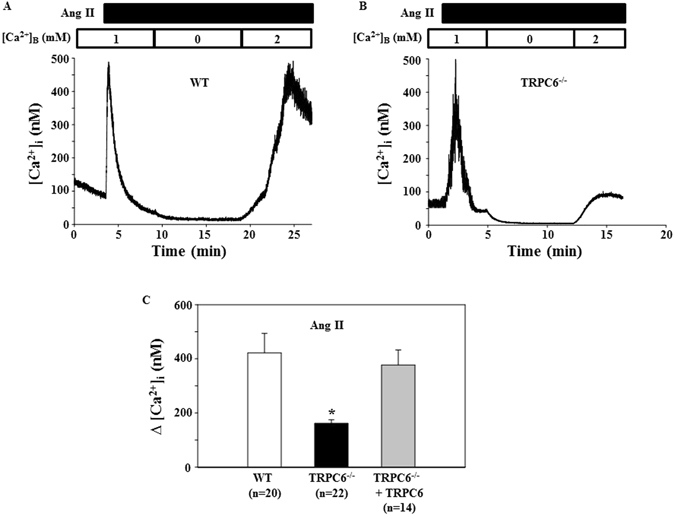
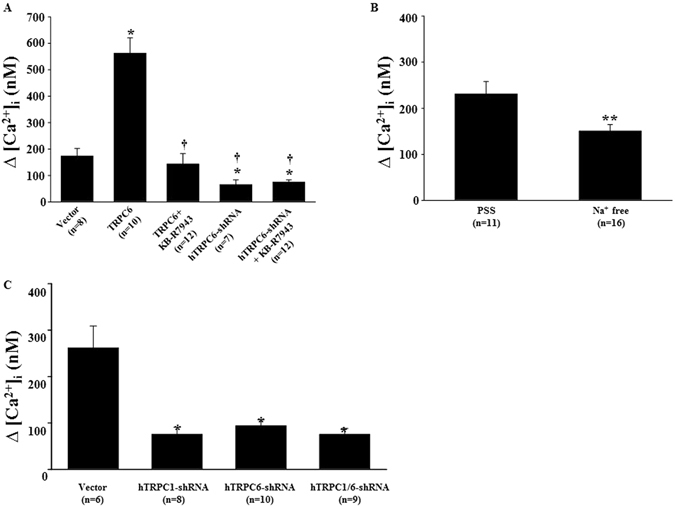
The present study was conducted to determine if TRPC6 regulates glomerular filtration rate (GFR) and the contractile function of glomerular mesangial cells (MCs). GFR was assessed in conscious TRPC6 wild type and knockout mice, and in anesthetized rats with and without in vivo knockdown of TRPC6 in kidneys. We found that GFR was significantly greater, and serum creatinine level was significantly lower in TRPC6 deficient mice. Consistently, local knockdown of TRPC6 in kidney using TRPC6 specific shRNA construct significantly attenuated Ang II-induced GFR decline in rats. Furthermore, Ang II-stimulated contraction and Ca2+ entry were significantly suppressed in primary MCs isolated from TRPC6 deficient mice, and the Ca2+ response could be rescued by re-introducing TRPC6. Moreover, inhibition of reverse mode of Na+-Ca2+ exchange by KB-R7943 significantly reduced Ca2+ entry response in TRPC6-expressing, but not in TRPC6-knocked down MCs. Ca2+ entry response was also significantly attenuated in Na+ free solution. Single knockdown of TRPC6 and TRPC1 resulted in a comparable suppression on Ca2+ entry with double knockdown of both. These results suggest that TRPC6 may regulate GFR by modulating MC contractile function through multiple Ca2+ signaling pathways.
Conflict of interest statement
The authors declare that they have no competing interests.
Figures

Similar articles
-
Downregulation of TRPC6 protein expression by high glucose, a possible mechanism for the impaired Ca2+ signaling in glomerular mesangial cells in diabetes.Am J Physiol Renal Physiol. 2007 Oct;293(4):F1381-90. doi: 10.1152/ajprenal.00185.2007. Epub 2007 Aug 15. Am J Physiol Renal Physiol. 2007. PMID: 17699555
-
The synthetic triterpenoid, RTA 405, increases the glomerular filtration rate and reduces angiotensin II-induced contraction of glomerular mesangial cells.Kidney Int. 2013 May;83(5):845-54. doi: 10.1038/ki.2012.393. Epub 2012 Dec 12. Kidney Int. 2013. PMID: 23235569 Free PMC article.
-
Abundance of TRPC6 protein in glomerular mesangial cells is decreased by ROS and PKC in diabetes.Am J Physiol Cell Physiol. 2011 Aug;301(2):C304-15. doi: 10.1152/ajpcell.00014.2011. Epub 2011 Apr 27. Am J Physiol Cell Physiol. 2011. PMID: 21525431 Free PMC article.
-
New insights into the contribution of arterial NCX to the regulation of myogenic tone and blood pressure.Adv Exp Med Biol. 2013;961:329-43. doi: 10.1007/978-1-4614-4756-6_28. Adv Exp Med Biol. 2013. PMID: 23224892 Review.
-
The Effects of TRPC6 Knockout in Animal Models of Kidney Disease.Biomolecules. 2022 Nov 18;12(11):1710. doi: 10.3390/biom12111710. Biomolecules. 2022. PMID: 36421724 Free PMC article. Review.
Cited by
-
Non-voltage-gated Ca2+ channel signaling in glomerular cells in kidney health and disease.Am J Physiol Renal Physiol. 2024 Aug 1;327(2):F249-F264. doi: 10.1152/ajprenal.00130.2024. Epub 2024 Jun 13. Am J Physiol Renal Physiol. 2024. PMID: 38867675 Free PMC article. Review.
-
Mesenchymal Stem Cells Attenuate Renal Fibrosis via Exosomes-Mediated Delivery of microRNA Let-7i-5p Antagomir.Int J Nanomedicine. 2021 May 25;16:3565-3578. doi: 10.2147/IJN.S299969. eCollection 2021. Int J Nanomedicine. 2021. PMID: 34079249 Free PMC article.
-
Insights into the Regulation of GFR by the Keap1-Nrf2 Pathway.Kidney360. 2023 Oct 1;4(10):1454-1466. doi: 10.34067/KID.0000000000000171. Epub 2023 Jun 2. Kidney360. 2023. PMID: 37265366 Free PMC article.
-
Sex and strain differences in renal hemodynamics in mice.Physiol Rep. 2023 Mar;11(6):e15644. doi: 10.14814/phy2.15644. Physiol Rep. 2023. PMID: 36946063 Free PMC article.
-
Transient receptor potential canonical 6 knockdown ameliorated diabetic kidney disease by inhibiting nuclear factor of activated T cells 2 expression in glomerular mesangial cells.Ren Fail. 2022 Dec;44(1):1780-1790. doi: 10.1080/0886022X.2022.2134796. Ren Fail. 2022. PMID: 36285371 Free PMC article.
References
-
- Stockand JD, Sansom SC. Glomerular mesangial cells: electrophysiology and regulation of contraction. Physiol. Rev. 1998;78:723–744. - PubMed
Publication types
MeSH terms
Substances
Grants and funding
LinkOut - more resources
Full Text Sources
Other Literature Sources
Molecular Biology Databases
Miscellaneous
