. 2017 Jun 23;7(1):4200.
doi: 10.1038/s41598-017-04520-z.

A Comprehensive Mouse Transcriptomic BodyMap across 17 Tissues by RNA-seq

Affiliations

A Comprehensive Mouse Transcriptomic BodyMap across 17 Tissues by RNA-seq

Bin Li et al. Sci Rep. .

Abstract

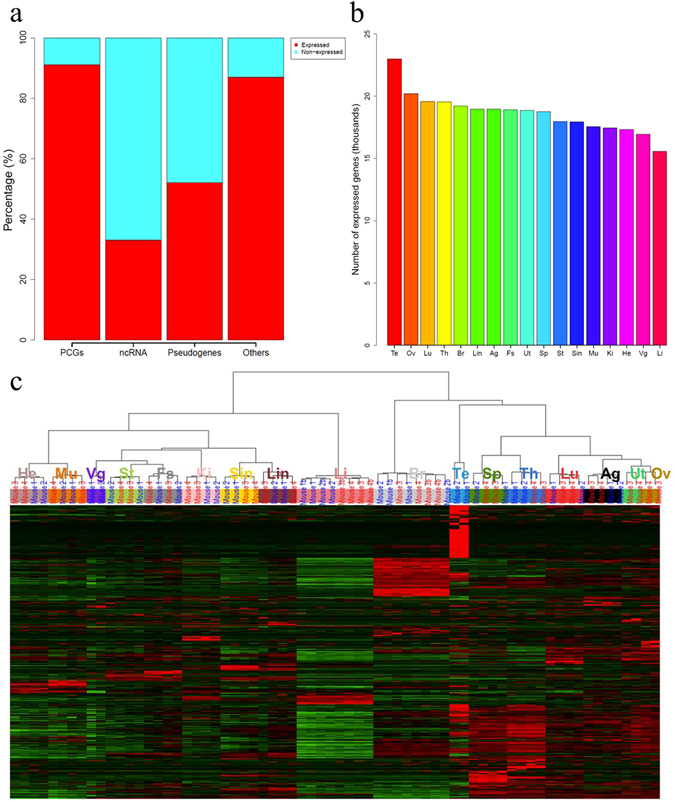
The mouse has been widely used as a model organism for studying human diseases and for evaluating drug safety and efficacy. Many diseases and drug effects exhibit tissue specificity that may be reflected by tissue-specific gene-expression profiles. Here we construct a comprehensive mouse transcriptomic BodyMap across 17 tissues of six-weeks old C57BL/6JJcl mice using RNA-seq. We find different expression patterns between protein-coding and non-coding genes. Liver expressed the least complex transcriptomes, that is, the smallest number of genes detected in liver across all 17 tissues, whereas testis and ovary harbor more complex transcriptomes than other tissues. We report a comprehensive list of tissue-specific genes across 17 tissues, along with a list of 4,781 housekeeping genes in mouse. In addition, we propose a list of 27 consistently and highly expressed genes that can be used as reference controls in expression-profiling analysis. Our study provides a unique resource of mouse gene-expression profiles, which is helpful for further biomedical research.


Conflict of interest statement

The authors declare that they have no competing interests.

Figures

Figure 1
Figure 1
Landscape of the mouse transcriptome. (a) Percentage of expressed (red, FPKM > = 0.1 in at least one sample) and non-expressed (blue, FPKM < 0.1 across all samples) genes by different gene types. PCGs: protein-coding genes; ncRNA: non-coding RNA genes; Others: other genes except PCGs, ncRNA, and pseudogenes. (b) Number of expressed (FPKM > 0.1) genes by tissues. Numbers were averaged over all biological samples for a given tissue. (c) Hierarchical clustering analysis of gene expression profiles of 68 samples with 31,687 genes. Each column indicated a sample, whereas each row indicated a gene. Each tissue symbol was shown upon the color bar for each cluster. The mouse information where each sample came from was also labeled upon the color bar. Mouse 1 and Mouse 2 were two male mice (in blue text), while Mouse 3 and Mouse 4 were two female mice (in red text) as shown in Table 1.
Figure 2
Figure 2
Tissue-dependent differentially expressed genes. (a) Number of differentially expressed genes (FDR < 0.05, fold change >2 or <0.5) for each pairwise organs. For each tissue in each column, the figures indicated the numbers of down-regulated genes comparing this tissue to the other tissues. For each tissue in each row, the figures indicated the numbers of up-regulated genes comparing this tissue to the other tissues. The tissues are in the same order as in Fig. 1c. (b) Expression profiles of 5,035 tissue-specific genes across 68 samples were arranged by tissue types (in decreasing order based on the number of organ-enriched genes). Testis expressed the most tissue-specific genes among all tissues.
Figure 3
Figure 3
4,781 genes were identified as mouse candidate housekeeping genes. (a) Chromosome distribution of the 4,781 housekeeping genes. The exact number for each chromosome was highlighted in blue figure. Upper panel: the absolute number of housekeeping genes identified on each chromosome; lower panel: percentage of housekeeping genes on each chromosome (divided by the total number of genes on each chromosome). (b) 2,608 genes were both identified as housekeeping genes in mouse (our study, red circle) and human (Eisenberg’s study, blue circle). (c) Expression profiles of the 4,781 genes by groups. Red: genes also identified as housekeeping genes in human; Green: genes not identified in human. (d) Expression of four well-known housekeeping genes (Gapdh, Actb, Hprt, and B2m). Only Hprt was found in our list of housekeeping genes.

References

    1. Zheng-Bradley X, Rung J, Parkinson H, Brazma A. Large scale comparison of global gene expression patterns in human and mouse. Genome Biol. 2010;11:R124. doi: 10.1186/gb-2010-11-12-r124. - DOI - PMC - PubMed
    1. Yue F, Cheng Y, Breschi A, et al. A comparative encyclopedia of DNA elements in the mouse genome. Nature. 2014;515:355–364. doi: 10.1038/nature13992. - DOI - PMC - PubMed
    1. Lukk M, Kapushesky M, Nikkila J, et al. A global map of human gene expression. Nat Biotechnol. 2010;28:322–324. doi: 10.1038/nbt0410-322. - DOI - PMC - PubMed
    1. Dermitzakis ET. From gene expression to disease risk. Nat Genet. 2008;40:492–493. doi: 10.1038/ng0508-492. - DOI - PubMed
    1. Grada A, Weinbrecht K. Next-generation sequencing: methodology and application. J Invest Dermatol. 2013;133:e11. doi: 10.1038/jid.2013.248. - DOI - PubMed

Publication types