Effect of ezetimibe add-on therapy over 52 weeks extension analysis of prospective randomized trial (RESEARCH study) in type 2 diabetes subjects
- PMID: 28646901
- PMCID: PMC5483302
- DOI: 10.1186/s12944-017-0508-4
Effect of ezetimibe add-on therapy over 52 weeks extension analysis of prospective randomized trial (RESEARCH study) in type 2 diabetes subjects
Abstract
Background: Lowering cholesterol levels decreases the risk of atherosclerotic diseases. Effective ways to stably reduce LDL-C level are warranted in type 2 diabetic patients, a high-risk population for CVD, with various anti-diabetic therapeutic background. The RESEARCH study focuses on LDL-C reduction in this population along with modifications of the lipid profiles. We evaluated long-term ezetimibe add-on therapy in T2DM patients with hypercholesterolemia.
Methods: In a randomized, multicenter, open-label, prospective study, a total of 109 T2DM patients not attaining LDL-C target value despite first-line dose statin (10 mg of atorvastatin or 1 mg of pitavastatin) therapy in Japan were recruited. We investigated the difference in cholesterol lowering effect between ezetimibe (10 mg) add-on statin (EAT) group and double-dose statin (DST) group. Changes of parameters related to atherosclerotic event risks were assessed.
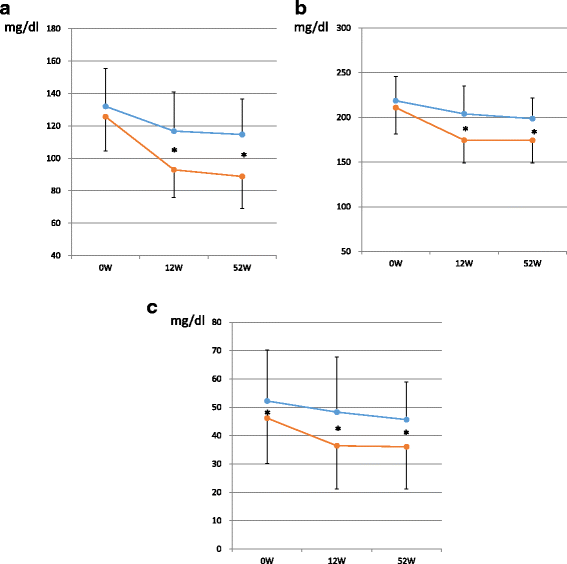
Results: The reduction of LDL-C was larger in the EAT group (28.3%) than in the DST group (9.2%) at 52 weeks as well as the primary endpoint of 12 weeks. EAT achieved significant lower levels of TC and apo B, respectively. Both treatments attained significant reduction in sd-LDL-C or hsCRP on this long-term basis. Notably, sd-LDL-C in EAT reduced as low as 36.1 ± 14.9 mg/dl to reach near the threshold (35.0 mg/dl) for atherosclerosis with significantly higher achievement rate (55.6%) than DST treatment. Simultaneously, hsCRP reduction by EAT attained as low value as 0.52 ± 0.43 mg/l.
Conclusions: In the present 52-week long-term period, ezetimibe add-on therapy showed a robust advantage in lowering LDL-C and in attaining target LDL-C values compared with the doubling of statin dose. Moreover, it's meaningful that sd-LDL, powerfully atherogenic lipoprotein, exhibited prominent decrease consistently prominently by ezetimibe add-on therapy. DM patients with hypercholesterolemia are at high risk for CAD, and adding ezetimibe onto usual-dose statin treatment in Japan has been suggested as the first-line therapy for those DM patients who failed to attain the target LDL-C value (UMIN000002593).
Figures


References
Publication types
MeSH terms
Substances
LinkOut - more resources
Full Text Sources
Other Literature Sources
Medical
Miscellaneous

