

Abstinence from prolonged ethanol exposure affects plasma corticosterone, glucocorticoid receptor signaling and stress-related behaviors
- PMID: 28647675
- PMCID: PMC5557646
- DOI: 10.1016/j.psyneuen.2017.06.006
Abstinence from prolonged ethanol exposure affects plasma corticosterone, glucocorticoid receptor signaling and stress-related behaviors
Abstract
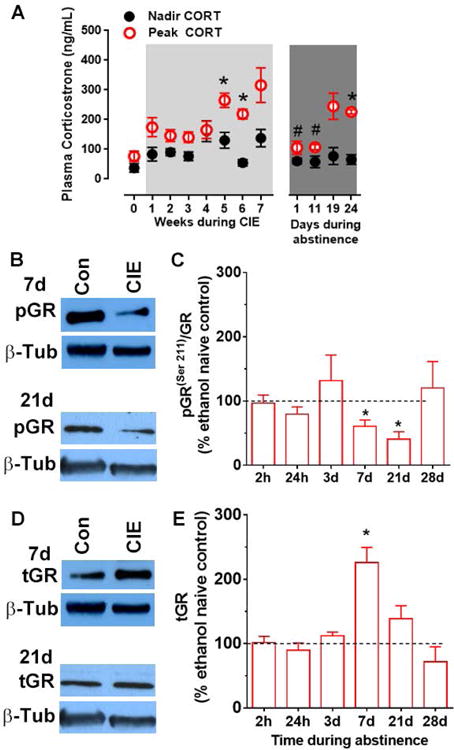
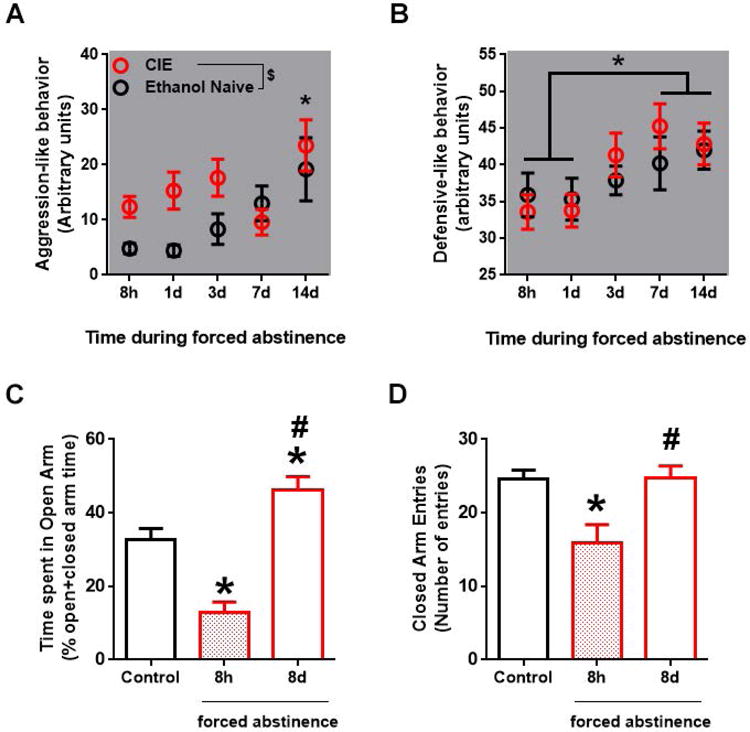
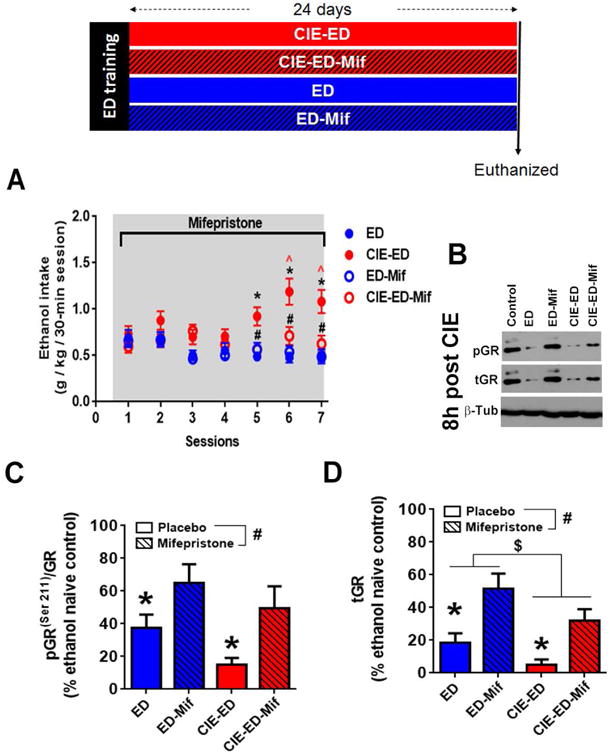
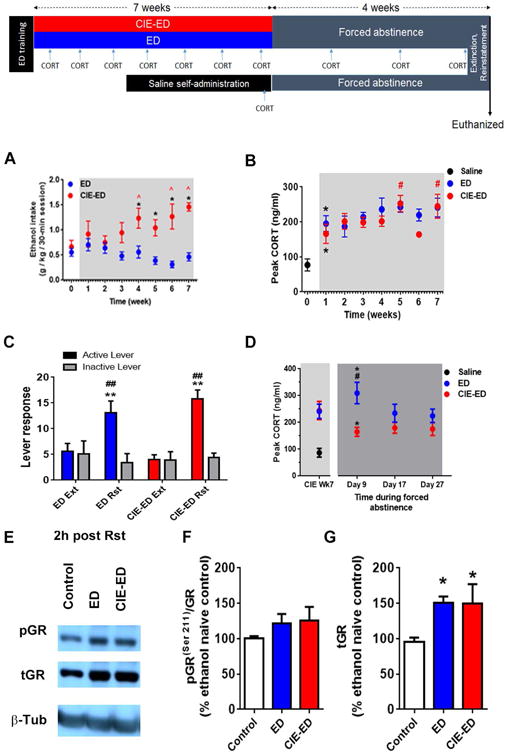
Alcohol dependence is linked to dysregulation of the hypothalamic-pituitary-adrenal axis. Here, we investigated effects of repeated ethanol intoxication-withdrawal cycles (using chronic intermittent ethanol vapor inhalation; CIE) and abstinence from CIE on peak and nadir plasma corticosterone (CORT) levels. Irritability- and anxiety-like behaviors as well as glucocorticoid receptors (GR) in the medial prefrontal cortex (mPFC) were assessed at various intervals (2h-28d) after cessation of CIE. Results show that peak CORT increased during CIE, transiently decreased during early abstinence (1-11d), and returned to pre-abstinence levels during protracted abstinence (17-27d). Acute withdrawal from CIE enhanced aggression- and anxiety-like behaviors. Early abstinence from CIE reduced anxiety-like behavior. mPFC-GR signaling (indexed by relative phosphorylation of GR at Ser211) was transiently decreased when measured at time points during early and protracted abstinence. Further, voluntary ethanol drinking in CIE (CIE-ED) and CIE-naïve (ED) rats, and effects of CIE-ED and ED on peak CORT levels and mPFC-GR were investigated during acute withdrawal (8h) and protracted abstinence (28d). CIE-ED and ED increased peak CORT during drinking. CIE-ED and ED decreased expression and signaling of mPFC-GR during acute withdrawal, an effect that was reversed by systemic mifepristone treatment. CIE-ED and ED demonstrate robust reinstatement of ethanol seeking during protracted abstinence and show increases in mPFC-GR expression. Collectively, the data demonstrate that acute withdrawal from CIE produces robust alterations in GR signaling, CORT and negative affect symptoms which could facilitate excessive drinking. The findings also show that CIE-ED and ED demonstrate enhanced relapse vulnerability triggered by ethanol cues and these changes are partially mediated by altered GR expression in the mPFC. Taken together, transition to alcohol dependence could be accompanied by alterations in mPFC stress-related pathways that may increase negative emotional symptoms and increase vulnerability to relapse.
Keywords: Abstinence; Aggression; Anxiety; Corticosterone; Glucocorticoid receptor; Medial prefrontal cortex.
Copyright © 2017 Elsevier Ltd. All rights reserved.
Conflict of interest statement
Conflict of Interest: The authors report no conflict of interests.
Figures
Similar articles
-
Protracted abstinence from chronic ethanol exposure alters the structure of neurons and expression of oligodendrocytes and myelin in the medial prefrontal cortex.Neuroscience. 2015 May 7;293:35-44. doi: 10.1016/j.neuroscience.2015.02.043. Epub 2015 Feb 28. Neuroscience. 2015. PMID: 25732140 Free PMC article.
-
Acute oral administration of the novel, competitive and selective glucocorticoid receptor antagonist ORG 34517 reduces the severity of ethanol withdrawal and related hypothalamic-pituitary-adrenal axis activation.Drug Alcohol Depend. 2015 Sep 1;154:100-4. doi: 10.1016/j.drugalcdep.2015.06.018. Epub 2015 Jun 22. Drug Alcohol Depend. 2015. PMID: 26143299 Free PMC article.
-
Role of corticosterone in anxiety- and depressive-like behavior and HPA regulation following prenatal alcohol exposure.Prog Neuropsychopharmacol Biol Psychiatry. 2019 Mar 2;90:1-15. doi: 10.1016/j.pnpbp.2018.10.008. Epub 2018 Oct 24. Prog Neuropsychopharmacol Biol Psychiatry. 2019. PMID: 30367959 Free PMC article.
-
Divergent regulation of distinct glucocorticoid systems in alcohol dependence.Alcohol. 2015 Dec;49(8):811-6. doi: 10.1016/j.alcohol.2015.04.004. Epub 2015 Apr 30. Alcohol. 2015. PMID: 26003866 Free PMC article. Review.
-
Hypothalamic-pituitary-adrenal axis activity in post-traumatic stress disorder and cocaine use disorder.Stress. 2020 Nov;23(6):638-650. doi: 10.1080/10253890.2020.1803824. Epub 2020 Aug 24. Stress. 2020. PMID: 32835581 Review.
Cited by
-
Chronic voluntary caffeine intake in male Wistar rats reveals individual differences in addiction-like behavior.Pharmacol Biochem Behav. 2020 Apr;191:172880. doi: 10.1016/j.pbb.2020.172880. Epub 2020 Feb 24. Pharmacol Biochem Behav. 2020. PMID: 32105663 Free PMC article.
-
Oxytocin treatment for alcoholism: Potential neurocircuitry targets.Neuropharmacology. 2020 Jul;171:108091. doi: 10.1016/j.neuropharm.2020.108091. Epub 2020 Apr 15. Neuropharmacology. 2020. PMID: 32304701 Free PMC article. Review.
-
Central amygdala corticotropin-releasing factor neurons promote hyponeophagia but do not control alcohol drinking in mice.Mol Psychiatry. 2022 May;27(5):2502-2513. doi: 10.1038/s41380-022-01496-9. Epub 2022 Mar 9. Mol Psychiatry. 2022. PMID: 35264727 Free PMC article.
-
Affective Disturbances During Withdrawal from Chronic Intermittent Ethanol Inhalation in C57BL/6J and DBA/2J Male Mice.Alcohol Clin Exp Res. 2018 Jul;42(7):1281-1290. doi: 10.1111/acer.13760. Epub 2018 May 21. Alcohol Clin Exp Res. 2018. PMID: 29687895 Free PMC article.
-
Multi-modal imaging reveals differential brain volumetric, biochemical, and white matter fiber responsivity to repeated intermittent ethanol vapor exposure in male and female rats.Neuropharmacology. 2020 Jun 15;170:108066. doi: 10.1016/j.neuropharm.2020.108066. Epub 2020 Mar 30. Neuropharmacology. 2020. PMID: 32240669 Free PMC article.
References
-
- Akana SF, Chu A, Soriano L, Dallman MF. Corticosterone exerts site-specific and state-dependent effects in prefrontal cortex and amygdala on regulation of adrenocorticotropic hormone, insulin and fat depots. J Neuroendocrinol. 2001;13:625–637. - PubMed
-
- Allen C, Kendall JW. Maturation of the circadian rhythm of plasma corticosterone in the rat. Endocrinology. 1967;80:926–930. - PubMed
-
- Almeida SS, Garcia RA, de Oliveira LM. Effects of early protein malnutrition and repeated testing upon locomotor and exploratory behaviors in the elevated plus-maze. Physiol Behav. 1993;54:749–752. - PubMed
-
- Apter SJ, Eriksson CJP. The role of social isolation in the effects of alcohol on corticosterone and testosterone levels of alcohol-preferring and non-preferring rats. Alcohol Alcoholism. 2006;41:33–38. - PubMed
MeSH terms
Substances
Grants and funding
LinkOut - more resources
Full Text Sources
Other Literature Sources
