. 2017 Jul-Aug;14(4):241-251.
doi: 10.21873/cgp.20035.

Increased Expression of Follistatin in Breast Cancer Reduces Invasiveness and Clinically Correlates with Better Survival

Affiliations

Increased Expression of Follistatin in Breast Cancer Reduces Invasiveness and Clinically Correlates with Better Survival

Catherine Zabkiewicz et al. Cancer Genomics Proteomics. 2017 Jul-Aug.

Abstract

Background/aim: Activin and its antagonist follistatin (FST) have been implicated in several solid tumours. This study investigated the role of FST in breast cancer.

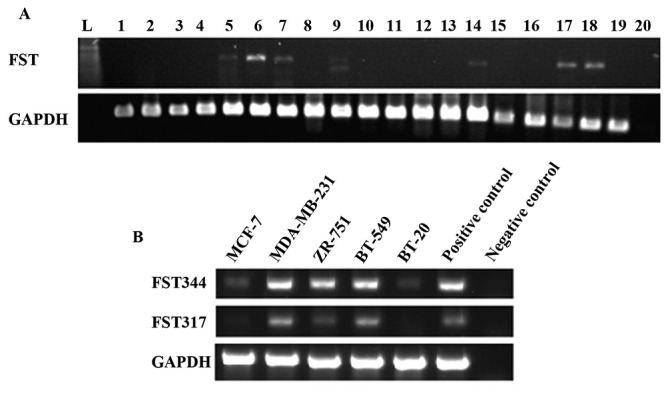
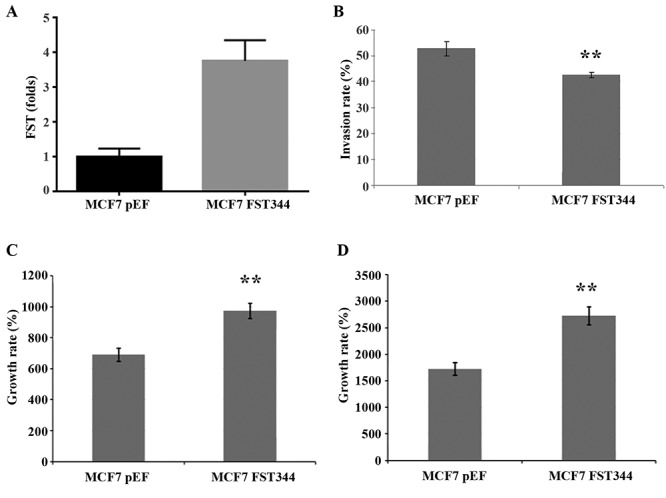
Materials and methods: FST expression was examined using reverse transcription polymerase chain reaction (RT-PCR), real-time quantitative polymerase chain reaction (qPCR) and immunohistochemistry in a cohort of breast cancer samples. Expression was correlated to pathological and prognostic parameters in our patient cohort. FST was overexpressed in MCF-7 cells and assays for growth and invasion were performed.

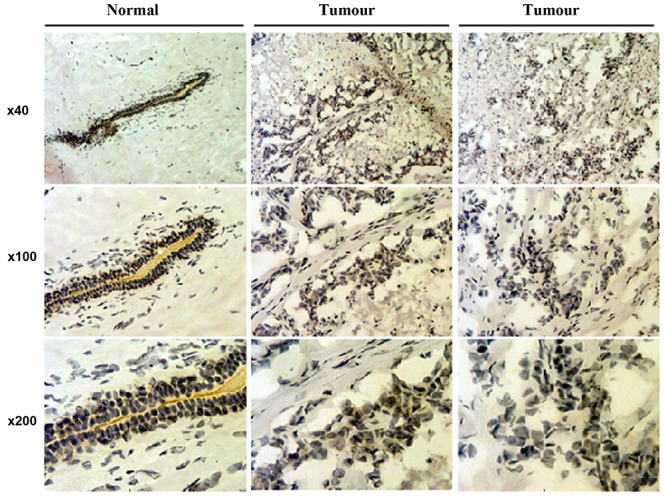
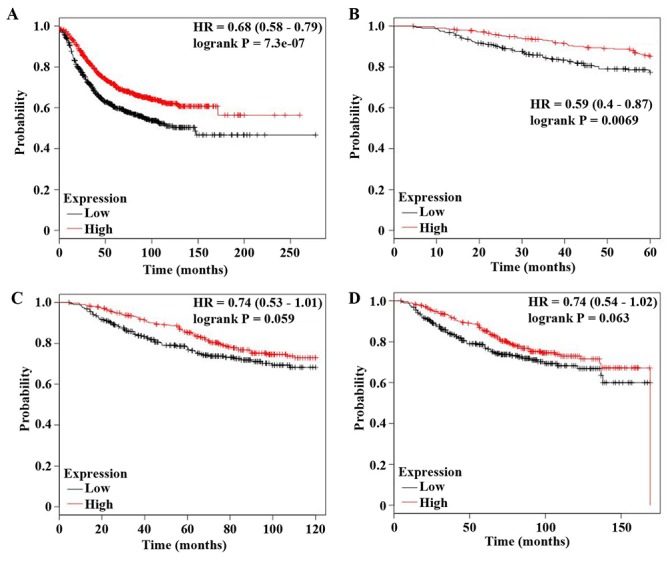
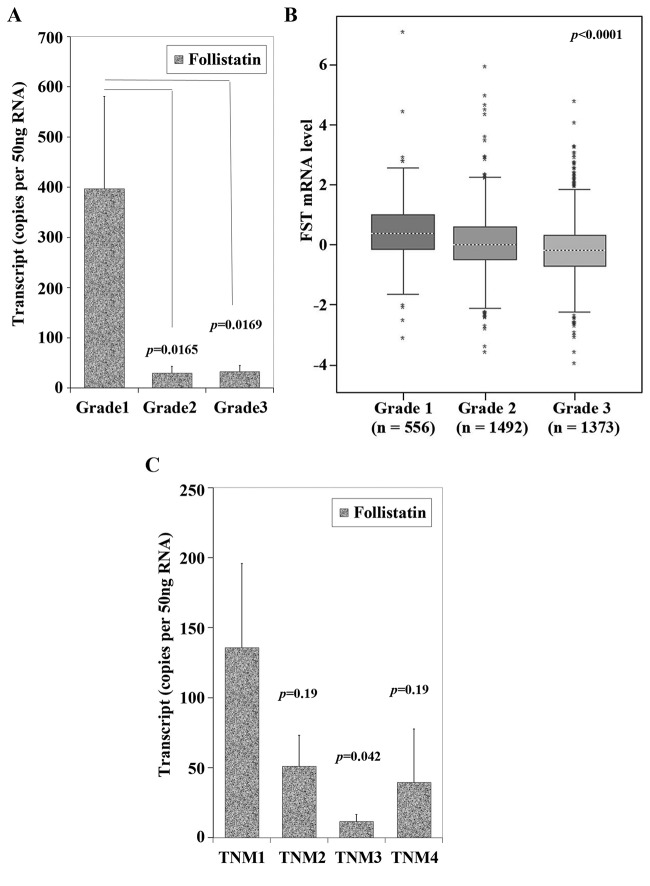
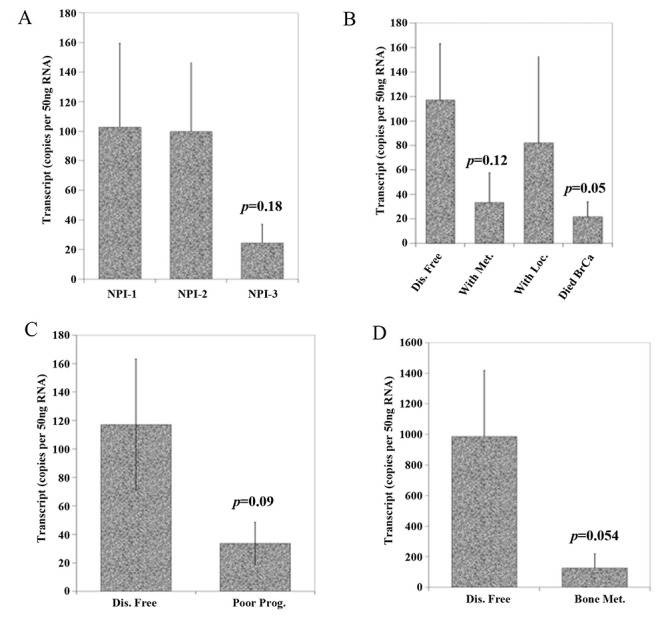
Results: FST is expressed in breast tissue, in the cytoplasm of mammary epithelial cells. Expression was decreased in breast cancer tissue in comparison to normal mammary tissue. Over-expression of FST in vitro led to significantly increased growth rate and reduced invasion. Higher FST associates with lower-grade tumours and better survival.

Conclusion: Our results suggest a role for FST as a suppressor of invasion and metastasis in breast cancer.

Keywords: Follistatin; breast cancer; survival.


Figures

Figure 1
Figure 1. Expression of follistatin in human tissues and breast cancer cell lines. (A) The expression of follistatin transcripts in different human tissues using RT-PCR. L is DNA ladder. 1-4 are placenta. 5-7 are ovary. 8 and 9 are normal breast tissues. 10 is omentum. 11 is liver. 12 and 13 are skin. 14 is colon. 15 is bone. 16 and 17 are breast cancer tissue. 18 and 19 are prostate cancer tissues. 20 is negative control. (B) Follistatin transcript splicing variants (FST344, NM_013409.2 and FST317, NM_006350.3) were detected in five breast cancer cell lines, i.e. MCF-7, MDAMB-231, ZR-751, BT-549 and Bt-20, using RT-PCR.
Figure 2
Figure 2. Immunochemical staining of follistatin in human breast carcinomas, ductal carcinoma in situ (middle) and invasive ductal carcinoma (right) in comparison to normal breast tissues (left).
Figure 3
Figure 3. FST overexpression model and functional assays. (A) FST344 expression plasmid produced a 3.5-fold increase in FST expression compared to pEF control plasmid in the transfected MCF-7 cells. (B) Invasion assay demonstrating a significantly reduced invasion rate in FST-overexpressing MCF-7 cells compared to control (p<0.001). (C) Percentage growth rate at day three of the assay, with significant increase in growth rate in FST overexpressing MCF-7 cells compared to control (p<0.0001). (D) This is maintained at day five of growth assay (p<0.0001).
Figure 4
Figure 4. Correlation of FST expression to patient survival. (A) Relapse-free survival is better in tumours with higher FST expression (p<0.001). (B) Overall patient survival over 5 years follow-up shows significantly better survival in those with higher FST expression (p=0.007). (C) Overall patient survival over 10 years and (D) 20 years follow-up do not reach statistical significance in terms of survival difference (p=0.06), but does show a similar trend regarding better survival with higher FST expression.
Figure 5
Figure 5. Expression of FST is associated with tumour grade and TNM staging. A) FST qPCR transcript levels from our clinical cohort according to patient’s histological tumour grade. The X axis represents tumour grade, a reflection of how differentiated and therefore how ‘aggressive’ it’s potential for invasion. Grade 1 is well differentiated, Grade 2 is moderately differentiated, whilst Grade 3 is poorly differentiated tumour. Those with grade 2 and 3 tumours had lower FST levels than grade 1 (p=0.0165 and 0.0169 respectively). B) Gene expression miner uses publicly available patient expression data from patient breast cancer tissue. Low FST expression correlated with higher grade, poorly differentiated breast tumours (p<0.0001), similar to our cohort in panel A. C) FST qPCR transcript levels according to TNM staging. Those tumours that are TNM stage 1 (i.e. smaller size, with less nodal and distant metastases) had higher FST expression than TNM 2, 3 and 4 (p=0.19, 0.042 and 0.19 respectively).
Figure 6
Figure 6. A) FST qPCR transcript levels according to patient’s Nottingham Prognostic Index level. Those with lower FST has a poorer prognostic score, but this does not reach significance (p=0.18). B) FST qPCR transcript levels according to disease outcomes showing those that died from their disease have a lower FST expression compared to those remaining disease free (p=0.05). C) and D) FST expression transcripts were higher in those remaining disease-free compared to those with poor prognosis (all though this did not reach significance p=0.09) and those with bone metastases (p=0.054).

References

    1. Tsuchida K, Nakatani M, Hitachi K, Uezumi A, Sunada Y, Ageta H, Inokuchi K. Activin signaling as an emerging target for therapeutic interventions. Cell Commun Signal. 2009;7:15. - PMC - PubMed
    1. Nolan K, Thompson TB. Bmp and bmp regulation: Structure and function. In: Bone morphogenetic proteins: Systems biology regulators. Vukicevic S and Sampath KT (eds.) Springer International Publishing. 2017:pp. 73–111.
    1. Krneta J, Kroll J, Alves F, Prahst C, Sananbenesi F, Dullin C, Kimmina S, Phillips DJ, Augustin HG. Dissociation of angiogenesis and tumorigenesis in follistatin- and activin-expressing tumors. Cancer Res. 2006;66(11):5686–5695. - PubMed
    1. Harrison CA, Gray PC, Vale WW, Robertson DM. Antagonists of activin signaling: Mechanisms and potential biological applications. Trends Endocrinol Metab. 2005;16(2):73–78. - PubMed
    1. Sugino K, Kurosawa N, Nakamura T, Takio K, Shimasaki S, Ling N, Titani K, Sugino H. Molecular heterogeneity of follistatin, an activin-binding protein. Higher affinity of the carboxyl-terminal truncated forms for heparan sulfate proteoglycans on the ovarian granulosa cell. J Biol Chem. 1993;268(21):15579–15587. - PubMed