. 2017 Jul 10;32(1):57-70.e3.
doi: 10.1016/j.ccell.2017.05.009. Epub 2017 Jun 22.

Common Molecular Subtypes Among Asian Hepatocellular Carcinoma and Cholangiocarcinoma

Affiliations

Common Molecular Subtypes Among Asian Hepatocellular Carcinoma and Cholangiocarcinoma

Jittiporn Chaisaingmongkol et al. Cancer Cell. .

Abstract

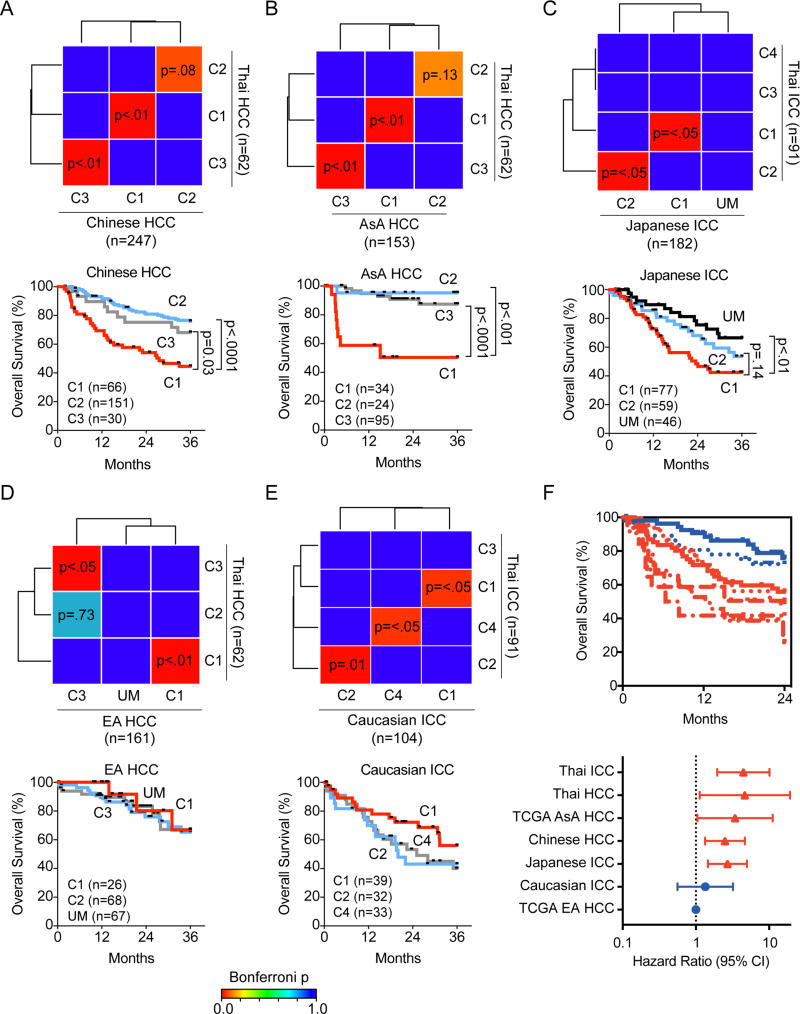
Intrahepatic cholangiocarcinoma (ICC) and hepatocellular carcinoma (HCC) are clinically disparate primary liver cancers with etiological and biological heterogeneity. We identified common molecular subtypes linked to similar prognosis among 199 Thai ICC and HCC patients through systems integration of genomics, transcriptomics, and metabolomics. While ICC and HCC share recurrently mutated genes, including TP53, ARID1A, and ARID2, mitotic checkpoint anomalies distinguish the C1 subtype with key drivers PLK1 and ECT2, whereas the C2 subtype is linked to obesity, T cell infiltration, and bile acid metabolism. These molecular subtypes are found in 582 Asian, but less so in 265 Caucasian patients. Thus, Asian ICC and HCC, while clinically treated as separate entities, share common molecular subtypes with similar actionable drivers to improve precision therapy.

Keywords: TIGER-LC; cancer driver; cancer genomics; hepatocellular carcinoma; integrated genomics; intrahepatic cholangiocarcinoma; liver cancer; metabolomics; molecular subtypes; transcriptomics.


Figures

Figure 1
Figure 1. Identification of ICC and HCC molecular-based tumor subtypes
(A) A heatmap of ICC and HCC samples is shown by unsupervised hierarchical clustering of the most variable genes (+/− 2SD; n=587) among tumor specimens. (B) A principal components (PC) analysis of ICC and HCC tumor specimens is shown. (C) A heatmap of HCC subtypes is shown based on consensus clustering. The x-axis represents HCC subtype consensus clusters. HCC samples are represented in columns, grouped by the dendrogram into 3 main clusters and genes (n=370) are represented in rows. Z-scored gene expression are shown from −4 to 4. Clinical data of the samples are included below the heatmap. (D) A heatmap of ICC subtypes is shown as in (C). The x-axis represents ICC subtype consensus clusters and genes (n=1115) are represented in rows. See also Figure S1, Table S1.
Figure 2
Figure 2. Identification of common C1 and C2 molecular subtypes of ICC and HCC
(A) Subclass Mapping of ICC and HCC subtypes is shown. Significant relationships between subtypes are represented by Bonferroni adjusted p values. Significant associations showing similarity between subtypes are shown in red with p<0.05 while differences between subtypes (Bonferroni adjusted p=1) are shown in blue. (B) A heatmap of ICC and HCC C1 and C2 samples is shown by unsupervised hierarchical clustering of genes (n=1378) differentiating the C1 and C2 groups among tumor specimens. (C) Significant pathways, identified by GSEA analysis, of HCC or ICC-C1 or C2 subtypes is shown, represented by log10 p values from 2 to 0 (p value from 0.01 to 1). (D) Kaplan-Meier survival analysis of HCC subtypes (top panel) or ICC subtypes (bottom panel) is shown. See also Figure S1, Tables S2 and S3.
Figure 3
Figure 3. Similar HCC and ICC tumor subtypes are found in Asians from China, Japan and U.S
(A, B) Subclass Mapping of Thai HCC versus Chinese (A) or Asian American (AsA, B) HCC subtypes. (C) Subclass Mapping of Thai ICC versus Japanese ICC subtypes. (D) Subclass Mapping of Thai HCC versus Caucasian American (EA) HCC subtypes. (E) Subclass Mapping of Thai ICC versus Caucasian ICC subtypes. For A-E, significantly similar relationships between clusters are represented by Bonferroni-adjusted p values from 0 (similar) to 1 (different). Significant associations between clusters are shown in red with p<0.05 while differences between subtypes with p=1 are shown in blue. Subtypes in cohorts with no matching subtype to the Thai cohort is indicated with an UM (unmatched). The lower panels show Kaplan-Meier survival analysis of the subtypes indicated in the corresponding upper panel, with the number of samples in each subtype indicated. (F) Kaplan-Meier survival analysis of the ICC or HCC C1 subtype among various cohorts indicated (top panels) at a 2-year survival time cutoff with log-rank p value. Forest plots (bottom panels) show the hazard ratio with 95% confidence interval (CI) of the C1 subtype among various cohorts with the European American HCC patients from TCGA as the referent group since these individuals have the best overall survival. See also Figure S2, Table S4.
Figure 4
Figure 4. Mutation profiles and their functional consequences in Thai ICC and HCC
(A) Overview distribution of mutation types in ICC (n=129) and HCC (n=68). (B) Plot of ranked nucleotide substitutions presented as single nucleotide variant (SNV) density per Mb for ICC and HCC. (C) Proportions (mean ±SEM with 95% confidence interval) of SNVs identified in ICC and HCC. Differences calculated by Students t-test (*p<0.05). (D) Proportions (percentage) of SNVs in ICC and HCC as separated by either transitions or transversions. (E) Number (mean ±SEM) of transition (C>T) or transversions (A>C, C>T, and C>A) in ICC and HCC according to subtypes. (F) Overview of SNV per sample (number of variant changes per sample) according to different subtypes. See also Tables S5 and S6.
Figure 5
Figure 5. The landscape of driver genes in Thai ICC and HCC
An overview of driver genes in ICC (top panel) and HCC (bottom panel). Shown are genes with nonsynonymous and indel mutations of >5% frequencies. Genes were sorted by frequencies (right bar) and their alterations in each sample classified by cCluster-defined subtypes. Genes in bold are common between ICC and HCC. The status of hepatitis virus or Opisthorchis viverrini (OV) infection and variant frequency per sample are noted. Hypermutated samples are indicated as those with variant frequency above 10, indicated by the dotted horizontal line. See also Table S7.
Figure 6
Figure 6. Integration of somatic copy number alterations (SCNA) and gene expression to define subtype-related driver genes in ICC and HCC C1 and C2 subtypes
(A) The frequency of chromosomal aberrations is shown for the ICC-C1 subtype (top panel) or ICC-C2 subtype (bottom panel). Copy number gain or loss is shown in red or blue, respectively. (B) The frequency of chromosomal aberrations is shown for the HCC-C1 subtype (top panel) or HCC C2 subtype (bottom panel). (C) A VENN diagram showing a comparison between the number of driving events (high concordance of SCNA and gene expression) in the C1 subtype of ICC or HCC with onesided Fisher’s exact p=0.001 for the overlapping genes. (D) The relationship between high concordant genes and tumor subtypes is shown along with the frequency of samples with copy number variation (CNV). In the upper panel, red bars represent copy number gain (Gain), blue bars represent copy number loss (Loss), while dark red or black bars represent chromosomal amplification with increased gene expression (Gain + Up) or chromosomal deletion with increased gene expression (Loss + Up). Gene expression is represented by the pink and light blue bars to indicate increased (Up) or decreased (Down) expression in tumors. In the lower panel, the ratio of samples showing copy number changes for each subtype is shown. The color of the column bars indicates the tumor subtypes shown on the y-axis in the upper panel. (E) Ingenuity Pathway Analysis of the 51 driver genes indicating a relationship with the PLK signaling network. (F) Representative images of ICC and HCC cases are shown based on immunohistochemical staining for ECT2 or PLK1. Scale bars represent 10 mm. (G) Kaplan-Meier survival analysis of all ICC (top panel) and HCC (lower panel) cases based on the ratiometric combination of protein expression (ECT2/PLK1) is shown with log rank p value. Low and high cutoff is defined by ECT2/PLK1 ratio ≤1 for the low and >1 for the high group. See also Figure S3, Tables S8 and S9.
Figure 7
Figure 7. Bile-acid metabolism and inflammation are altered in the HCC C1 and C2 subtype
(A) Hierarchical clustering of HCC (n=29) based on 81 metabolites. Samples are represented in columns, and metabolites are represented in rows. Metabolite abundance is represented in log2. (B) Ingenuity Pathway Analysis of the highly concordant metabolite/gene network is shown. Upregulated metabolites in the C1 subtype or the C2 subtype are noted in pink or green, respectively. (C) Box-plots of the abundance of three representative bile-acid-related metabolites in C1 (n=15) and C2 (n=14) HCC samples are shown as first quartile, median and third quartile (bottom box, middle line and top box, respectively) with Student’s t-test p values. Whiskers represent minimum and maximum values. The number of cases in each subtype is indicated in parentheses. (D) CIBERSORT analysis of the HCC C1 versus the HCC C2 subtype is shown. High or low associations between cell types are shown on a scale from red to blue (1 to −1). The size of circles indicates the significance of the association, with larger circles representing higher significance. (E) The relative fraction of leukocyte types associated with C1 and C2 are shown. (F) Box-plots of the abundance of three leukocyte types in C1 and C2 HCC samples are shown as first quartile, median and third quartile (bottom box, middle line and top box, respectively) with Student’s t-test p value. Whiskers represent minimum and maximum values. See also Figure S4, Table S10.

References

    1. Andersen JB, Spee B, Blechacz BR, Avital I, Komuta M, Barbour A, Conner EA, Gillen MC, Roskams T, Roberts LR, et al. Genomic and genetic characterization of cholangiocarcinoma identifies therapeutic targets for tyrosine kinase inhibitors. Gastroenterology. 2012;142:1021–1031. e1015. - PMC - PubMed
    1. Banales JM, Cardinale V, Carpino G, Marzioni M, Andersen JB, Invernizzi P, Lind GE, Folseraas T, Forbes SJ, Fouassier L, et al. Expert consensus document: Cholangiocarcinoma: current knowledge and future perspectives consensus statement from the European Network for the Study of Cholangiocarcinoma (ENS-CCA) Nature reviews Gastroenterology & hepatology. 2016;13:261–280. - PubMed
    1. Bridgewater J, Galle PR, Khan SA, Llovet JM, Park JW, Patel T, Pawlik TM, Gores GJ. Guidelines for the diagnosis and management of intrahepatic cholangiocarcinoma. Journal of hepatology. 2014;60:1268–1289. - PubMed
    1. Budhu A, Roessler S, Zhao X, Yu Z, Forgues M, Ji J, Karoly E, Qin LX, Ye QH, Jia HL, et al. Integrated metabolite and gene expression profiles identify lipid biomarkers associated with progression of hepatocellular carcinoma and patient outcomes. Gastroenterology. 2013;144:1066–1075. - PMC - PubMed
    1. Calle EE, Rodriguez C, Walker-Thurmond K, Thun MJ. Overweight, obesity, and mortality from cancer in a prospectively studied cohort of U.S. adults. NEnglJ Med. 2003;348:1625–1638. - PubMed