Observational Study
. 2017 Oct;70(4):551-560.
doi: 10.1053/j.ajkd.2017.04.025. Epub 2017 Jun 23.

Risk of ESRD and Mortality Associated With Change in Filtration Markers

Affiliations
Observational Study

Risk of ESRD and Mortality Associated With Change in Filtration Markers

Casey M Rebholz et al. Am J Kidney Dis. 2017 Oct.

Abstract

Background: Using change in estimated glomerular filtration rate (eGFR) based on creatinine concentration as a surrogate outcome in clinical trials of chronic kidney disease has been proposed. Risk for end-stage renal disease (ESRD) and all-cause mortality associated with change in concentrations of other filtration markers has not been studied in chronic kidney disease populations.

Study design: Observational analysis of 2 clinical trials.

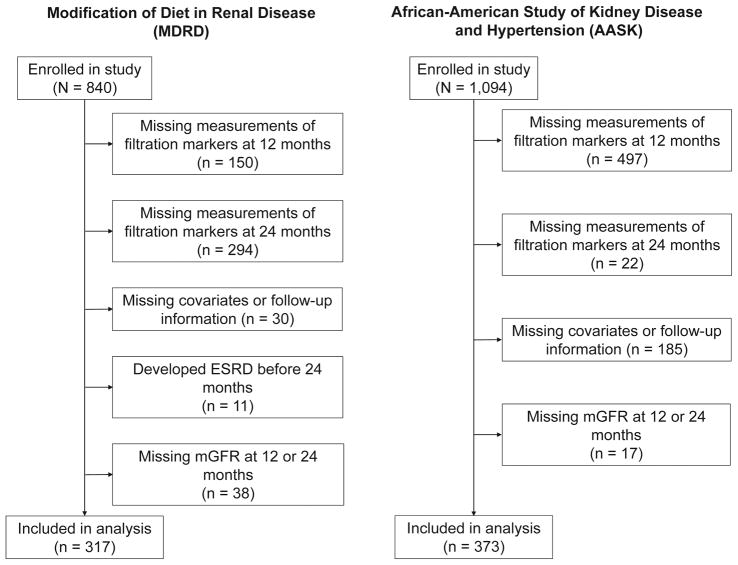
Setting & participants: Participants in the MDRD (Modification of Diet in Renal Disease; n=317) Study and AASK (African American Study of Kidney Disease and Hypertension; n=373).

Predictors: Creatinine, cystatin C, β-trace protein (BTP), and β2-microglobulin (B2M) were measured in serum samples collected at the 12- and 24-month follow-up visits, along with measured GFR (mGFR) at these time points.

Outcomes: ESRD and all-cause mortality.

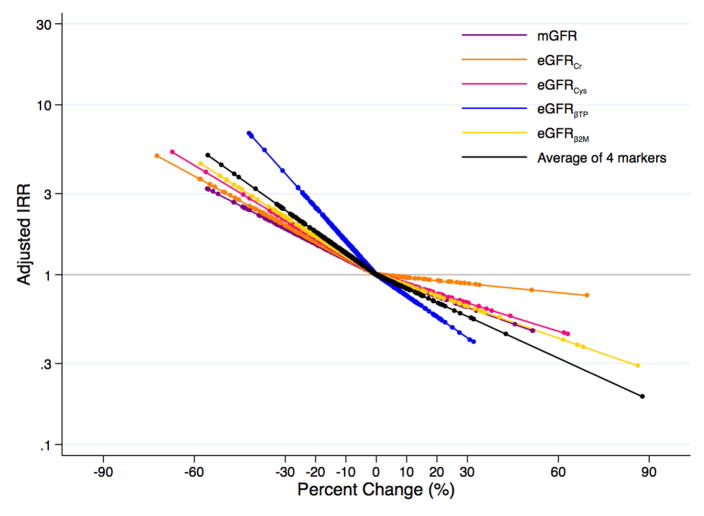
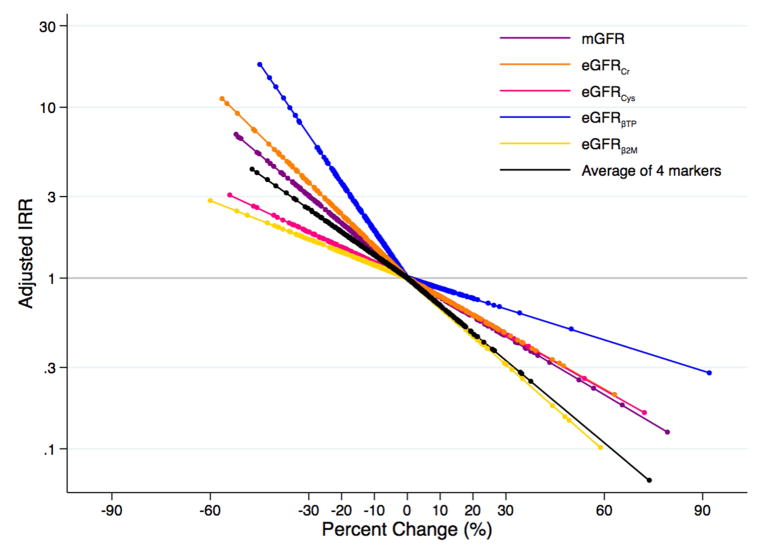
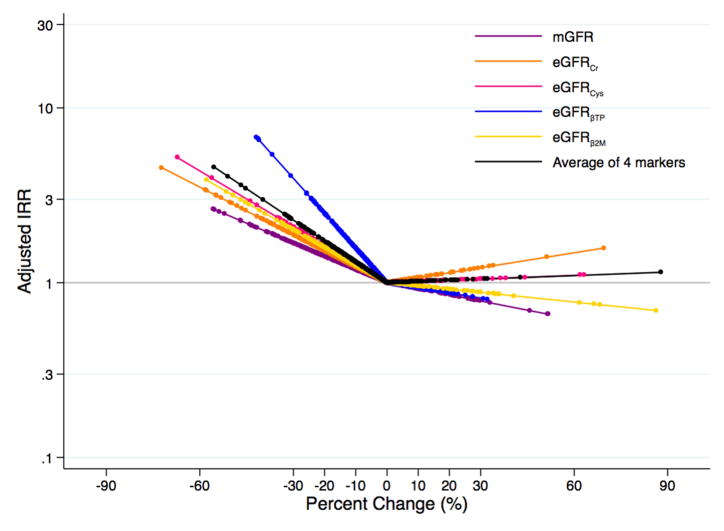
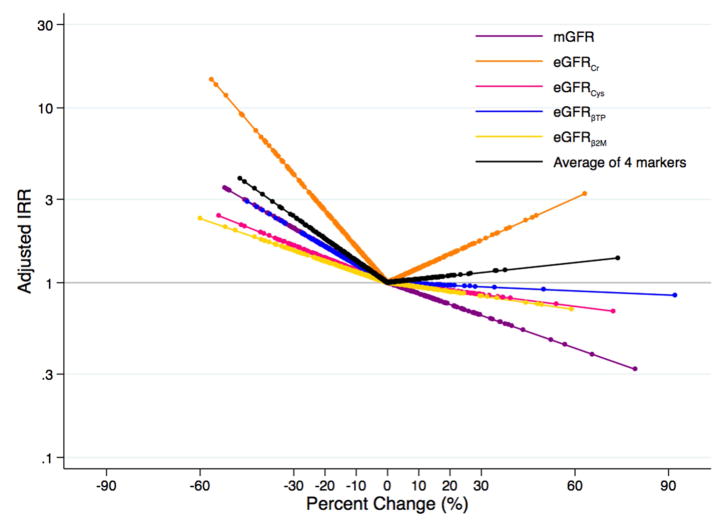
Measurements: Poisson regression was used to estimate incidence rate ratios and 95% CIs for ESRD and all-cause mortality during long-term follow-up (10-16 years) per 30% decline in mGFR or eGFR for each filtration marker and the average of all 4 markers.

Results: 1-year decline in mGFR, eGFRcr, eGFRBTP, and the average of the 4 filtration markers was significantly associated with increased risk for incident ESRD in both studies (all P≤0.02). Compared to mGFR, only decline in eGFRBTP was statistically significantly more strongly associated with ESRD risk in both studies (both P≤0.03). Decline in eGFRcr, but not mGFR or the other filtration markers, was significantly associated with risk for all-cause mortality in AASK only (incidence rate ratio per 30% decline, 4.17; 95% CI, 1.78-9.74; P<0.001), but this association was not significantly different from decline in mGFR (P=0.2).

Limitations: Small sample size.

Conclusions: Declines in mGFR, eGFRcr, eGFRBTP, and the average of 4 filtration markers (creatinine, cystatin C, BTP, and B2M) were consistently associated with progression to ESRD.

Keywords: Beta-2-microglobulin (B2M); beta trace protein (BTP); creatinine; cystatin C; death; end-stage renal disease (ESRD); estimated GFR; filtration markers; glomerular filtration rate (GFR); incident ESRD; kidney function decline; measured GFR; mortality.


Figures

Figure 1
Figure 1
Flow Diagram of Study Participant Selection in the Modification of Diet in Renal Disease Study and the African American Study of Kidney Disease and Hypertension
Figure 2
Figure 2
Kernel Density Plot of Change in Measured and Estimated Glomerular Filtration Ratea,b (A) in the Modification of Diet in Renal Disease Study and (B) in the African American Study of Kidney Disease and Hypertension amGFR in purple; eGFRcr in orange; eGFRcys in pink; eGFRBTP in blue; eGFRB2M in yellow; average of four filtration markers in black bMean (standard deviation) percent change over one year in the MDRD Study and AASK, respectively, was −10.0% (18.2%) and −4.2% (18.8%) for mGFR, −10.5% (19.0%) and −3.2% (16.9%) for eGFRcr, −1.0% (17.5%) and −2.6% (16.1%) for eGFRcys, −3.3% (11.6%) and −2.5% (22.5%) for eGFRBTP, −6.6% (18.9%) and −3.8% (14.7%) for eGFRB2M, and −5.4% (14.6%) and −3.0% (13.0%) for the average of the four filtration markers.
Figure 2
Figure 2
Kernel Density Plot of Change in Measured and Estimated Glomerular Filtration Ratea,b (A) in the Modification of Diet in Renal Disease Study and (B) in the African American Study of Kidney Disease and Hypertension amGFR in purple; eGFRcr in orange; eGFRcys in pink; eGFRBTP in blue; eGFRB2M in yellow; average of four filtration markers in black bMean (standard deviation) percent change over one year in the MDRD Study and AASK, respectively, was −10.0% (18.2%) and −4.2% (18.8%) for mGFR, −10.5% (19.0%) and −3.2% (16.9%) for eGFRcr, −1.0% (17.5%) and −2.6% (16.1%) for eGFRcys, −3.3% (11.6%) and −2.5% (22.5%) for eGFRBTP, −6.6% (18.9%) and −3.8% (14.7%) for eGFRB2M, and −5.4% (14.6%) and −3.0% (13.0%) for the average of the four filtration markers.
Figure 3
Figure 3
Adjusteda Risk of Incident End-Stage Renal Disease According to Changeb in Measured and Estimated Glomerular Filtration Ratec (A) in the Modification of Diet in Renal Disease Study and (B) in the African American Study of Kidney Disease and Hypertension aAdjusted for age, sex, race, body mass index, systolic blood pressure, diabetes, total cholesterol, randomized treatment group, study group (for MDRD Study only), and first measurement of mGFR or eGFR for the respective marker bPercent change modeled as linear spline terms with one knot at 0% cmGFR in purple; eGFRcr in orange; eGFRcys in pink; eGFRBTP in blue; eGFRB2M in yellow; average of four filtration markers in black
Figure 3
Figure 3
Adjusteda Risk of Incident End-Stage Renal Disease According to Changeb in Measured and Estimated Glomerular Filtration Ratec (A) in the Modification of Diet in Renal Disease Study and (B) in the African American Study of Kidney Disease and Hypertension aAdjusted for age, sex, race, body mass index, systolic blood pressure, diabetes, total cholesterol, randomized treatment group, study group (for MDRD Study only), and first measurement of mGFR or eGFR for the respective marker bPercent change modeled as linear spline terms with one knot at 0% cmGFR in purple; eGFRcr in orange; eGFRcys in pink; eGFRBTP in blue; eGFRB2M in yellow; average of four filtration markers in black
Figure 4
Figure 4
Adjusteda Risk of All-Cause Mortality According to Changeb in Measured and Estimated Glomerular Filtration Ratec (A) in the Modification of Diet in Renal Disease Study and (B) in the African American Study of Kidney Disease and Hypertension aAdjusted for age, sex, race, body mass index, systolic blood pressure, diabetes, total cholesterol, randomized treatment group, study group (for MDRD Study only), and first measurement of mGFR or eGFR for the respective marker bPercent change modeled as linear spline terms with one knot at 0% cmGFR in purple; eGFRcr in orange; eGFRcys in pink; eGFRBTP in blue; eGFRB2M in yellow; average of four filtration markers in black
Figure 4
Figure 4
Adjusteda Risk of All-Cause Mortality According to Changeb in Measured and Estimated Glomerular Filtration Ratec (A) in the Modification of Diet in Renal Disease Study and (B) in the African American Study of Kidney Disease and Hypertension aAdjusted for age, sex, race, body mass index, systolic blood pressure, diabetes, total cholesterol, randomized treatment group, study group (for MDRD Study only), and first measurement of mGFR or eGFR for the respective marker bPercent change modeled as linear spline terms with one knot at 0% cmGFR in purple; eGFRcr in orange; eGFRcys in pink; eGFRBTP in blue; eGFRB2M in yellow; average of four filtration markers in black

References

    1. Matsushita K, van der Velde M, Astor BC, et al. Association of estimated glomerular filtration rate and albuminuria with all-cause and cardiovascular mortality in general population cohorts: a collaborative meta-analysis. Lancet. 2010;375(9731):2073–2081. - PMC - PubMed
    1. Shlipak MG, Matsushita K, Arnlov J, et al. Cystatin C versus creatinine in determining risk based on kidney function. N Engl J Med. 2013;369(10):932–943. - PMC - PubMed
    1. Astor BC, Matsushita K, Gansevoort RT, et al. Lower estimated glomerular filtration rate and higher albuminuria are associated with mortality and end-stage renal disease. A collaborative meta-analysis of kidney disease population cohorts. Kidney Int. 2011;79(12):1331–1340. - PMC - PubMed
    1. Gansevoort RT, Matsushita K, van der Velde M, et al. Lower estimated GFR and higher albuminuria are associated with adverse kidney outcomes in both general and high-risk populations. A collaborative meta-analysis of general and high-risk population cohorts. Kidney Int. 2011;80(1):93–104. - PMC - PubMed
    1. van der Velde M, Matsushita K, Coresh J, et al. Lower estimated glomerular filtration rate and higher albuminuria are associated with all-cause and cardiovascular mortality. A collaborative meta-analysis of high-risk population cohorts. Kidney Int. 2011;79(12):1341–1352. - PubMed

Publication types