. 2017 Jul 6;21(1):65-77.e5.
doi: 10.1016/j.stem.2017.05.001. Epub 2017 Jun 22.

Dynamic Reorganization of Chromatin Accessibility Signatures during Dedifferentiation of Secretory Precursors into Lgr5+ Intestinal Stem Cells

Affiliations

Dynamic Reorganization of Chromatin Accessibility Signatures during Dedifferentiation of Secretory Precursors into Lgr5+ Intestinal Stem Cells

Unmesh Jadhav et al. Cell Stem Cell. .

Abstract

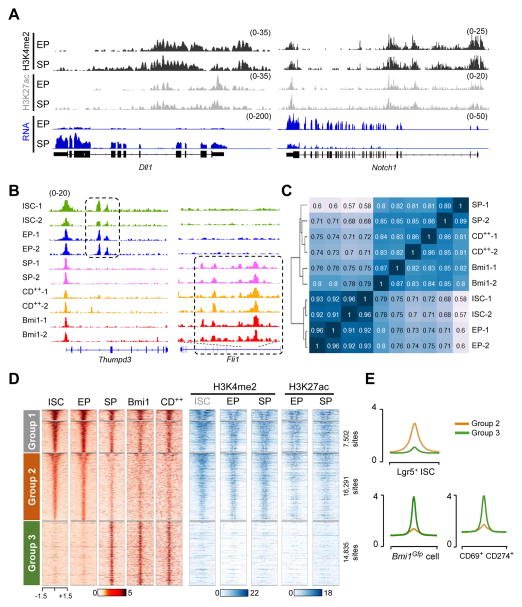
Replicating Lgr5+ stem cells and quiescent Bmi1+ cells behave as intestinal stem cells (ISCs) in vivo. Disrupting Lgr5+ ISCs triggers epithelial renewal from Bmi1+ cells, from secretory or absorptive progenitors, and from Paneth cell precursors, revealing a high degree of plasticity within intestinal crypts. Here, we show that GFP+ cells from Bmi1GFP mice are preterminal enteroendocrine cells and we identify CD69+CD274+ cells as related goblet cell precursors. Upon loss of native Lgr5+ ISCs, both populations revert toward an Lgr5+ cell identity. While active histone marks are distributed similarly between Lgr5+ ISCs and progenitors of both major lineages, thousands of cis elements that control expression of lineage-restricted genes are selectively open in secretory cells. This accessibility signature dynamically converts to that of Lgr5+ ISCs during crypt regeneration. Beyond establishing the nature of Bmi1GFP+ cells, these findings reveal how chromatin status underlies intestinal cell diversity and dedifferentiation to restore ISC function and intestinal homeostasis.

Keywords: accessible chromatin; cell plasticity; chromatin modulation; dedifferentiation; facultative stem cells; intestinal stem cells; reserve stem cells.


Figures

Figure 1
Figure 1. Bmi1Gfp cells belong to the EE lineage
(A) Confocal microscopy on optically cleared tissue confirms the distinct locations of Lgr5+ ISC (crypt base) and Bmi1Gfp cells (higher crypt tiers). Scale bar, 10 μm. (B) RNA-seq tracks illustrating Bmi1Gfp cell-restricted genes, including the Serpina1 cluster and EE marker Chga. (C) Principal component analysis (PCA) of mRNA differences among crypt cells. Bmi1Gfp cells are distinct from others along PC1. Three ISC samples were derived from Lgr5Gfp and two from Lgr5Dtr mice. 2 SP samples each were isolated after pharmacologic or genetic Notch inhibition. SP: Sec-Pro, EP: Ent-Pro. (D) Cell trajectory models based on global mRNA levels impute Bmi1Gfp cells as descendants of Sec-Pro. Scores reflect monotonic expression changes for each trajectory. (E) Flow cytometry plots showing lack of Bmi1Gfp cells in Atoh1−/− crypts. (F) Gene Set Enrichment Analysis (GSEA) of the 500 highest expressed genes in Bmi1Gfp cells in relation to EE, Paneth, and goblet cell transcriptomes. (G) Co-expression of GFP and CHGA in Bmi1Gfp duodenal cells (N=165 cells). Representative individual and merged fluorescence images are displayed. Scale bar, 20 μm. See also Figures S1 and S2.
Figure 2
Figure 2. CD69 and CD274 mark a crypt Sec population of goblet cell precursors
(A) Wild-type CD69+CD274+ cell fractions detected by flow cytometry with both Ab (N=5) and by immunofluorescence (IF), which showed co-expression in cells lying just above the crypt base. Scale bar, 10 μm. (B) Elimination of Lgr5+ ISC in Lgr5Dtr-Gfp mouse intestines by Diphtheria toxin (DT) did not remove CD69+CD274+ cells (N=4), and IF in untreated Lgr5Dtr-Gfp mice shows their location just above the Lgr5+ ISC zone. (C) Representative IF of serial tissue sections showing non-overlapping signals from CD69+CD274+ cells and bromodeoxyuridine (BrdU)+ cells. Scale bar, 10 μm. (D) Absence of CD69+CD274+ cells by flow cytometry in Atoh1−/− intestines (N=3), and GSEA of the 500 highest expressed genes in wild-type mice reveals a closer match with Sec-Pro (SP) than with Ent-Pro (EP). (E) Relative mRNA levels of 8,953 genes differentially expressed (>3-fold, q <0.05) among secretory cell types in duplicate, grouped by unsupervised k-means clustering (k=6, as determined by the gap statistic). (F) RNA-seq tracks showing expression of goblet cell-specific Fcgbp. (G) Comparative cell trajectory modeling based on global RNA expression imputes CD69+CD274+ cells as goblet-cell precursors. See also Figure S3.
Figure 3
Figure 3. Modulation of gene expression in BmiGfp and CD69+CD274+ cells upon Lgr5+ ISC loss
(A) mRNA changes in BmiGfp cells before and after γ-irradiation. The 4,393 genes differentially expressed (>2-fold, q <0.05) in Lgr5+ and BmiGfp cells are arranged in descending order of baseline differences; RNA levels in post-irradiated BmiGfp cells are shown alongside. Representative RNA-seq tracks showing reduced levels of BmiGfp cell-specific Serpina1 transcripts. (B) qRT-PCR analysis showing that changes in gene expression triggered by ISC loss occur in BmiGfp and not all crypt cells. (C) mRNA changes in CD69+CD274+ cells (CD++) before and after ISC loss. The 4,432 genes differentially expressed (>2-fold, q <0.05) in Lgr5+ and CD++ cells are arranged in descending order of differences, and RNA levels in CD++ cells after Diphtheria toxin (DT) are shown in the middle. (D) PCA of mRNA modulation showing that, upon DT-induced ISC loss, CD++ cells cluster away from native CD++, and closer to ISC. (E) Representative RNA-seq data showing increase of ISC-specific (Cdca7) and reduction of goblet-specific (Aqp3) transcripts. (F) Heatmap representation of 12 stringently-defined ISC marker genes (Munoz et al., 2012). (G) qRT-PCR analysis showing selective gain of ISC maker genes in CD++ cells compared to bulk populations of crypt cells (N=3 each, error bars are standard deviations from biological triplicates). See also Figure S3.
Figure 4
Figure 4. Distinctive profile of chromatin access separates Sec cells, including BmiGfp and CD69+CD274+, from ISC and Ent cells
(A) ChIP- and RNA-seq data tracks showing similar locations and strength of active enhancer marks H3K4me2 and H3K27ac along loci specifically expressed in Sec- (SP, Dll1) and Ent-Pro (EP, Notch1). (B) ATAC signal tracks from duplicates of each crypt cell type at loci that illustrate differential chromatin access. (C) Matrix of Spearman correlation coefficients for global chromatin access derived from ATAC-seq data. Sec-Pro, Bmi1Gfp and CD++ cells cluster separately from ISC and Ent-Pro. (D) Heatmaps showing K-means-derived grouping of 41,167 regions (>1 kb from TSSs) of ATAC- identified open chromatin alongside active histone marks (Chip-seq) at the same sites. ChIP data on ISC were reported previously from sonicated chromatin (Kim et al., 2014); MNase-ChIP data on EP and SP are new to this study. (E) Average ATAC signals at Group 2 and Group 3 enhancers in ISC, Bmi1Gfp and CD++ cells. See also Figure S4.
Figure 5
Figure 5. Chromatin selectively open in the Sec lineage controls Sec-restricted genes
(A) The 14,835 sites in Group 3 show discernible H3K4me1, which is weaker than signals in Group 3, but present at similar levels in Ent- and Sec-Pro. (B) ATAC- and ChIP-seq data from each cell type at a representative locus, demonstrating co-localization of open chromatin and H3K4me1 in non-promoter regions within Group3. (C) Illustrative ATAC- and RNA-seq tracks showing Ets1 mRNA and open chromatin in a 3′ intron, both restricted to the Sec cell types SP, Bmi1Gfp and CD++. (D) Location of rare FEV+ and CD69+ cells in cells near crypt tier 4 (top – stained separately) and co-expression of both markers (bottom – stained simultaneously). Scale bar, 10 μm. (E) GSEA of genes located <25 kb from Group 3 enhancers shows robust association with transcripts highly enriched in Bmi1Gfp cells and Sec-Pro (SP), relative to Lgr5+ ISC. NES, normalized enrichment score. See also Figure S5.
Figure 6
Figure 6. Dynamic modulation of chromatin access in BmiGfp and CD++ cells upon loss of Lgr5+ ISC
(A, C) Similarity matrices (Spearman correlation coefficients) for global chromatin access (ATAC-seq) in BmiGfp cells (A) before and 24 h and 36 h after γ-irradiation, and in CD++ cells (C) 24 h after the last dose of Diphtheria toxin (DT), in relation to other crypt populations. Both post-radiation GFP+ cells and post-DT CD++ cells cluster with Lgr5+ ISC, away from their respective parental populations. (B, D) Widespread loss of ATAC signal at Group 3 sites, with commensurate relative gain at many Group 2 regions, in duplicate samples of BmiGfp cells after γ-irradiation (B) and post-DT CD++ cells (D). ATAC-seq tracks in each case illustrate losses and gains of open chromatin. (E) Relative strengths of ATAC signals averaged across all Group 2 and Group 3 enhancers upon ISC loss in BmiGfp and CD++ cells. Aggregate profiles from wild-type cells (Fig. 4E) are shown again for comparison. See also Figure S6.

References

    1. Anders S, Pyl PT, Huber W. HTSeq--a Python framework to work with high-throughput sequencing data. Bioinformatics. 2015;31:166–169. - PMC - PubMed
    1. Barker N. Adult intestinal stem cells: critical drivers of epithelial homeostasis and regeneration. Nat Rev Mol Cell Biol. 2014;15:19–33. - PubMed
    1. Barker N, van Es JH, Kuipers J, Kujala P, van den Born M, Cozijnsen M, Haegebarth A, Korving J, Begthel H, Peters PJ, et al. Identification of stem cells in small intestine and colon by marker gene Lgr5. Nature. 2007;449:1003–1007. - PubMed
    1. Buczacki SJ, Zecchini HI, Nicholson AM, Russell R, Vermeulen L, Kemp R, Winton DJ. Intestinal label-retaining cells are secretory precursors expressing Lgr5. Nature. 2013;495:65–69. - PubMed
    1. Buenrostro JD, Giresi PG, Zaba LC, Chang HY, Greenleaf WJ. Transposition of native chromatin for fast and sensitive epigenomic profiling of open chromatin, DNA-binding proteins and nucleosome position. Nat Methods. 2013;10:1213–1218. - PMC - PubMed

Publication types

Substances