. 2017 Jul 6;21(1):51-64.e6.
doi: 10.1016/j.stem.2017.05.020. Epub 2017 Jun 22.

Differentiation of Human Pluripotent Stem Cells into Colonic Organoids via Transient Activation of BMP Signaling

Affiliations

Differentiation of Human Pluripotent Stem Cells into Colonic Organoids via Transient Activation of BMP Signaling

Jorge O Múnera et al. Cell Stem Cell. .

Erratum in

Abstract

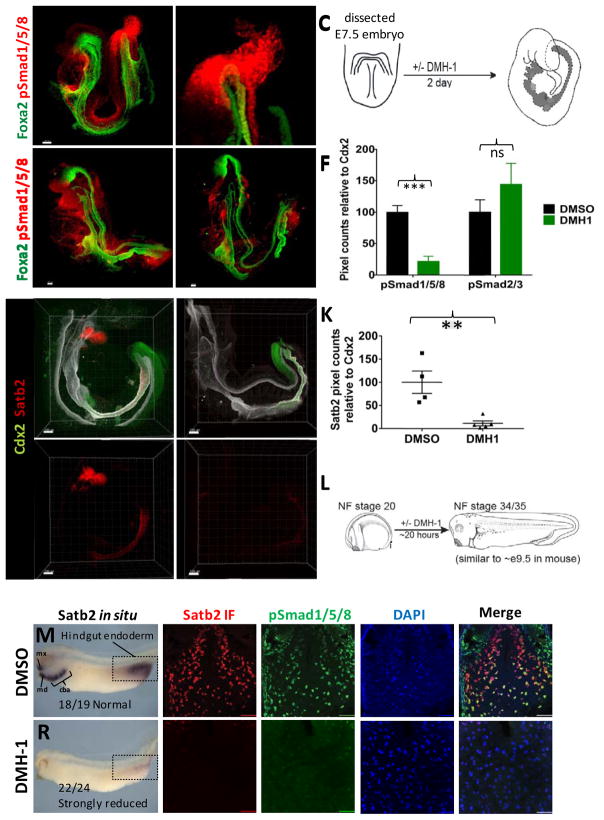
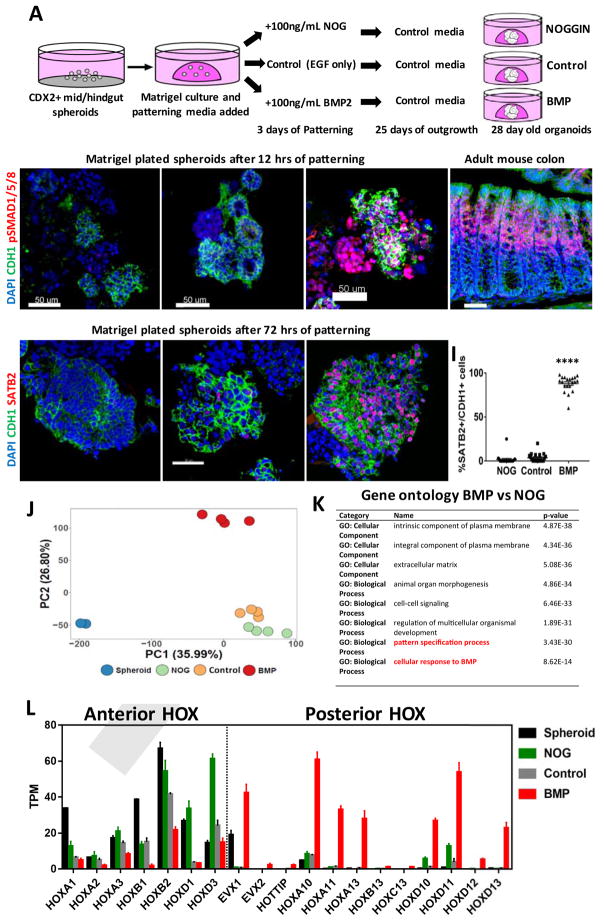
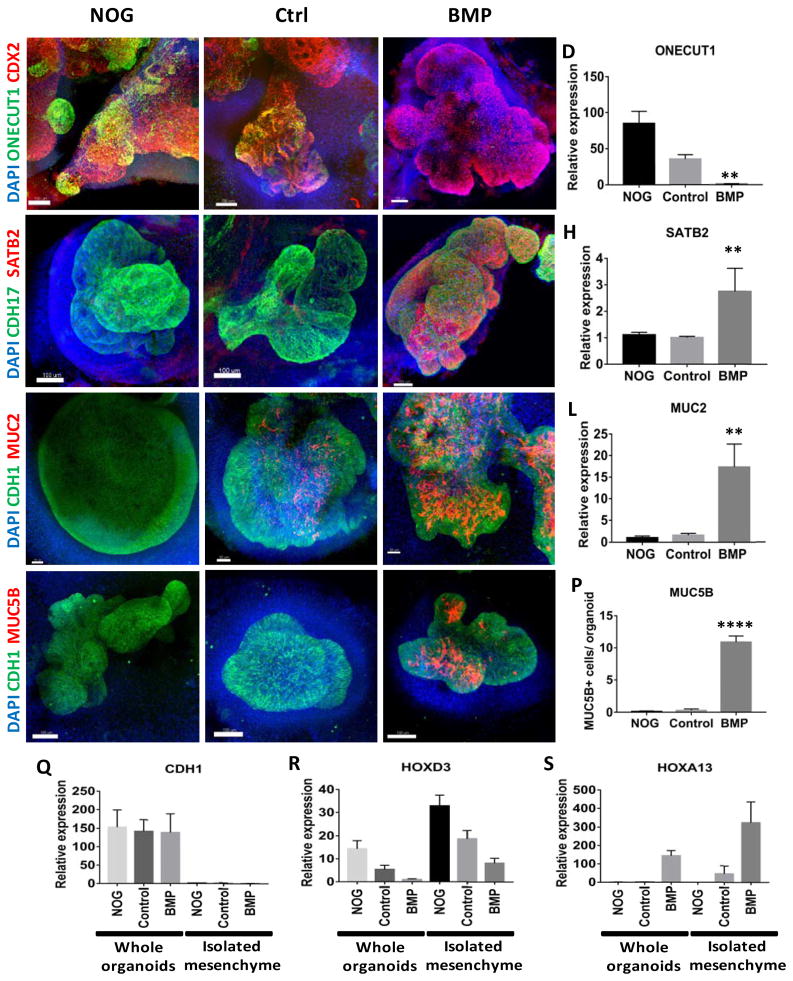
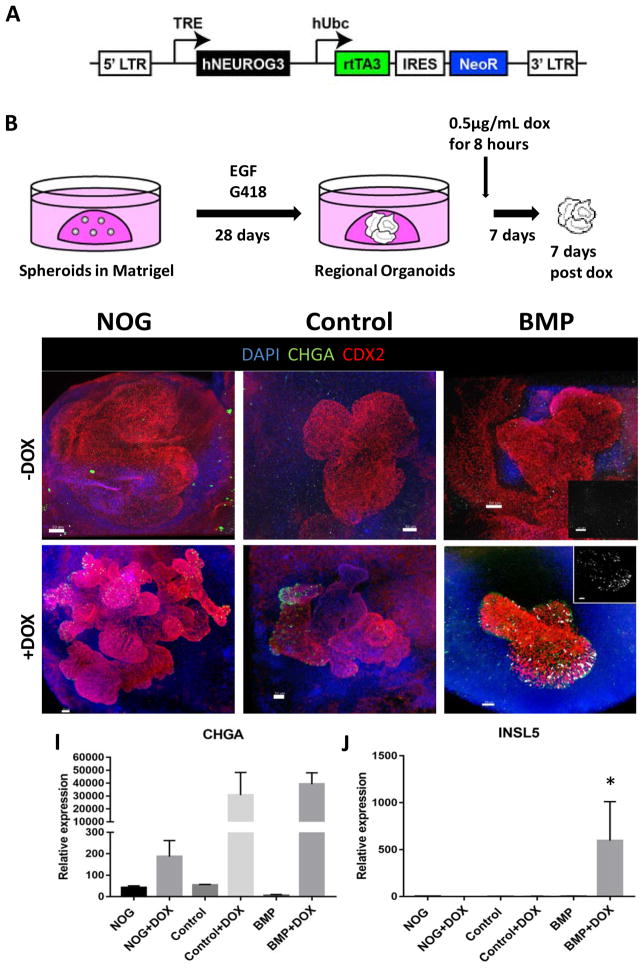
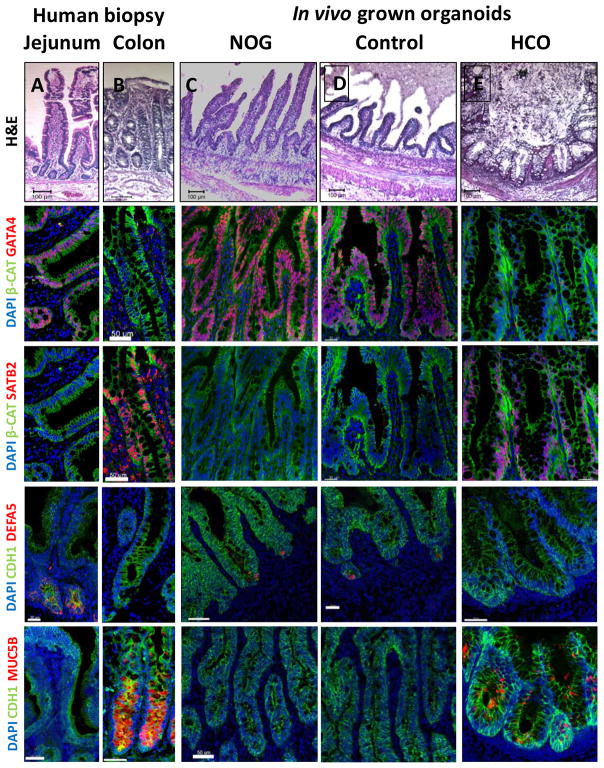
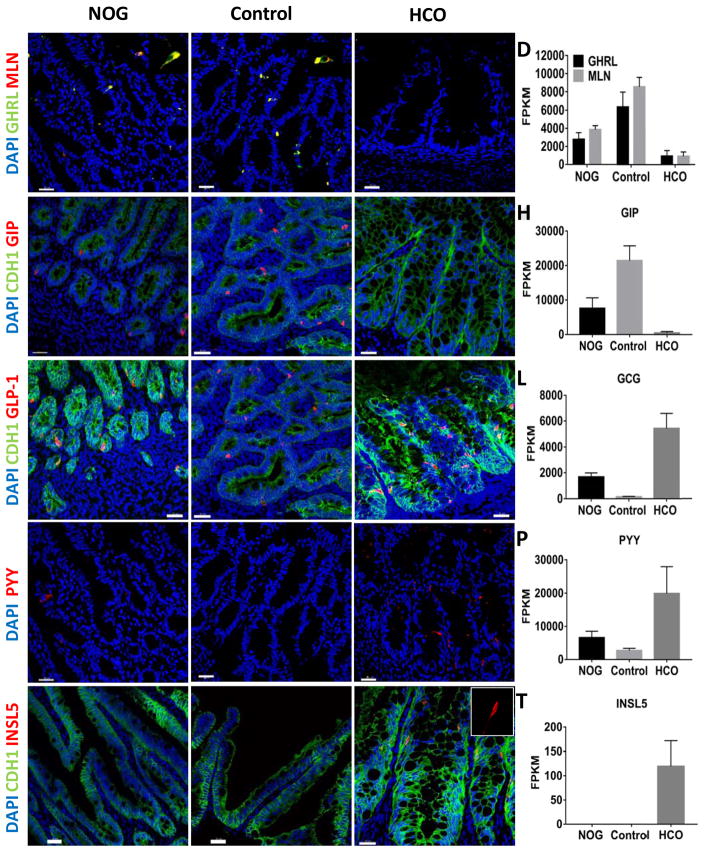
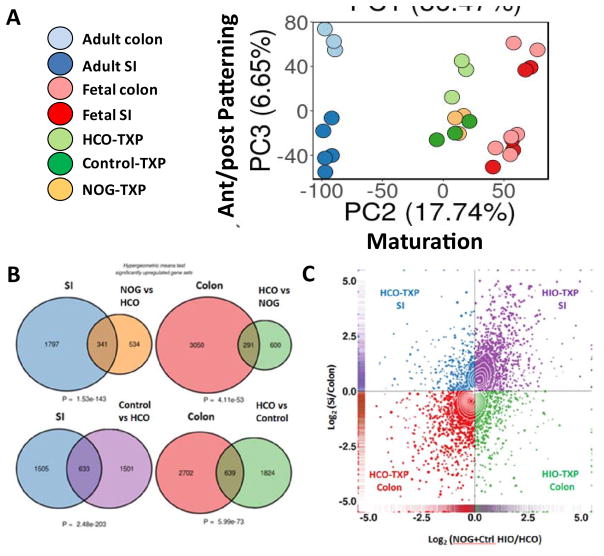
Gastric and small intestinal organoids differentiated from human pluripotent stem cells (hPSCs) have revolutionized the study of gastrointestinal development and disease. Distal gut tissues such as cecum and colon, however, have proved considerably more challenging to derive in vitro. Here we report the differentiation of human colonic organoids (HCOs) from hPSCs. We found that BMP signaling is required to establish a posterior SATB2+ domain in developing and postnatal intestinal epithelium. Brief activation of BMP signaling is sufficient to activate a posterior HOX code and direct hPSC-derived gut tube cultures into HCOs. In vitro, HCOs express colonic markers and contained colon-specific cell populations. Following transplantation into mice, HCOs undergo morphogenesis and maturation to form tissue that exhibits molecular, cellular, and morphologic properties of human colon. Together these data show BMP-dependent patterning of human hindgut into HCOs, which will be valuable for studying diseases including colitis and colon cancer.

Keywords: BMP signaling; Satb2; colonic organoids; hindgut; posterior HOX code.


Figures

Figure 1
Figure 1
Bmp signaling regulates Satb2 expression in mouse and frog embryos. (A) Whole-mount pSmad158 (red) and Foxa2 (green) staining of e8.5 mouse embryo showing nuclear staining around the developing hindgut (n=6). (B) Inset of optical slices from boxed region in (A) showing pSmad1/5/8 staining in the hindgut mesoderm and endoderm (D, dorsal; V, ventral). (C) Schematic of mouse embryo isolated at the headfold stage and cultured for 2 days +/− Bmp inhibition with DMH-1. (D,E) Whole-mount pSmad1/5/8 (red) and Foxa2 (green) staining of DMSO (D) and DMH-1 (E) treated embryos after 48 hours of culture. (F) Quantification of pSmad1/5/8 and pSmad2/3 staining in relative to Cdx2 in embryos cultured in DMSO or DMH-1 (n=3 embryos per condition). (G–J) Whole-mount immunostaining of Cdx2 (green), Satb2 (red) and Foxa2 (white) of mouse embryos (n=6 for each condition) following 2 days of culture in DMSO (G,H) or DMH-1 (I,J). Arrows in H–J point to the approximate location of the yolk stalk (BA1, first brachial arch). (K) Quantification of Satb2 expression in mouse embryos treated with DMSO or DMH-1. (L) Schematic of Bmp inhibition in Xenopus tropicalis embryos. In situ hybridization of Satb2 in Xenopus tropicalis embryos treated with DMSO (M) or DMH-1 (R). The white dotted line in (M) and (R) depict the plane of section used subsequent analysis. Mx and md= maxillary and mandibular processes of first brachial arch. Cba= Caudal brachial arches. Immunofluorescence of Satb2 (red), pSmad1/5/8 (green), DAPI (blue), and color merged images from Xenopus tropicalis embryos treated with DMSO (N–Q) or DMH-1 (S–V). Scale bars for = 100 μm in G–H and 50 μm in all other panels. **p ≤ 0.01 and ***p ≤ 0.001 for 2 tailed t-test.
Figure 2
Figure 2
BMP2 induces SATB2 and a posterior HOX code in human gut tube spheroids. (A) Schematic of gut tube spheroid patterning protocol. (B–D) BMP signaling levels as measured by pSMAD1/5/8 (red) staining of spheroids treated with NOGGIN (B), no treatment (C) and BMP2 (D) for 12 hours. (E) pSmad1/5/8 staining of adult mouse colon showing increased BMP signaling at to the top of crypts. (F–H) SATB2 expression in spheroids treated with NOGGIN (F), no treatment (G) and BMP2 (H) for 72 hours. (I) Quantification of the percentage of SATB2+ CDH1+ epithelium following patterning. (J) Principal component analysis of nascent spheroids and spheroids after 3 days of patterning. (K) Gene ontology analysis of differentially expressed genes between BMP vs NOG treated spheroids. (L) Graph of TPM (Transcripts per million) values of spheroids before and after patterning. Samples analyzed were spheroids before patterning (n=2), and NOGGIN, Control and BMP2 treated spheroids 3 days after patterning (n=4 for each group). For quantification in I, 20 organoids from at least 3 experiments were examined. Error bars represent SD. Scale bars = 50 μm. ****p ≤ 0.0001 determined by 2 tailed t-test comparing NOGGIN+Control treated spheroids and BMP2 treated spheroids.
Figure 3
Figure 3
Regional patterning is maintained in human intestinal organoids following prolonged in vitro culture. (A–D) Whole-mount immunofluorescence and QPCR analysis with the proximal marker ONECUT1 (green) of 28 day old organoids that resulted from the initial 3 day treatment of spheroids with NOGGIN, control, or BMP2. Staining with CDX2 (red) and DAPI (blue) were also used to detect the epithelium and mesenchyme. (E–H) Expression of the posterior marker SATB2 (red) detected by IF and by QPCR. (I–L) Analysis of the pan-goblet cell marker MUC2 (red) by IF and by QPCR. (M–P) Analysis of the colon-specific goblet cell marker MUC5B (red) by IF. The number of MUC5B+ cells was quantified in (P). (Q–S) Analysis of patterning markers in isolated mesenchyme cultures relative to whole organoids. QPCR analysis of CDH1 (Q), the proximal HOX gene HOXD3 (R), and the distal HOX gene HOXA13 (S) in whole organoids and in mesenchyme cultures derived from NOGGIN, control, or BMP2 treated organoids. CDH1 was only observed in whole organoids that contained epithelial cells. Error bars represent SEM. For IF minimum of 10 organoids from at least 3 different experiments were examined for each condition. For QPCR a minimum of 5 biological replicates from 2 separate experiments were examined. Scale bars = 100 μm. **p ≤ 0.01 and ****p ≤ 0.0001 determined by 2 tailed t-test comparing NOGGIN+Control treated organoids and BMP2 treated organoids.
Figure 4
Figure 4
HCOs but not HIOs gave rise to colon-specific enteroendocrine cells in response to expression of the proendocrine transcription factor NEUROGENIN 3. (A–B) Schematic of the doxycycline inducible NEUROG3 lentiviral construct used to generate the IPSC72.3 inducible NEUROG3 line, and the doxycycline induction protocol. Whole-mount staining with Chromagranin A (green), CDX2 (red) and INSL5 (white) of 35 day old organoids patterned with NOGGIN (C,F), Control (D,G) or BMP2 (E,H). (C–E) Untreated organoids (-Dox) and (F–H) organoids with expressed NEUROG3 (+Dox) are shown. Insets in E and H show a magnified view of INSL5 staining. (I, J) QPCR analysis of NEUROG3 induction of enteroendocrine cells in HIOs and HCOs as measured by CHGA (I) and for INSL5 (J) expression. For IF, a minimum of 10 organoids were examined per condition. For QPCR, data is representative of 2 different experiments with NOGGIN (n=3), Control (n=3) or BMP (n=6) treated organoids. Error bars represent SEM. Scale bars = 50 μm. *p ≤ 0.05 determined by 2 tailed t-test comparing NOGGIN+Control treated organoids and BMP2 treated organoids.
Figure 5
Figure 5
HIOs and HCOs maintained regional identity following transplantation in vivo. (A–E) H&E staining of biopsies from human jejunum and colon and of NOGGIN-derived HIOs, control HIOs, and BMP2-derived HCOs that were transplanted underneath the mouse kidney capsule and grown for 8–10 weeks in vivo. The samples of the same conditions were stained with the proximal intestinal marker GATA4 (F–J), the distal intestinal marker SATB2 (K–O), the Paneth cell marker DEFA5 (P–T), and the colon-specific goblet cell marker MUC5B (U–Y). Note that although GATA4 and SATB2 double staining was done in different channels but on the same slides for panels (F–O), they are shown as individual pseudocolored (red) images. For human biopsies n=2. For transplanted NOGGIN treated organoids n=12, for control organoids n=7, and for BMP2 treated organoids n=16. Scale bars= 50 μm.
Figure 6
Figure 6
In vivo grown organoids express region specific hormones. Analysis of expression of the regionally expressed hormones (A–D) Ghrelin (GHRL), Motilin (MLN), (E–H) GIP, (I–L) GLP-1, (M–P) PYY and (Q–T) INSL5 in HIOs and HCOs grown for 8–10 weeks underneath the mouse kidney capsule. The proximally enriched hormones GHRL, GIP and MLN were enriched in NOGGIN and control HIOs (A–H). The distally enriched hormones GLP-1 and PYY were enriched in BMP2-derived HCOs (I–O). The colon specific hormone INSL5 was only present in HCOs (Q–T). Data is representative of at least 5 transplanted organoids per condition. Insets in (A) and (B) show GHRL and MLN double positive cells. (D, H, L, P, T) FPKM values for GHRL, MLN, GIP, GLP1, PYY, and INSL5 are from RNA-seq data. FPKM values represent 3 biological replicates per condition. Scale bars= 30 μm.
Figure 7
Figure 7
Global transcriptional analysis of HIOs and HCOs and comparison with human small intestine and colon. (A) Principal component analysis human adult and fetal small intestine and colon compared with transplanted HIOs and HCOs. (B) Hypergeometric means test comparing human adult small intestine with HIOs and human adult colon with HCOs. (C) 4-way scatter plot comparing transcripts that were differentially expressed in human small intestine and colon compared to HIOs and HCOs.

Comment in

References

    1. Aronson BE, Aronson SR, Berkhout RP, Chavoushi SF, He A, Pu WT, Verzi MP, Krasinski SD. GATA4 represses an ileal program of gene expression in the proximal small intestine by inhibiting the acetylation of histone H3, lysine 27. Bba-Gene Regul Mech. 2014;1839:1273–1282. - PMC - PubMed
    1. Battle MA, Bondow BJ, Iverson MA, Adams SJ, Jandacek RJ, Tso P, Duncan SA. GATA4 is essential for jejunal function in mice. Gastroenterology. 2008;135:1676–1686. e1671. - PMC - PubMed
    1. Bernstein BE, Stamatoyannopoulos JA, Costello JF, Ren B, Milosavljevic A, Meissner A, Kellis M, Marra MA, Beaudet AL, Ecker JR, et al. The NIH Roadmap Epigenomics Mapping Consortium. Nat Biotechnol. 2010;28:1045–1048. - PMC - PubMed
    1. Beuling E, Bosse T, aan de Kerk DJ, Piaseckyj CM, Fujiwara Y, Katz SG, Orkin SH, Grand RJ, Krasinski SD. GATA4 mediates gene repression in the mature mouse small intestine through interactions with friend of GATA (FOG) cofactors. Dev Biol. 2008a;322:179–189. - PMC - PubMed
    1. Beuling E, Bosse T, Buckner MA, Krasinski SD. Co-localization of Gata4 and Hnf1 alpha in the gastrointestinal tract is restricted to the distal stomach and proximal small intestine. Gastroenterology. 2007a;132:A586–A586.

Publication types

Substances