. 2017 Oct:449:15-22.
doi: 10.1016/j.jim.2017.06.009. Epub 2017 Jun 22.

A novel and rapid method to quantify Treg mediated suppression of CD4 T cells

Affiliations

A novel and rapid method to quantify Treg mediated suppression of CD4 T cells

Anna E Long et al. J Immunol Methods. 2017 Oct.

Abstract

Measuring regulatory T cell suppression provides important insight into T cell dysfunction in autoimmune disease. However, to date, suppression assays are limited by the requirement for freshly isolated cells, and significant cell numbers. Here, we present a novel and rapid in vitro assay using effector T cell surface expression of both CD25 and CD134 as a surrogate marker of regulatory T cell-mediated suppression. This surface marker-based suppression assay works for frozen samples and for samples with limited cell numbers. It is also shorter taking two days to complete compared to the four days required for proliferation-based assays. Furthermore, this assay works with both in vitro expanded and natural Tregs, as well as anti-CD3/anti-CD28 bead-based and APC stimulation conditions. In conclusion, we have developed and validated a new suppression assay for cryopreserved samples with limited cell numbers that may be helpful to investigate T cell regulation in the context of infection or autoimmune diseases.

Keywords: CD134; CD25; Proliferation; Regulatory T cells; Suppression assay.


Figures

Figure 1
Figure 1. Suppression of CD25 Teff surface expression correlates with suppression of Teff proliferation
(a) Correlation of CD25 surface expression on Teff and CFSE-based Teff proliferation at day 4. (b) Correlation of percentage suppression of CD25+ Teff and percentage suppression of CFSE-based Teff proliferation at day 4. (c) Bland-Altman plot of percentage suppression of CD25 surface expression on Teff and percentage suppression of CFSE-based Teff proliferation at day 4. (d) For one representative individual, the dilution of CFSE through cell division and expression of CD25 on Teff are shown for day 2. (e) CD25 surface expression and CFSE-based proliferation on day 2 from Teff cultured with anti-CD3/anti-CD28 beads alone. (f) Correlation of percentage suppression of CFSE-based Teff proliferation at days 2 and 4. (g) Correlation of percentage suppression of CD25+ Teff at day 2 and percentage suppression of CFSE-based Teff proliferation at day 4. (h) Bland-Altman plot of percentage suppression of CD25+ Teff at day 2 and percentage suppression of CFSE-based Teff proliferation at day 4. For day 4 (a–c), 96 data points representing different Treg:Teff ratios for 14 healthy controls are shown (7 experiments with no replicated samples). From the same experiments on day 2 (e–h), 70 data points from 11 of 14 healthy controls due to low cell numbers from three participants. Spearman’s rank correlation coefficient: a (r=0.995, P<0.0001), b (r=0.996, P<0.0001), f (r=0.945, P<0.0001), and g (r=0.960, P<0.0001); dashed line shows y=x, solid circles show Teff+Treg, and open circles in a show Teff alone. Bland-Altman analysis was used to compare methods in c (bias=1.6%) and h (bias= 0.9%). The solid line shows average bias, dotted lines 95% CI for agreement. No statistical comparison was made for (e), median and interquartile range are shown.
Figure 2
Figure 2. Suppression of both CD54 and CD134 Teff surface expression also correlate with suppression of Teff proliferation
Correlation of percentage suppression of CD25+ Teff (a, day 1; e, day 2; i, day 4) and percentage suppression of CFSE-based Teff proliferation at day 4. Correlation of percentage suppression of CD25+CD54+ Teff (b, day 1; f, day 2; j, day 4) and percentage suppression of CFSE-based Teff proliferation at day 4. Correlation of percentage suppression of CD25+CD134+ Teff (c, day 1; g, day 2; k, day 4) and percentage suppression of CFSE-based Teff proliferation at day 4. The median frequency of CD25+CD134+ on day 2 in Teff cultured without Treg suppression was 25% (range 10–41%). Correlation of percentage suppression of CD25+CD54+CD134+ Teff (d, day 1; h, day 2; l, day 4) and percentage suppression of CFSE-based Teff proliferation at day 4. Spearman’s rank correlation coefficients: a (r=0.772; P<0.0001), b (r=0.866; P<0.0001), c (r=0.900; P<0.0001), d (r=0.953; P<0.0001), e (r=0.925; P<0.0001), f (r=0.915; P<0.0001), g (r=0.943; P<0.0001), h (r=0.955; P<0.0001), i (r=0.962; P<0.0001), j (r=0.961; P<0.0001), k (r=0.952; P<0.0001), and l (r=0.950; P<0.0001). Depending on the number of cells available ratios of 1:2–1:16 Treg:Teff were included for each sample and compared to Teff with anti-CD3/anti-CD28 beads for between 5 to 14 healthy controls from 3 experiments with no replicates. Not all combinations of markers were stained in all assays.
Figure 3
Figure 3. Surface marker-based suppression assay correlates with proliferation-based suppression assay when using nTregs or APC activation
(a) Correlation of percentage suppression of CD25+ Teff at day 4 and percentage suppression of CFSE-based Teff proliferation at day 4; solid circles = nTregs, and open circles = eTregs. (b) Correlation of percentage suppression of CD25+CD134+ Teff at day 2 and percentage suppression of CFSE-based Teff proliferation at day 4; solid circles = nTregs, and open circles = eTregs. The median frequency of CD25+CD134+ on day 2 in Teff cultured without Treg suppression was 20% (range 7–22%). (c) Correlation of percentage suppression of CD25+ Teff at day 2 and percentage suppression of CFSE-based Teff proliferation at day 4; solid circles = APC activation, and open circles = Bead activation. (d) Correlation of percentage suppression of CD25+CD134+ Teff at day 2 and percentage suppression of CFSE-based Teff proliferation at day 4; solid circles = APC activation, and open circles = Bead activation. Spearman’s rank correlation coefficients: a (nTregs: r= 0.974, p<0.0001 eTregs: r=0.959, p<0.0001), b (nTregs: r= 0.646, p=0.0016 eTregs: r=0.939, p<0.0001), c (APC: r= 0.938, p<0.0001 Beads: r=0.983, p<0.0001), d (APC: r= 0.877, p<0.0001 Beads: r=0.963, p<0.001). nTregs were sorted from two subjects, eTregs were expanded from three subjects, and grouped for analysis, and Teff were from six subjects.
Figure 4
Figure 4. Comparison of surface marker-based suppression assay and CFSE-based suppression assay in the presence of Pam3CSK4
(a) Percentage suppression of CD25+CD134+ Teff at day 2 in the absence and presence of Pam3CSK4. The median frequency of CD25+CD134+ on day 2 in Teff cultured without Pam3CSK4 was 57% (range 30–82%). (b) Percentage suppression of CD25+ Teff at day 4 in the absence and presence of Pam3CSK4. (c) Percentage suppression of CFSE-based proliferation at day 4 in the absence and presence of Pam3CSK4. Wilcoxon test of paired data: (a) *P=0.011, (b) ***P=0.001, and (c) **P=0.002. Data from 13 healthy controls are shown with cells at Tregs:Teff ratios of 1:4.
Figure 5
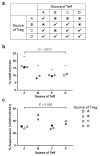
Figure 5. Measurement of suppression of CD25+CD134+ expression on day 2 using 5,000 Teff per well
(a) Outline of the source of Tregs and Teff from four donors (A, B, C and D). Cells were combined in four autologous and six allogenic pairings depending on number of cells recovered from sorting. (b) Percentage CD25+CD134+ Teff at a 1:4 ratio of Tregs:Teff. Horizontal line indicates the maximum proliferation for Teff incubated with anti-CD3/anti-CD28 beads without Tregs (not included in Kruskal-Wallis Test). (c) Percentage CD25+CD134+ suppression calculated from the data in Figure B. The median frequency of CD25+CD134+ on day 2 in Teff cultured without Treg suppression was 17% (range 14–23%). For b and c, the x-axis indicates the source of the Teff for the assay. The shape of the symbol indicates the source of Treg: subject A = square, subject B = triangle, subject C = circle, subject D = diamond. Filled symbols indicate cells from the same subject. Kruskal-Wallis Test: (b) P=0.013, and (c) P=0.029.

Similar articles

Cited by

References

    1. Bacchetta R, Passerini L, Gambineri E, Dai M, Allan SE, Perroni L, Dagna-Bricarelli F, Sartirana C, Matthes-Martin S, Lawitschka A, Azzari C, Ziegler SF, Levings MK, Roncarolo MG. Defective regulatory and effector T cell functions in patients with FOXP3 mutations. J Clin Invest. 2006;116:1713–22. - PMC - PubMed
    1. Berglund D, Karlsson M, Biglarnia AR, Lorant T, Tufveson G, Korsgren O, Carlsson B. Obtaining regulatory T cells from uraemic patients awaiting kidney transplantation for use in clinical trials. Clin Exp Immunol. 2013;173:310–22. - PMC - PubMed
    1. Canavan JB, Afzali B, Scotta C, Fazekasova H, Edozie FC, Macdonald TT, Hernandez-Fuentes MP, Lombardi G, Lord GM. A rapid diagnostic test for human regulatory T-cell function to enable regulatory T-cell therapy. Blood. 2012;119:e57–66. - PMC - PubMed
    1. Chatzigeorgiou A, Lyberi M, Chatzilymperis G, Nezos A, Kamper E. CD40/CD40L signaling and its implication in health and disease. Biofactors. 2009;35:474–83. - PubMed
    1. Croft M, So T, Duan W, Soroosh P. The significance of OX40 and OX40L to T-cell biology and immune disease. Immunol Rev. 2009;229:173–91. - PMC - PubMed

Publication types

MeSH terms

LinkOut - more resources