. 2017 Jun 29;170(1):185-198.e16.
doi: 10.1016/j.cell.2017.05.034. Epub 2017 Jun 22.

Enterochromaffin Cells Are Gut Chemosensors that Couple to Sensory Neural Pathways

Affiliations

Enterochromaffin Cells Are Gut Chemosensors that Couple to Sensory Neural Pathways

Nicholas W Bellono et al. Cell. .

Abstract

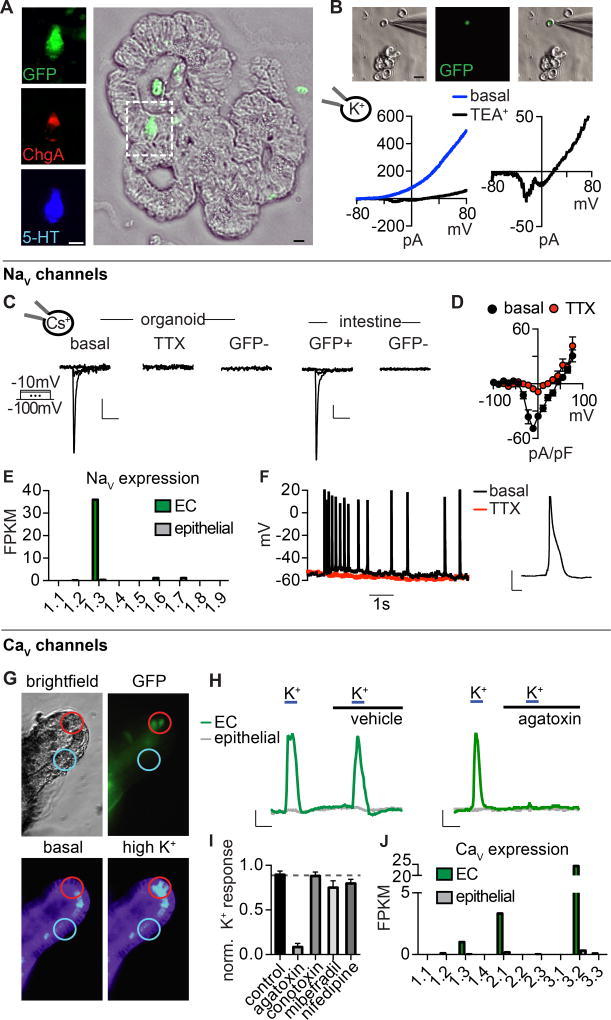
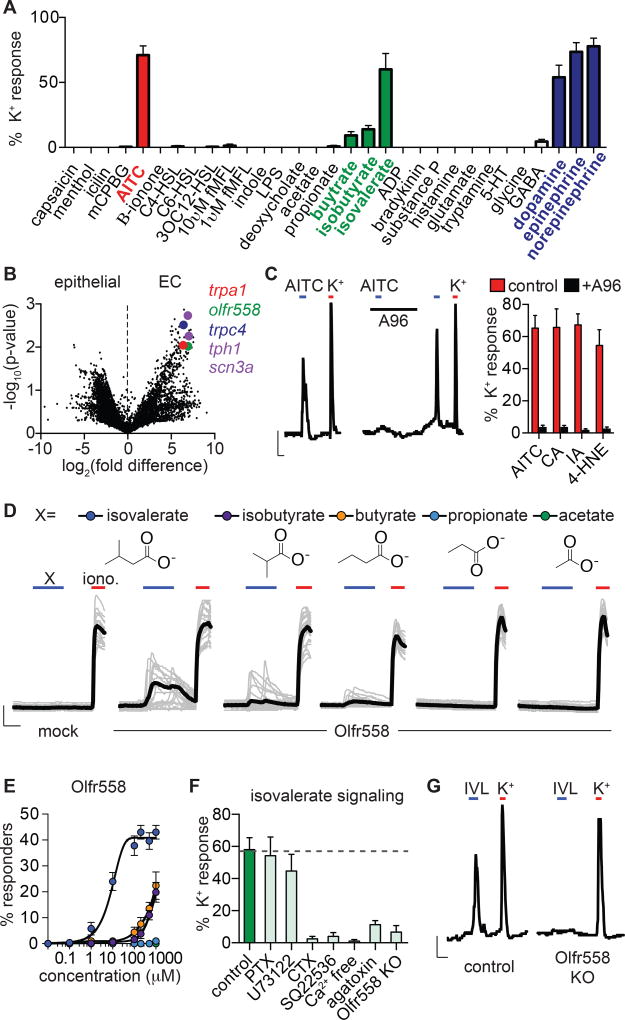
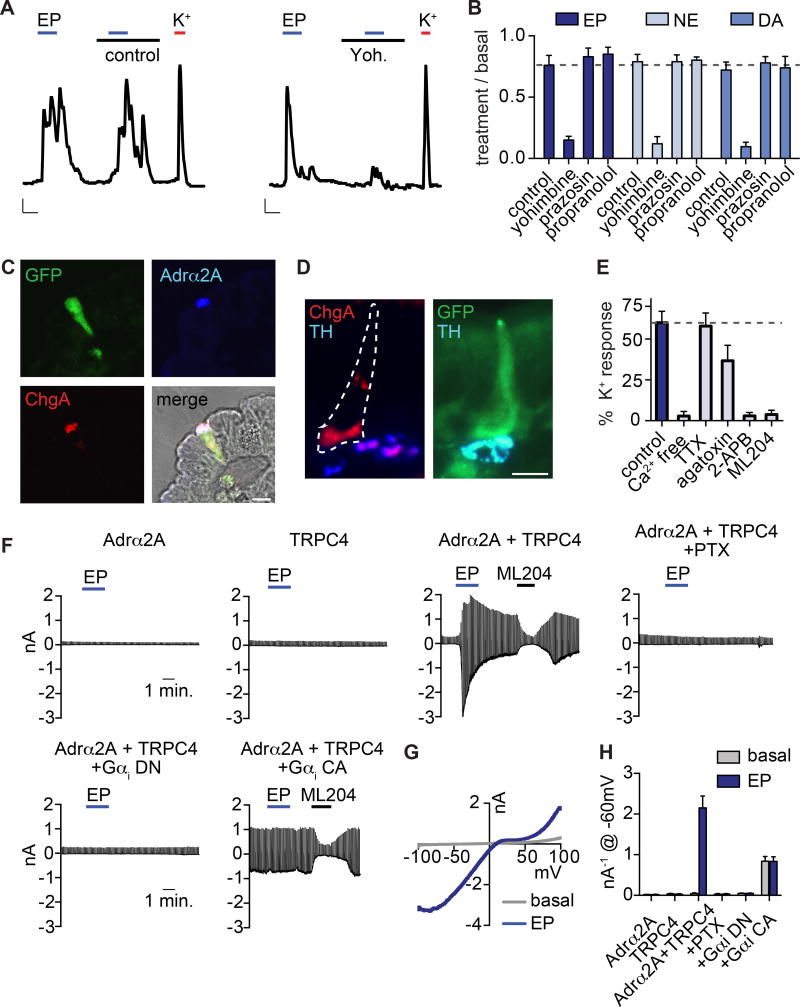
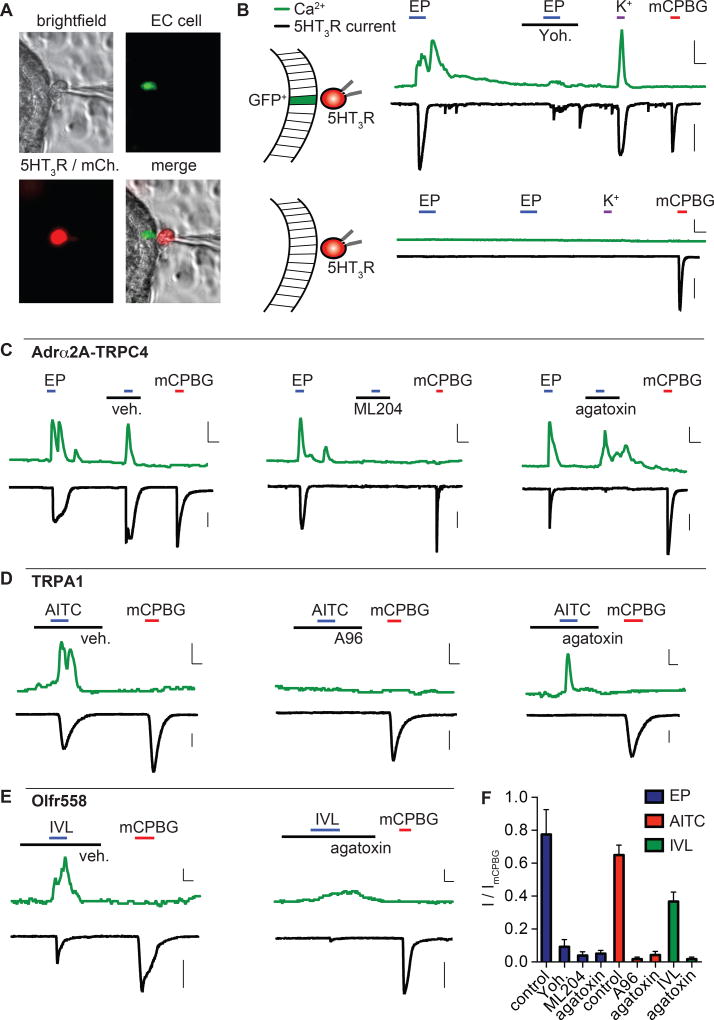
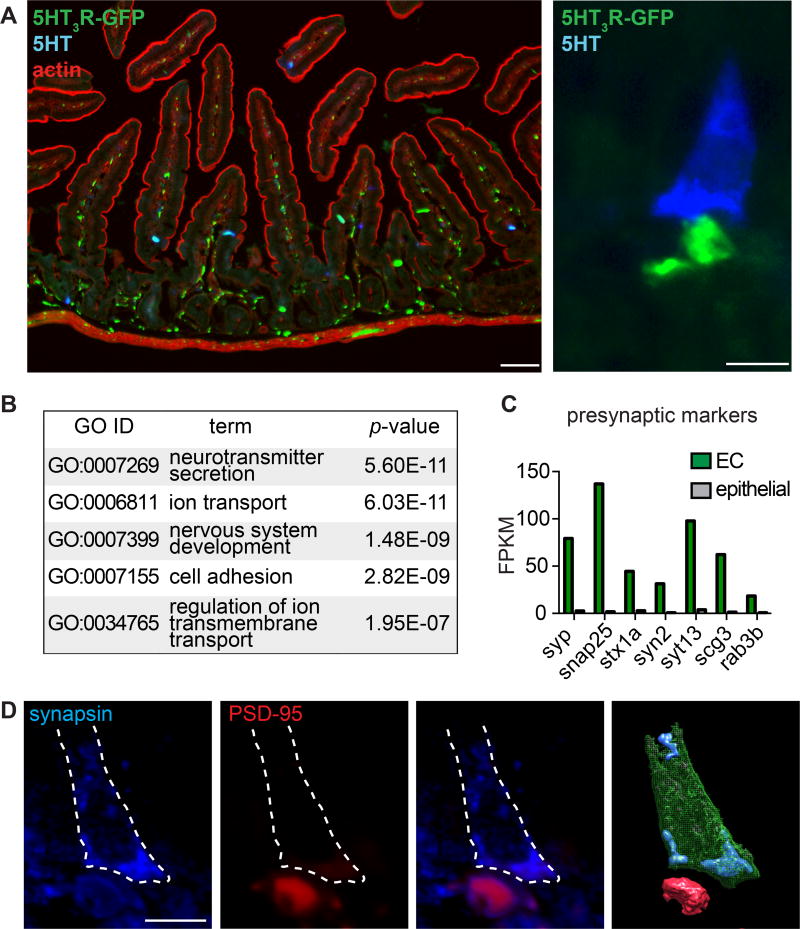
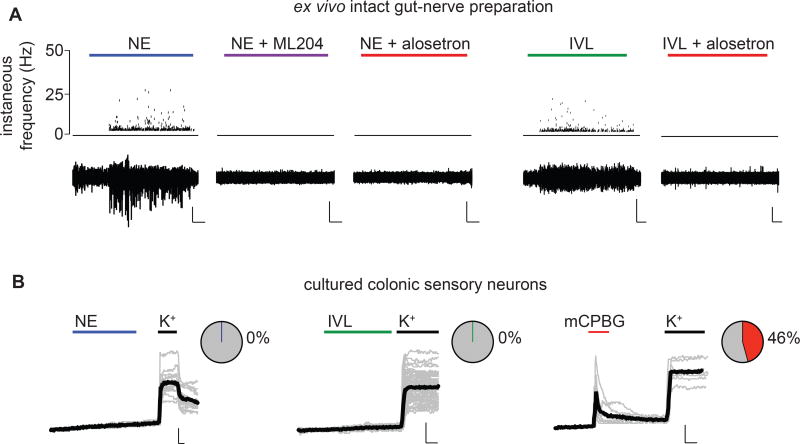
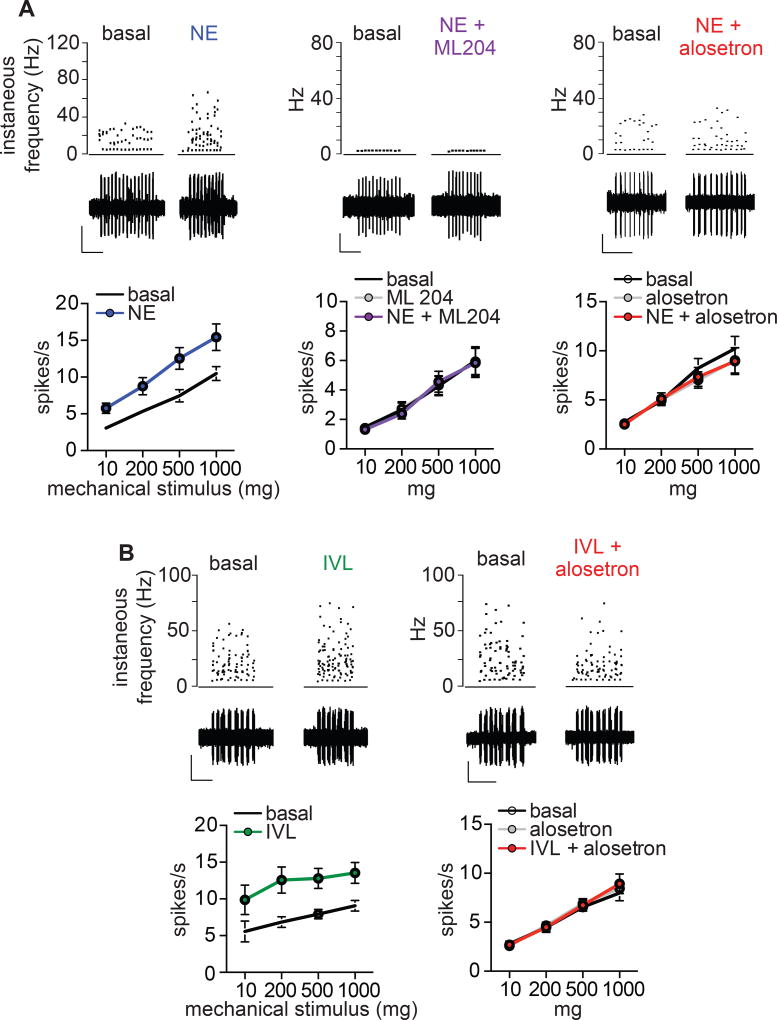
Dietary, microbial, and inflammatory factors modulate the gut-brain axis and influence physiological processes ranging from metabolism to cognition. The gut epithelium is a principal site for detecting such agents, but precisely how it communicates with neural elements is poorly understood. Serotonergic enterochromaffin (EC) cells are proposed to fulfill this role by acting as chemosensors, but understanding how these rare and unique cell types transduce chemosensory information to the nervous system has been hampered by their paucity and inaccessibility to single-cell measurements. Here, we circumvent this limitation by exploiting cultured intestinal organoids together with single-cell measurements to elucidate intrinsic biophysical, pharmacological, and genetic properties of EC cells. We show that EC cells express specific chemosensory receptors, are electrically excitable, and modulate serotonin-sensitive primary afferent nerve fibers via synaptic connections, enabling them to detect and transduce environmental, metabolic, and homeostatic information from the gut directly to the nervous system.

Keywords: chemosensation; enterochromaffin cell; gastrointestinal physiology; inflammatory bowel disease; intestinal organoid; microbial metabolites; neurogastroenterology; nociception; sensory transduction; visceral pain.


Conflict of interest statement

The authors declare no competing financial interests.

Figures

Figure 1
Figure 1. Enterochromaffin cells are electrically excitable
A. Co-localization of chromogranin A-driven GFP reporter (ChgA-GFP, green), ChgA (red), and serotonin (5-HT, blue) labels enterochromaffin (EC) cells in intestinal organoids. Scale bar: 10µm. B. Dissociated EC cell (green) in a representative patch-clamp experiment. Scale bar: 10µm. In response to a voltage ramp, the representative K+ current was blocked by 10 mM TEA+ to reveal a voltage-activated inward current. Representative of n=4 cells. C. Voltage-gated currents in EC cells were inhibited by the NaV antagonist tetrodotoxin (TTX, 500nM). Scale bars: 50pA vertical, 10ms horizontal. D. Average current-voltage relationship. n=7. p<0.0001 for basal versus TTX. Two-way ANOVA with post-hoc Bonferroni test. E. mRNA expression profile of NaV pore-forming subunits in EC cells (green) compared with other intestinal epithelial cells (grey). Bars represent fragments per kilobase of exon per million fragments mapped (FPKM). F. Spontaneous action potentials measured at resting membrane potential were inhibited by TTX. Representative of n=4. Inset: representative action potential, scale bar: 20mV, 10ms. G. Representative calcium (Ca2+) imaging experiment from EC cells (GFP, green) in an intestinal organoid. High extracellular K+ increased cytosolic Ca2+, indicated by a change in fluorescence ratio of Fura-2AM. H. Ca2+ responses to K+-elicited depolarization in EC (green) or neighboring cells (grey). The P/Q-type CaV inhibitor ω-agatoxin IVA abolished responses. Scale bar: 0.25 Fura-2 ratio, 50s. I. Pharmacological profile of CaV-mediated responses. n=6 per condition. Data represented as mean ± sem. p<0.0001 for control versus 300nM ω-agatoxin IVA. One-way ANOVA with post-hoc Bonferroni test. All data represented as mean ± sem. J. mRNA expression profile of CaV pore-forming subunits in EC cells (green) compared with other intestinal epithelial cells (grey).
Figure 2
Figure 2. Enterochromaffin cells use TRPA1 as an irritant receptor and Olfr558 as a metabolite sensor
A. Sensory molecule screen for EC cell-specific Ca2+ responses. High K+ was added at the end of each experiment to induce maximal Ca2+ responses used for normalization. n=6–62 per condition. Data represented as mean ± sem. B. mRNA expression profile of EC cells compared with other intestinal epithelial cells shown as a volcano plot. Trpa1 (red), olfr558 (green), and trpc4 (blue) were among the most enriched transcripts that encode sensory receptors or channels. EC cell marker tph1 and NaV1.3 pore-forming subunit scn3a are shown for comparison (purple). C. AITC (150µM)-elicited Ca2+ responses were inhibited by the TRPA1 antagonist A967079 (A96, 10µM). Scale bar: 0.1 Fura-2 ratio, 50s. Average peak Ca2+ responses evoked by TRPA1 agonists AITC, cinnamaldehyde (CA, (150µM), iodoacetamide (IA, 150µM), or 4-hydroxynonenal (4-HNE, 200µM) were inhibited by A96 (10µM). n=5 per condition. p<0.0001 for agonists versus agonists + A96, two-way ANOVA with post-hoc Bonferroni test. D. Ca2+ responses elicited by metabolites (200µM) in HEK293 cells expressing Olfr558. Ionomycin (iono, 1µM) was added at the end of each experiment to induce maximal Ca2+ responses. Black traces represent an average of all cells in the field shown in grey. Scale bar: 0.2 Fura-2 ratio, 50s. E. Dose-response comparing isovalerate (blue), isobutyrate (purple), butyrate (orange), propionate (light blue), or acetate (green) represented as % of cells that responded to the indicated concentration of each compound. n=6 per condition. EC50 for isovalerate was 8.92µM with a 95% confidence interval of 7.32 to 10.51µM. F. Isovalerate-evoked Ca2+ responses in EC cells. n=5 per condition. p<0.001 for control (vehicle-treated or empty Cas9-containing vector-infected organoids) versus cholera toxin (CTX), adenylyl cyclase inhibitor SQ22536 (10µM), Ca2+ free extracellular solution, ω-agatoxin IVA (300nM), Olfr558 knockout (KO). All data represented as mean ± sem. n=5–8 per condition, one-way ANOVA with post-hoc Bonferroni test. G. Isovalerate (IVL, 200µM)-evoked responses were absent in Olfr558 knockout (KO) ChgA-GFP organoids generated using CRISPR. Scale bar: 0.1 Fura-2 ratio, 50s.
Figure 3
Figure 3. Adrα2A and TRPC4 form a catecholamine-sensitive signaling cascade in enterochromaffin cells
A. Epinephrine (EP, 1µM)-evoked Ca2+ responses were blocked by the adrenoreceptor α2 (Adrα2) antagonist yohimbine (yoh, 5µM). Scale bars: 0.1 Fura-2 ratio, 50s. B. Average peak catecholamine responses were inhibited by the Adrα2 antagonist yohimbine, but not the Adrα1 antagonist prazosin (5µM) or the Adrβ antagonist propranolol (5µM). n=5 per condition. p<0.0001 for control versus yohimbine for EP (1µM), norepinephrine (NE, 1µM), dopamine (DA, 100µM). Two-way ANOVA with post-hoc Bonferroni test. C. Adrα2A (blue) localized to the basolateral side of EC cells (indicated by ChgA in red or GFP reporter) and was specific among intestinal epithelial cells. Scale bar: 10µm. D. Tyrosine hydroxlase (TH, blue), a marker for norepinephrine-producing sympathetic nerve fibers, localized on the basolateral side of EC cells (indicated by ChgA in red or GFP reporter). Scale bar: 10µm. E. Pharmacological profile of EP responses. n=7 per condition. p<0.0001 for control versus Ca2+ free, TRPC inhibitor 2-APB (50µM), TRPC4 inhibitor ML204 (10µM); p<0.05 for control versus ω-agatoxin IVA (300nM). One-way ANOVA with post-hoc Bonferroni test. F. EP-elicited currents were elicited from HEK293 coexpressing Adrα2A and TRPC4, but not cells independently expressing Adrα2A or TRPC4. EP-elicited currents were inhibited by pertussis toxin (PTX, 200ng/ml) or coexpression of dominant-negative (DN) Gαi. Coexpression of constitutively-active (CA) Gαi induced ML204-sensitive activity that occluded EP-elicited currents. G. Representative current-voltage relationship shows the peak EP response (blue) and basal current (grey) from the representative cell expressing Adrα2A and TRPC4 shown in F. H. Average peak current amplitude recorded at −60mV before (basal, grey) or during EP (blue) application. n=6 per condition. All data represented as mean ± sem. p<0.0001 for basal versus epinephrine-evoked currents in Adrα2A and TRPC4, two-way ANOVA with post-hoc Bonferroni test.
Figure 4
Figure 4. Enterochromaffin cell activation mediates CaV-dependent 5-HT release
A. Representative 5-HT “biosensor” experiment. 5HT3R-expressing HEK293 (mCherry, red) adjacent to an EC cell (GFP, green) for simultaneous Ca2+ measurements from EC cells and whole-cell current measurements from biosensor cells. B. Epinephrine (EP, 1µM) or high extracellular K+ induced a Ca2+ response in EC cells that correlated with a large 5HT3R current in biosensor cells. EP responses were inhibited by yohimbine (yoh, 5µM). The 5HT3R agonist mCPBG (10µM) elicited a large biosensor current, but no EC cell Ca2+ response. When biosensor cells were moved away from EC cells, neither epinephrine nor K+ induced Ca2+ responses in GFP epithelial cells or biosensor currents, but mCPBG elicited a large 5HT3R current. Scale bars: 0.6 Fura-2 ratio, 50s, 500pA. C. EP-evoked Ca2+ responses and 5HT3R currents were not affected by vehicle but were blocked by the TRPC4 inhibitor ML204 (10µM). The CaV inhibitor ω-agatoxin IVA (300nM) slightly reduced Ca2+ responses and abolished 5HT3R currents. Scale bars: 0.3 Fura-2 ratio, 50s, 500pA. D. AITC (150µM)-evoked Ca2+ responses and 5HT3R currents were blocked by the TRPA1 antagonist A967079 (A96, 10µM). ω-agatoxin IVA (300nM) did not significantly affect Ca2+ responses, but abolished 5HT3R currents. Scale bars: 0.1 Fura-2 ratio, 25s, 500pA. E. Isovalerate (IVL, 200µM)-evoked Ca2+ responses and 5HT3R currents. ω-agatoxin IVA (300nM) inhibited Ca2+ responses and abolished 5HT3R currents. Scale bars: 0.1 Fura-2 ratio, 25s, 500pA. F. Average agonist-evoked biosensor currents normalized to mCPBG-induced current (ImCPBG). n=4 – 5 per condition. Data represented as mean ± sem. Responses to epinephrine (EP, blue), AITC (red), and isovalerate (IVL, green) in the presence of indicated antagonists. p<0.001 for control versus treatments. One-way ANOVA with post-hoc Tukey’s test.
Figure 5
Figure 5. Enterochromaffin cells form synaptic-like contacts with 5HT3R-expressing nerve fibers
A. (Left) Representative jejunal cryosection showing 5HT3R-expressing fibers (green) innervating intestinal villi near serotonin-expressing EC cells (5-HT, blue) with actin staining (red) to demonstrate intestinal architecture. Scale bar: 50 µm. (Right) Representative image demonstrating proximity between a 5-HT-positive EC cell (blue) and 5HT3R-expressing fiber (green, baslateral side). Scale bar: 10µm. B. Top 5 enriched Gene ontology (GO) categories in EC cells compared with other intestinal epithelial cells. C. Presynaptic marker mRNA expression profile in EC cells (green) versus other intestinal epithelial cells (grey). Bars represent fragments per kilobase of exon per million fragments mapped (FPKM). D. A 5 µm section of intestinal epithelium showing a representative EC cell that expressed the presynaptic marker synapsin (blue, basolateral side) and made contact with a postsynaptic marker-positive fiber (PSD-95, red). Cell body is outlined (dashed white line). Three-dimensional rendering of EC cell (green) with synapsin-positive vesicles (blue) near postsynaptic-like structure (red). Scale bar: 10µm.
Figure 6
Figure 6. Enterochromaffin cells modulate 5HT3R-expressing afferent nerves
A. Representative recordings from single mucosal afferent nerve fibers innervating intact colonic epithelium in an ex vivo preparation. Norepinephrine (NE, 1µM) applied to the epithelium elicited chemosensory responses that were blocked by the TRPC4 inhibitor ML204 (10µM) or the 5HT3R antagonist alosetron (10µM). Isovalerate (IVL, 200µM) also evoked alosetron-sensitive afferent activity. Scale bars: 500µV, 50s. Representative of n=8–9 per condition. p<0.0001 for number of action potentials measured in response to NE (321.5±55.4 spikes, 4/8 responsive fibers) versus NE+ML204 (0 spikes, 0/8 responsive fibers) or NE+alosetron (0 spikes, 0/9 responsive fibers), one-way ANOVA with post-hoc Bonferroni test. p < 0.01 for number of action potentials measured in response to IVL (648.7±339.3 spikes, 3/8 responsive fibers) versus IVL+alosetron (0 spikes, 0/8 responsive fibers). B. The 5HT3R agonist mCPBG (10µM), but not NE (1µM) or isovalerate (IVL, 200µM), evoked representative Ca2+ responses in retrogradely-labeled colonic sensory neurons isolated from lumbosacral dorsal root ganglia. All neurons quantified responded to high extracellular K+. Black traces represent an average of all cells in the field shown in grey. Scale bar: 0.1 Fura-2 ratio, 60s. Responsive neurons: n=0/16 for NE, n=0/62 for IVL, n=16/35 for mCPBG.
Figure 7
Figure 7. Enterochromaffin cells induce mechanical hypersensitivity of colonic afferents
A. Representative mechanical responses from single low-threshold mechanoreceptive mucosal afferent fibers elicited by a 10mg von Frey hair stimulus to epithelium. Mechanical responses were enhanced following epithelial treatment with norepinephrine (NE, 1µM) and hypersensitivity was blocked by the TRPC4 inhibitor ML204 (10µM) or 5HT3R antagonist alosetron (10µM). n=8–9 per condition. Scale bars: 400µV, 10s. p<0.0001 for contribution of treatment to series variance for NE versus basal and no significant difference with NE+ML204 or alosetron, two-way ANOVA with post-hoc Bonferroni test. B. Afferent mechanosensory responses were enhanced following epithelial treatment with isovalerate (IVL, 200µM) and hypersensitivity was blocked by alosetron (10µM). A 500mg von Frey hair was used as an epithelial mechanical stimulus for representative traces. n=8–9 per condition. Scale bars: 500µV, 10s. p<0.0001 for contribution of treatment to series variance for IVL versus basal and no significant difference with IVL+alosetron, two-way ANOVA with post-hoc Bonferroni test. All data represented as mean ± sem.

Comment in

References

    1. Aiken KD, Roth KA. Temporal differentiation and migration of substance P, serotonin, and secretin immunoreactive enteroendocrine cells in the mouse proximal small intestine. Dev Dyn. 1992;194:303–310. - PubMed
    1. Audouze K, Tromelin A, Le Bon AM, Belloir C, Petersen RK, Kristiansen K, Brunak S, Taboureau O. Identification of odorant-receptor interactions by global mapping of the human odorome. PloS One. 2014;9:e93037. - PMC - PubMed
    1. Bautista DM, Jordt SE, Nikai T, Tsuruda PR, Read AJ, Poblete J, Yamoah EN, Basbaum AI, Julius D. TRPA1 mediates the inflammatory actions of environmental irritants and proalgesic agents. Cell. 2006;124:1269–1282. - PubMed
    1. Bertrand PP, Hu X, Mach J, Bertrand RL. Serotonin (5-HT) release and uptake measured by real-time electrochemical techniques in the rat ileum. Am J Physiol-Gastr L. 2008;295:G1228–G1236. - PubMed
    1. Bohorquez DV, Shahid RA, Erdmann A, Kreger AM, Wang Y, Calakos N, Wang F, Liddle RA. Neuroepithelial circuit formed by innervation of sensory enteroendocrine cells. J Clin Invest. 2015;125:782–786. - PMC - PubMed

MeSH terms