. 2017 Jun 9:8:657.
doi: 10.3389/fimmu.2017.00657. eCollection 2017.

An Antigen-Presenting and Apoptosis-Inducing Polymer Microparticle Prolongs Alloskin Graft Survival by Selectively and Markedly Depleting Alloreactive CD8+ T Cells

Affiliations

An Antigen-Presenting and Apoptosis-Inducing Polymer Microparticle Prolongs Alloskin Graft Survival by Selectively and Markedly Depleting Alloreactive CD8+ T Cells

Wei Wang et al. Front Immunol. .

Abstract

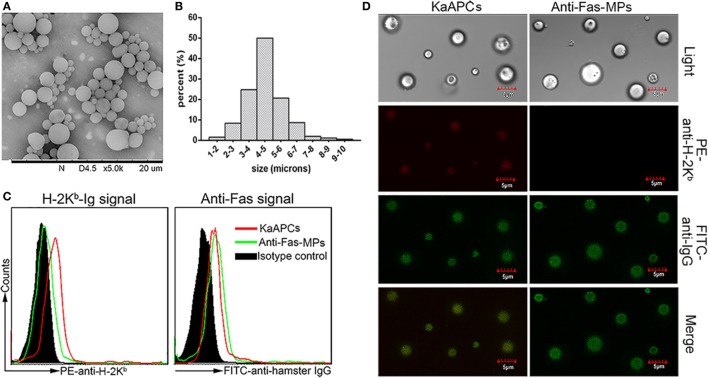
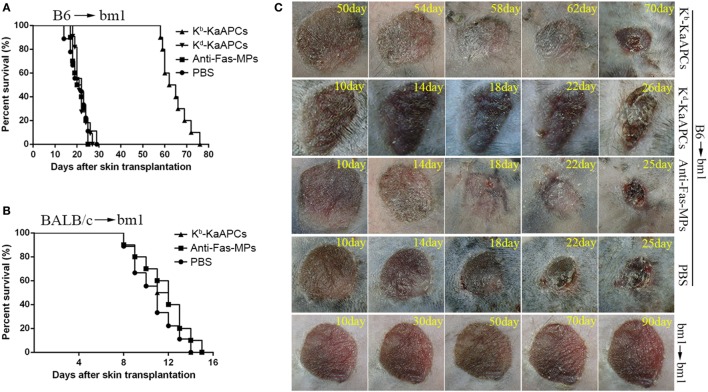
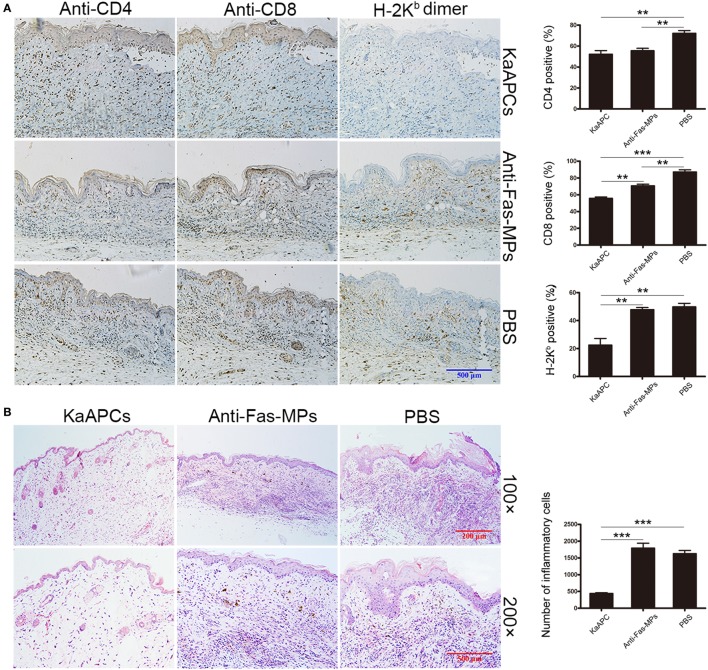
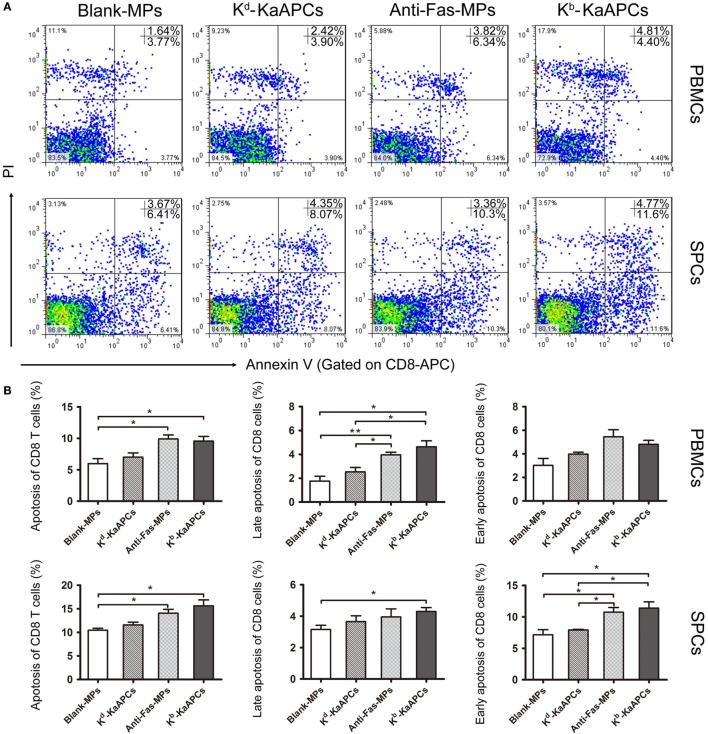
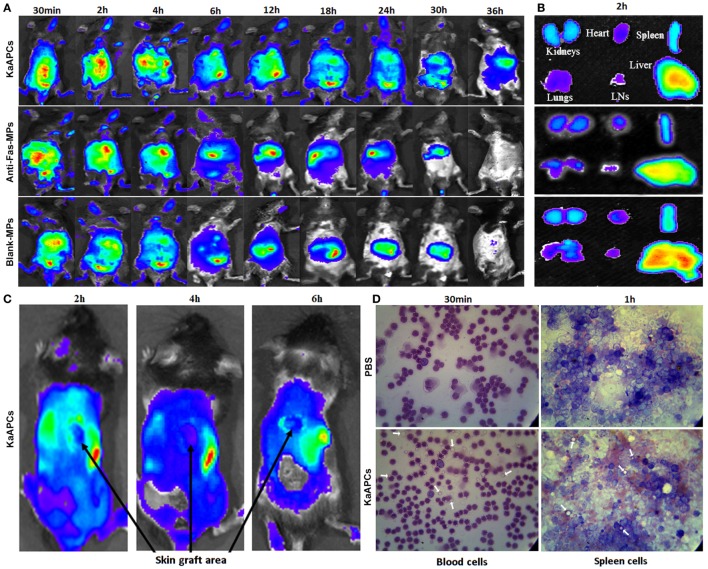
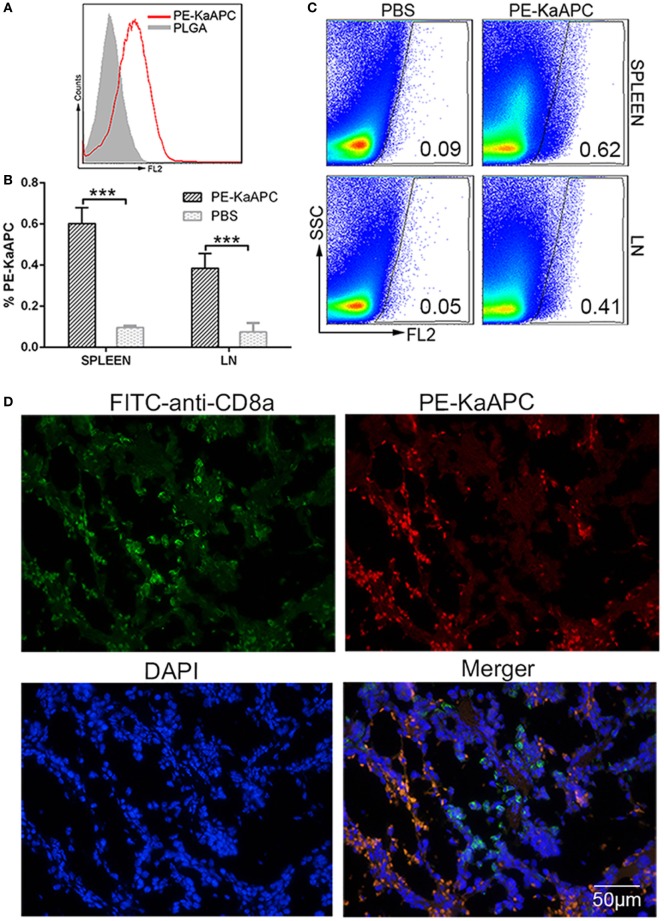
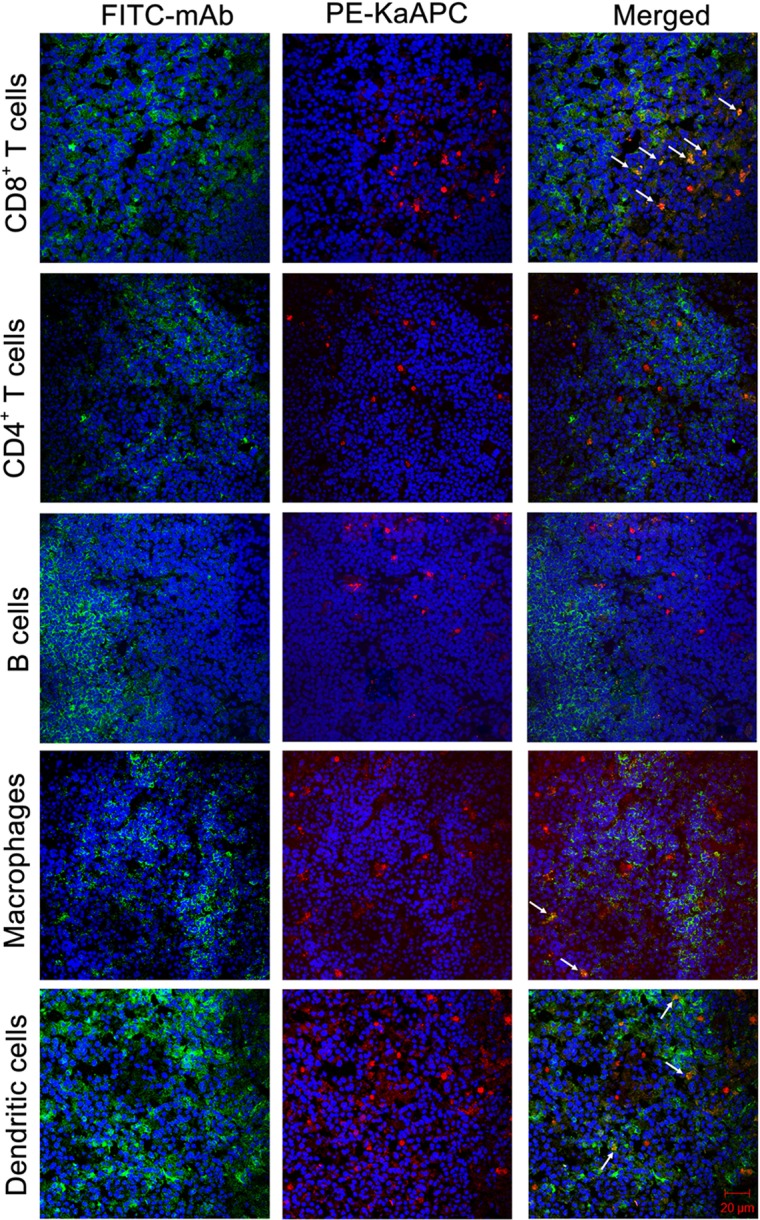
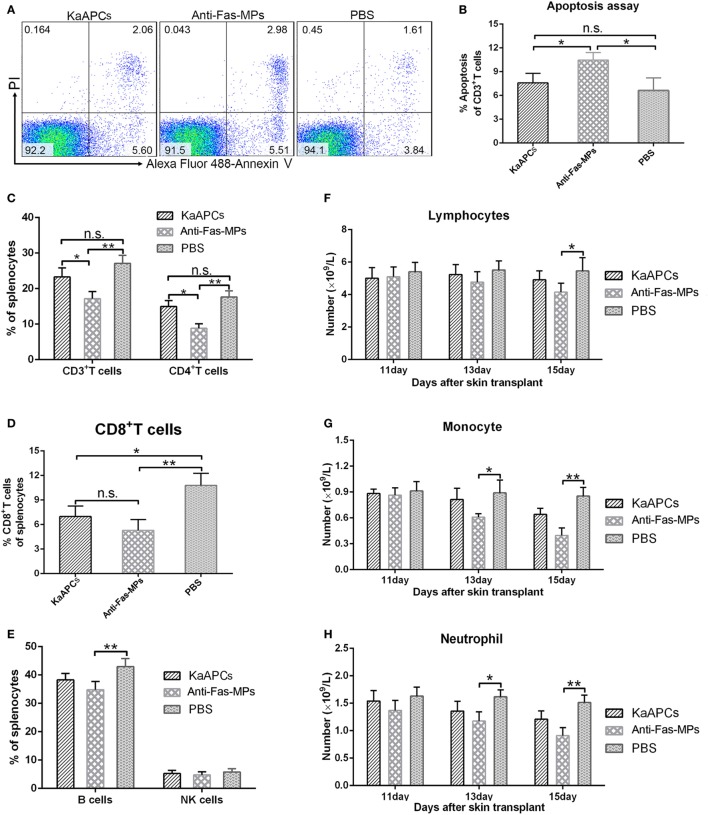
Selectively depleting the pathogenic T cells is a fundamental strategy for the treatment of allograft rejection and autoimmune disease since it retains the overall immune function of host. The concept of killer artificial antigen-presenting cells (KaAPCs) has been developed by co-coupling peptide-major histocompatibility complex (pMHC) multimer and anti-Fas monoclonal antibody (mAb) onto the polymeric microparticles (MPs) to induce the apoptosis of antigen-specific T cells. But little information is available about its in vivo therapeutic potential and mechanism. In this study, polyethylenimine (PEI)-coated poly lactic-co-glycolic acid microparticle (PLGA MP) was fabricated as a cell-sized scaffold to covalently co-couple H-2Kb-Ig dimer and anti-Fas mAb for the generation of alloantigen-presenting and apoptosis-inducing MPs. Intravenous infusions of the biodegradable KaAPCs prolonged the alloskin graft survival for 43 days in a single MHC-mismatched murine model, depleted the most of H-2Kb-alloreactive CD8+ T cells in peripheral blood, spleen, and alloskin graft in an antigen-specific manner and anti-Fas-dependent fashion. The cell-sized KaAPCs circulated throughout vasculature into liver, kidney, spleen, lymph nodes, lung, and heart, but few ones into local allograft at early stage, with a retention time up to 36 h in vivo. They colocalized with CD8+ T cells in secondary lymphoid organs while few ones contacted with CD4+ T cells, B cells, macrophage, and dendritic cells, or internalized by phagocytes. Importantly, the KaAPC treatment did not significantly impair the native T cell repertoire or non-pathogenic immune cells, did not obviously suppress the overall immune function of host, and did not lead to visible organ toxicity. Our results strongly document the high potential of PLGA MP-based KaAPCs as a novel antigen-specific immunotherapy for allograft rejection and autoimmune disorder. The in vivo mechanism of alloinhibition, tissue distribution, and biosafety were also initially characterized, which will facilitate its translational studies from bench to bedside.

Keywords: allograft rejection; alloreactive T cells; biomimetic microparticle; killer artificial antigen-presenting cell; peptide–major histocompatibility complex; poly lactic-co-glycolic acid.


Figures

Figure 1
Figure 1
Generation and characterization of poly lactic-co-glycolic acid microparticles (PLGA MPs) and killer artificial antigen-presenting cells (KaAPCs). (A) Representative scanning electron microscopy image of PLGA MPs. (B) Size distribution of PLGA MPs. After staining with R-phycoerythrin (PE)-anti-H-2Kb and fluorescein-5-isothiocyanate (FITC)-anti-hamster IgG (binds to anti-Fas) monoclonal antibodies, KaAPCs and anti-Fas-MPs were analyzed by flow cytometry (C) and confocal laser scanning microscope (D).
Figure 2
Figure 2
Killer artificial antigen-presenting cells (KaAPCs) prolong alloskin graft survival and reduce local allograft rejection. Ear dorsal tissues of C57BL/6J (B6) mice were grafted onto the dorsal of bm1 mice and followed by i.v. injection of Kb-KaAPCs, Kd-KaAPCs, anti-Fas-MPs (1 × 107 MPs/mouse/time point), or PBS on days 9, 11, and 13 posttransplantation. (A) Kaplan–Meier survival plots for alloskin grafts in the bm1 mice grafted with ear skin of B6 mice in each treatment group. Kb-KaAPCs mean the poly lactic-co-glycolic acid microparticles (PLGA MPs) co-displaying H-2Kb-Ig dimers and anti-Fas monoclonal antibodies (mAbs); Kd-KaAPCs mean the PLGA MPs co-displaying H-2Kd-Ig dimers and anti-Fas mAbs; anti-Fas-MPs mean the PLGA MPs displaying only anti-Fas mAbs. (B) Kaplan–Meier survival plots for alloskin grafts in the bm1 mice grafted with ear skin of BALB/c mice, a third-party alloskin transplant model followed by treatment as described on days 5, 7, and 9 days posttransplantation. (C) Representative pictures of alloskin grafts on the indicated days in the KaAPC group and control groups. The bm1 autograft transplantation was performed to assure a correct transplant procedure.
Figure 3
Figure 3
Killer artificial antigen-presenting cells (KaAPCs) reduce the local infiltration of alloreactive T cells and inflammatory cells in allograft. On day 20 posttransplantation (7 days after the final treatment), alloskin grafts were collected from recipients in each treatment group and embedded in paraffin. Allograft sections were prepared. (A) IHC analyses. Sections were incubated with H-2Kb-Ig dimer, anti-mouse CD4, anti-mouse CD8, or IgG2b/isotype control monoclonal antibodies (mAbs) and then stained with biotinylated secondary antibodies followed by visualization using an ABC kit. (B) Hematoxylin and eosin staining. The IHC images were presented at 200× magnifications. Representative sections were selected from three to five individual mice. KaAPCs mean the Kb-KaAPCs co-displaying H-2Kb-Ig dimers and anti-Fas mAbs. **p < 0.01, ***p < 0.001.
Figure 4
Figure 4
Killer artificial antigen-presenting cells (KaAPCs) deplete alloreactive T cells in vivo and inhibit the anti-donor alloreactivity of recipient T cells. Recipient bm1 mice were treated with KaAPCs, anti-Fas-MPs, or PBS on days 9, 11, and 13 after transplantation. Peripheral blood was collected on day 8 (1 day before treatment) and day 15 (2 days after treatment), and spleens were also collected on day 15. (A–C) H-2Kb-Ig dimers staining and flow cytometry. The representative dot plots were presented in panel (A) and were gated on CD8+ T cell population. Infusions of KaAPCs resulted in a marked reduction of H-2Kb-alloreactive CD8+ T cells in the CD8+ T cell populations from peripheral blood (B) and spleen (C). (D,E) Anti-donor mixed lymphocyte reaction assays. Splenocytes from the recipient bm1 mice in each treatment group were labeled with carboxyfluorescein succinimidyl ester (CFSE) and cocultured with mitomycin C-treated splenocytes, which derived from donor C57BL/6J mice, in 96-well microplates for 7 days. The proliferation percentage of recipient CD3+ T cells was determined according to cell divisions (D). KaAPCs treatment inhibited the anti-donor alloreactivity of recipient CD3+ T cells (E). n = 4–6 mice in each group. ***p < 0.001.
Figure 5
Figure 5
Killer artificial antigen-presenting cells (KaAPCs) induce apoptosis of CD8+ T cells in vivo. Grafted bm1 mice were injected via the tail vein with Kb-KaAPCs, Kd-KaAPCs, anti-Fas-MPs, or Blank-MPs on days 9, 11, and 13 after transplantation. Peripheral blood and spleen were collected on day 15 and processed into single cell suspensions followed by allophycocyanin-anti-mouse CD8a and Annexin V/propidium iodide (PI) staining for apoptosis analyses. (A) The representative dot plots for apoptosis of CD8+ T cells in peripheral blood mononuclear cells (PBMCs) and spleen cells (SPCs) of each group. (B) The frequencies of apoptotic CD8+ T cells in PBMCs and SPCs of each group. Data were displayed as the mean ± SD. n = 3–4 mice in each group. *p < 0.05, **p < 0.01.
Figure 6
Figure 6
In vivo tracking and tissue distribution of killer artificial antigen-presenting cells (KaAPCs). Grafted bm1 mice were injected via the tail vein with indocyanine green-encapsulated KaAPCs, anti-Fas-MPs, or Blank-MPs. Fluorescence images were then acquired using the Maestro in vivo imaging system at different time points. (A) Whole-body fluorescence images for in vivo tracking of KaAPCs and the control microparticles (MPs). (B) Distribution of KaAPCs and control MPs in the excised organs 2 h after injection as displayed by ex vivo imaging. (C) Few KaAPCs circulated into the location of alloskin graft at 2-, 4-, and 6-h time points, as analyzed by whole-body fluorescence imaging. (D) Wright’s staining for peripheral blood cells and spleen cells (SPCs). KaAPCs were observed in the blood cells suspension at 30-min time point and in the SPCs’ suspension at 1-h time point after i.v. injection in the KaAPCs group. Meanwhile, no KaAPC was found in the PBS injection group. White arrows point at the KaAPCs.
Figure 7
Figure 7
Killer artificial antigen-presenting cells (KaAPCs) circulate into secondary lymphoid organs and colocalize with CD8+ T cells. KaAPCs were coupled with R-phycoerythrin (PE)-labeled streptavidin and characterized by flow cytometry (A) and then injected i.v. into recipient bm1 mice on days 9, 11, and 13 after transplantation as described. At 12 h after the final injection, spleen and lymph nodes (LNs) were harvested from recipients. LNs and half of spleen were processed into single cell suspensions and freshly detected by flow cytometry without any staining. (B) A visible population of PE-KaAPCs was found in spleen and LNs, respectively. n = 3 mice in each group. Representative dot plots for flow cytometry analyses were presented in panel (C). Another half of spleen was embedded into O.C.T. followed by frozen section preparation and IHC staining with fluorescein-5-isothiocyanate (FITC)-labeled-anti-mouse CD8a and DAPI. Confocal photomicrographs of PE-KaAPCs and CD8+ T cells in spleen section were presented in panel (D), at 100× magnification. ***p < 0.001.
Figure 8
Figure 8
Confocol fluorescence imaging of killer artificial antigen-presenting cells (KaAPCs) with CD8+ T cells, CD4+ T cells, B cells, macrophages, and dendritic cells (DCs) in spleen section. R-Phycoerythrin (PE)-coupled KaAPCs were injected i.v. into the grafted bm1 mice on day 9, and spleens were collected 4 h later for the preparation of frozen sections. CD8+ T cells, CD4+ T cells, B cells, macrophage, and DCs were then stained by fluorescein-5-isothiocyanate (FITC)-labeled monoclonal antibodies (mAbs), respectively, and followed by confocol imaging in the marginal zone, red pulp, or white pulp of spleen section at 400× magnification. Many CD8+ T cells, macrophages, and DCs distributed in the marginal zones and red pulps, but most of B cells and CD4+ T cells could be observed in red pulps. Meanwhile, the PE-KaAPCs were mainly found in the marginal zones and red pulps.
Figure 9
Figure 9
Killer artificial antigen-presenting cells (KaAPCs) do not produce obvious bystander killing to immune cells. After treatment with KaAPCs, anti-Fas-MPs, or PBS on days 9, 11, and 13 after transplantation, spleens were harvested on day 15, and peripheral blood was collected on days 11, 13, and 15 from recipients. Apoptosis of T cells was analyzed by Annexin V/PI staining. A variety of immune cells were enumerated by flow cytometry or automated hematology analyzer. The representative dot plots for apoptosis of T cells from spleens in each treatment group were presented (A). KaAPCs treatment did not lead to obviously higher percentage of apoptosis in the T cell populations than the PBS treatment, but the percentage of apoptotic T cells in anti-Fas-MPs group was statistically higher than the KaAPCs group and PBS group (B). In spleen cell suspensions, the percentages of CD3+ and CD4+ T cell populations (C), CD8+ T cell populations (D), and B cell and NK cell populations (E) in each treatment group were presented. In peripheral blood, injections of KaAPCs did not obviously decrease the amounts of lymphocytes (F), monocytes (G), and neutrophils (H) 2 days after each injection. n = 4–6 mice in each group at each time point. *p < 0.05, **p < 0.01.

Similar articles

Cited by

References

    1. Li CJ, Li L. Tacrolimus in preventing transplant rejection in Chinese patients – optimizing use. Drug Des Devel Ther (2015) 9:473–85.10.2147/dddt.s41349 - DOI - PMC - PubMed
    1. Masson P, Henderson L, Chapman JR, Craig JC, Webster AC. Belatacept for kidney transplant recipients. Cochrane Database Syst Rev (2014) 11:Cd010699.10.1002/14651858.CD010699.pub2 - DOI - PMC - PubMed
    1. Provenzani A, Santeusanio A, Mathis E, Notarbartolo M, Labbozzetta M, Poma P, et al. Pharmacogenetic considerations for optimizing tacrolimus dosing in liver and kidney transplant patients. World J Gastroenterol (2013) 19(48):9156–73.10.3748/wjg.v19.i48.9156 - DOI - PMC - PubMed
    1. Kosiewicz MM, Krishnan A, Worthington MT, Matriano JA, Ross WG. B cells engineered to express Fas ligand suppress pre-sensitized antigen-specific T cell responses in vivo. Eur J Immunol (2002) 32(6):1679–87.10.1002/1521-4141(200206)32:6<1679::AID-IMMU1679>3.0.CO;2-5 - DOI - PubMed
    1. Schutz C, Hoves S, Halbritter D, Zhang HG, Mountz JD, Fleck M. Alloantigen specific deletion of primary human T cells by Fas ligand (CD95L)-transduced monocyte-derived killer-dendritic cells. Immunology (2011) 133(1):115–22.10.1111/j.1365-2567.2011.03417.x - DOI - PMC - PubMed