. 2017 Jan 31:3:3.
doi: 10.1038/s41540-017-0004-5. eCollection 2017.

Predicting growth of the healthy infant using a genome scale metabolic model

Affiliations

Predicting growth of the healthy infant using a genome scale metabolic model

Avlant Nilsson et al. NPJ Syst Biol Appl. .

Abstract

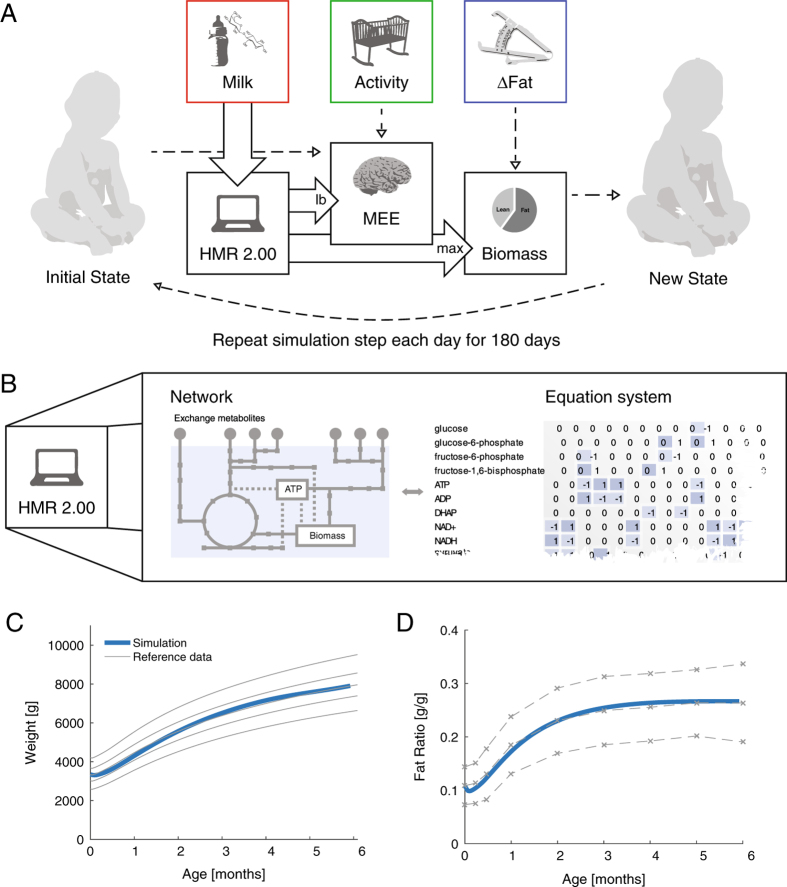
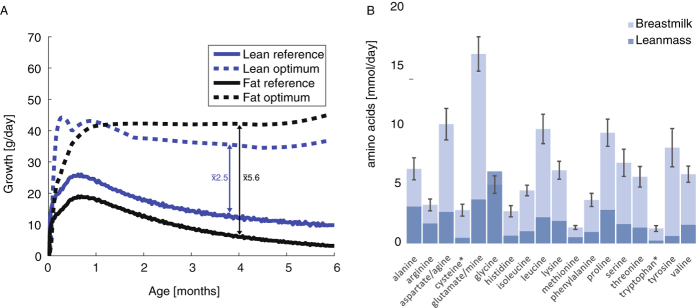
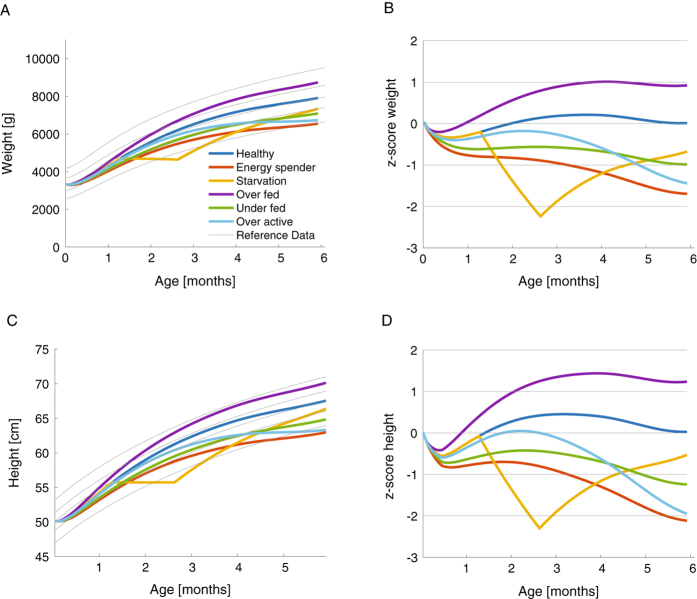
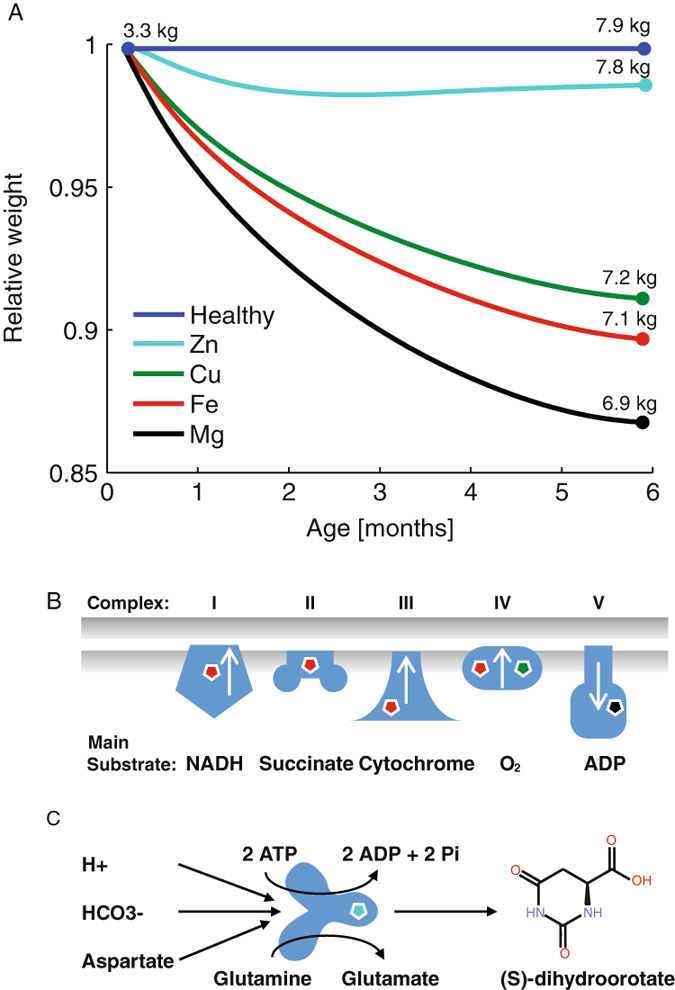
An estimated 165 million children globally have stunted growth, and extensive growth data are available. Genome scale metabolic models allow the simulation of molecular flux over each metabolic enzyme, and are well adapted to analyze biological systems. We used a human genome scale metabolic model to simulate the mechanisms of growth and integrate data about breast-milk intake and composition with the infant's biomass and energy expenditure of major organs. The model predicted daily metabolic fluxes from birth to age 6 months, and accurately reproduced standard growth curves and changes in body composition. The model corroborates the finding that essential amino and fatty acids do not limit growth, but that energy is the main growth limiting factor. Disruptions to the supply and demand of energy markedly affected the predicted growth, indicating that elevated energy expenditure may be detrimental. The model was used to simulate the metabolic effect of mineral deficiencies, and showed the greatest growth reduction for deficiencies in copper, iron, and magnesium ions which affect energy production through oxidative phosphorylation. The model and simulation method were integrated to a platform and shared with the research community. The growth model constitutes another step towards the complete representation of human metabolism, and may further help improve the understanding of the mechanisms underlying stunting.


Figures

Fig. 1
Fig. 1
Simulation of the metabolism of a growing infant from age 0 to 6 months. a The weight and fat mass of a healthy infant were chosen as the initial state of the simulation. Iterative simulations of the infant’s metabolism were performed, in which the current state was used as input to simulate the next state. The simulations were run in a human metabolic model (HMR 2.00) with the intake of metabolites from breast milk as uptake fluxes. The maintenance energy expenditure was calculated from the current body composition, with an additional term for physical activity, which was a function of both age and weight. The objective of the simulation was set to maximize growth, after expending the maintenance energy. Growth was defined as forming the biomass components (fat and lean mass), and the synthesizing energy required. The ratio of fat to total mass in the biomass composition was a function of age. b Simplified representation of the GEM (HMR 2.00) which contains 3800 Genes, 3000 unique metabolites and 8000 reactions out of which 1400 are cofactor dependent. c The weight increments from the simulation were expressed as a growth trajectory and compared with the 5th, 25th, 50th, 75th, and 95th percentile of WHO reference data. d The ratio of fat mass to total mass at each time step, compared with the mean and two standard deviations, from a previous study
Fig. 2
Fig. 2
Energy is the main growth limiting factor. a Simulations were run with the energy for maintenance and activity set to zero. The optimal growth of lean and fat mass at each time point was calculated in 2 independent simulations and compared to reference data, calculated from the weight increment and the interpolated distribution between fat and lean mass. The maximum possible growth was on average 2.5 and 5.6 times higher than the reference growth for lean and fat mass respectively. The smallest difference between maximum and reference growth occurred from birth to age 2 months. b At 1 month age, the uptake of all amino acids from milk was higher than the amount of stored amino acid, except for the nonessential amino acid glycine
Fig. 3
Fig. 3
Perturbations to the reference model. The Energy spender model was defined by a 30% increase in the maintenance expenditure for lean mass. The “Starved” model had decreased milk intake to 50% from age 40–80 days. The overfed and underfed models had +10% and −10% change in intake of breast milk. The over active model spent twice as much energy on physical activity. a Body weight. b z-scores of weight, the number of standard deviations from the mean. c Height. d z-scores of height
Fig. 4
Fig. 4
The metabolic effects of co factor deficiency was simulated by decreasing the fluxes through the reactions that depend on the cofactors to 95% optimal value. a The relative weight of infants with different cofactor deficiencies compared to healthy infants. b The strong decrease in growth for Fe, Cu, and Mg deficiency was caused by limitations in the energy generation, Fe and Cu are required for a functional electron transport chain and Mg is used by the ATP forming Complex V, i.e. ATP synthase. c The Zn deficiency affected the CAD protein (carbamoyl-phosphate synthetase 2, aspartate transcarbamoylase and dihydroorotase), limiting the synthesis of the nucleotide precursor (S)-dihydroorotic acid

References

    1. Prendergast AJ, Humphrey JH. The stunting syndrome in developing countries. Paediatr. Int. Child Health. 2014;34:250–265. doi: 10.1179/2046905514Y.0000000158. - DOI - PMC - PubMed
    1. Gluckman PD, Hanson Ma. Living with the past: evolution, development, and patterns of disease. Science. 2004;305:1733–1736. doi: 10.1126/science.1095292. - DOI - PubMed
    1. World Health Organization, WHO child growth standards length/height-for-age, weight-for-age, weight-for-length, weight-for-height and body mass index-for-age: methods and development. (World Health Organization, Geneva, 2006).
    1. Fjeld CR, Schoeller DA, Brown KH. A new model for predicting energy requirements of children during catch-up growth developed using doubly labeled water. Pediatr. Res. 1989;25:503–508. doi: 10.1203/00006450-198905000-00016. - DOI - PubMed
    1. Butte NF. Energy requirements of infants. Public Health Nutr. 2005;8:953–967. - PubMed

LinkOut - more resources