. 2017 Aug 1;127(8):2916-2929.
doi: 10.1172/JCI89717. Epub 2017 Jun 26.

ILC2-modulated T cell-to-MDSC balance is associated with bladder cancer recurrence

Affiliations

ILC2-modulated T cell-to-MDSC balance is associated with bladder cancer recurrence

Mathieu F Chevalier et al. J Clin Invest. .

Abstract

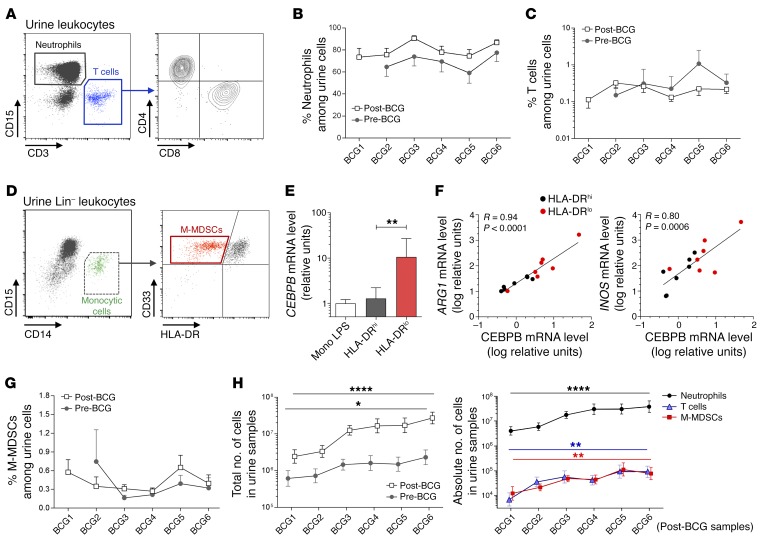
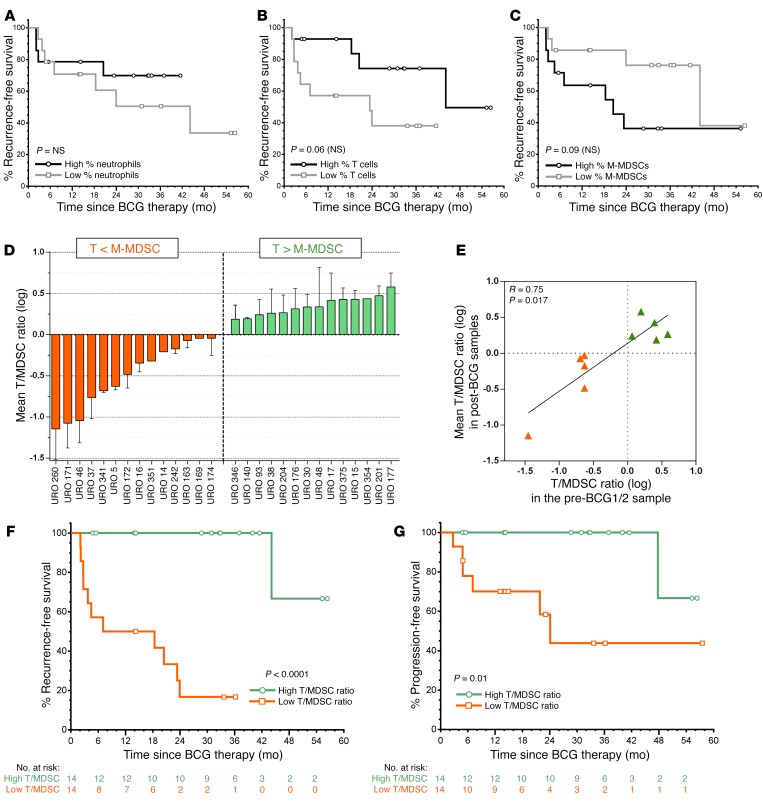
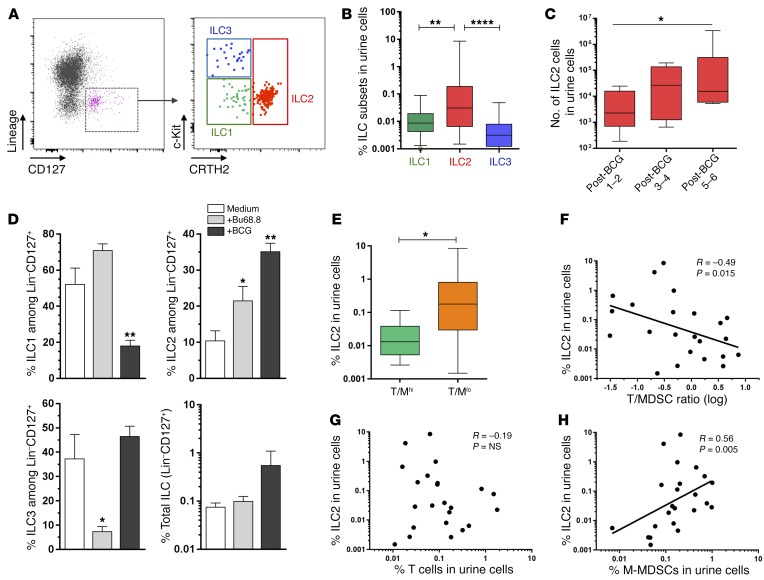
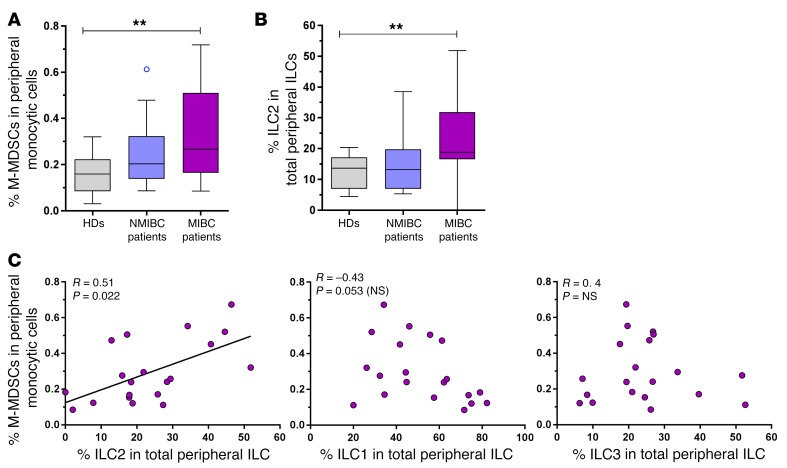
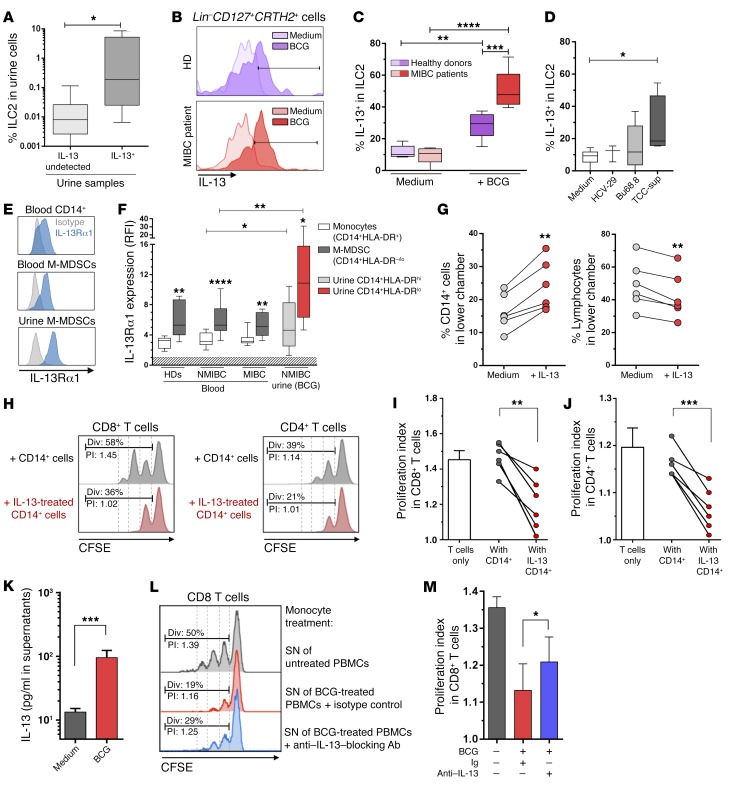
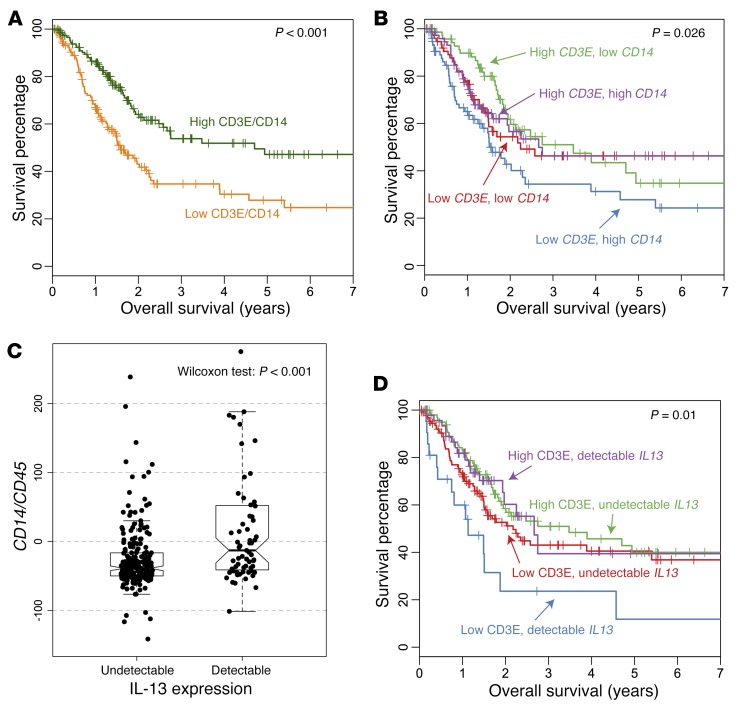
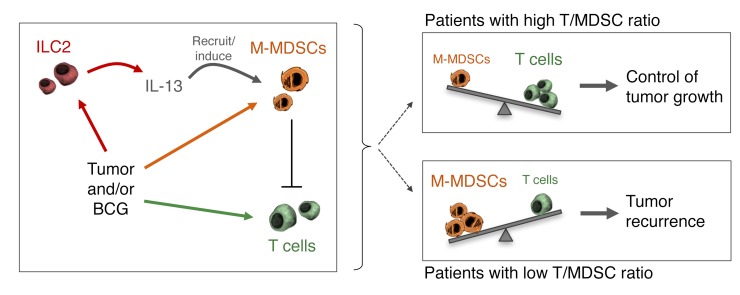
Non-muscle-invasive bladder cancer (NMIBC) is a highly recurrent tumor despite intravesical immunotherapy instillation with the bacillus Calmette-Guérin (BCG) vaccine. In a prospective longitudinal study, we took advantage of BCG instillations, which increase local immune infiltration, to characterize immune cell populations in the urine of patients with NMIBC as a surrogate for the bladder tumor microenvironment. We observed an infiltration of neutrophils, T cells, monocytic myeloid-derived suppressor cells (M-MDSCs), and group 2 innate lymphoid cells (ILC2). Notably, patients with a T cell-to-MDSC ratio of less than 1 showed dramatically lower recurrence-free survival than did patients with a ratio of greater than 1. Analysis of early and later time points indicated that this patient dichotomy existed prior to BCG treatment. ILC2 frequency was associated with detectable IL-13 in the urine and correlated with the level of recruited M-MDSCs, which highly expressed IL-13 receptor α1. In vitro, ILC2 were increased and potently expressed IL-13 in the presence of BCG or tumor cells. IL-13 induced the preferential recruitment and suppressive function of monocytes. Thus, the T cell-to-MDSC balance, associated with a skewing toward type 2 immunity, may predict bladder tumor recurrence and influence the mortality of patients with muscle-invasive cancer. Moreover, these results underline the ILC2/IL-13 axis as a targetable pathway to curtail the M-MDSC compartment and improve bladder cancer treatment.


Conflict of interest statement

Conflict of interest: The authors have declared that no conflict of interest exists.

Figures

Figure 1
Figure 1. Identification of immune cells infiltrating the urine during BCG therapy.
Flow cytometric analysis of urine-infiltrating cells in urine samples obtained from 28 patients with NMIBC during the 6-week intravesical BCG therapy. Urine samples were obtained before and 4 hours after each BCG instillation. Pre-BCG1 data are not shown due to low urine cell content, which is typical at that time point and does not allow for measurement of immune cell subsets in most patients. (A) Samples were gated on live leukocytes and neutrophils (CD15+), and CD3+ T cells (comprising both CD4+ and CD8+ T cells) were assessed. (B and C) The frequencies (mean ± SEM) of both cell subsets in urine are depicted during the follow-up period. (D) When gating on lineage-negative (i.e., CD3CD56CD19) cells, M-MDSCs were identified as CD15CD14+CD11b+CD33+HLA-DRlo. (E and F) Urine LinCD14+CD33+HLA-DRlo and their HLA-DRhi counterpart cells were sorted from 7 urine samples, and mRNA levels of CEBPB, ARG1, and INOS were measured relative to the levels detected in circulating LPS-activated monocytes from HDs (n = 3). Levels (mean ± SEM) of CEBPB are shown for the indicated cell subsets (E) and correlated with ARG1 and INOS mRNA levels (F). A 2-tailed, paired Student’s t test was performed to compare both cell populations, and Spearman’s rank correlation coefficients (R) and the corresponding P values are indicated on each panel in F. Lines indicate linear regression. (G) Frequencies (mean ± SEM) of urine M-MDSCs during the follow-up period. (H) Graphs show the mean (± SEM) of total cell numbers in pre- and post-BCG urine samples and absolute numbers of the indicated cells subsets in post-BCG samples. *P < 0.05, **P < 0.01, and ****P < 0.0001, by 1-way ANOVA, followed by a post test for linear trend to assess longitudinal changes.
Figure 2
Figure 2. Recurrence-free and progression-free survival in patient groups following BCG therapy for NMIBC.
Recurrence-free survival was assessed using the Kaplan-Meier approach in a cohort of 28 patients receiving BCG therapy (with the first instillation at month 0 and the last at month 1.5). Censored patients are represented by symbols. Patients were segregated into 2 groups (n = 14 patients in each group) on the basis of urine levels of neutrophils (A), T cells (B), or M-MDSCs (C), i.e., the mean percentage of CD15+, the mean percentage of CD3+, or the mean percentage of LinCD14+CD11b+CD33+HLA-DRlo cells above the median (High) versus below the median (Low) in post-BCG samples (2–6 time points per patient). (D) The mean T cell/MDSC ratio in post-BCG urine samples identified 2 groups: patients with higher frequencies of M-MDSCs than of T cells (i.e., log ratio <0) and conversely (i.e., log ratio >0). (E) The T cell/MDSC ratio was measurable at early time points before BCG (1 or 2) for 10 patients and correlated with the mean T cell/MDSC ratios in post-BCG samples from corresponding patients. The line indicates linear regression, and Spearman’s rank correlation coefficients (R) and the corresponding P value are indicated. Recurrence-free survival (F) and progression-free survival (G) according to the T cell/MDSC ratio. P values from log-rank tests are indicated on each panel. T, T cell.
Figure 3
Figure 3. Skewing toward ILC2 is associated with low T cell/MDSC ratios during BCG therapy for NMIBC.
(A) Representative example of ILC labeling. Cells were gated on live lineage-negative CD127+ leukocytes (with lineage including CD3, CD14, CD56, CD19, CD11c, CD303a, CD15, CD203c, and FcεR1α). (B) Quantification of ILC1 (LinCD127+CRTH2c-Kit), ILC2 (LinCD127+CRTH2+), and ILC3 (LinCD127+CRTH2c-Kit+) among urine cells (n = 23 samples). (C) Absolute number of ILC2 in post-BCG samples. (D) Cocultures of PBMCs from HDs (n = 6) with the NMIBC cell line Bu68.8, BCG (MOI = 1), or medium alone for 4 days. Repartition of ILC1, ILC2 and ILC3 subsets as well as frequencies of total ILC are shown for each indicated conditions. (E) ILC2 frequencies in post-BCG urine samples from patients with high (T/Mhi, n = 10) or low (T/Mlo, n = 13) T cell/MDSC ratios, as identified in Figure 2, were compared (2-tailed Student’s t test). ILC2 frequencies were correlated with the T cell/MDSC ratios (F) as well as T cell (G) and M-MDSC (H) frequencies in corresponding urine samples. Lines indicate linear regression. Spearman’s rank correlation coefficients (R) and the corresponding P values are indicated in FH. *P < 0.05, **P < 0.01, and ****P < 0.0001, by 1-way ANOVA followed by Tukey’s test (B), a post test for linear trend (C), or Dunnett’s test (D) for comparison of subsets, longitudinal changes, or conditions versus medium, respectively.
Figure 4
Figure 4. Peripheral M-MDSCs and ILC2 in blood from NMIBC and MIBC patients.
(A and B) Ex vivo frequencies of (A) M-MDSCs (LinCD14+CD33+CD11b+HLA-DRlo cells) and (B) ILC2 (LinCD127+CRTH2+) measured in PBMCs from HDs (n = 14), patients with NMIBC (n = 18), and patients with MIBC at the time of cystectomy (n = 22 and n = 21 for M-MDSCs and ILC2, respectively). **P < 0.01, by 1-way ANOVA followed by Dunnett’s test. (C) Peripheral M-MDSC levels were correlated with those of the indicated ILC subsets (n = 20). Lines indicate linear regression. Spearman’s rank correlation coefficients (R) and the corresponding P values are indicated.
Figure 5
Figure 5. IL-13 is produced by ILC2 upon BCG stimulation and is able to recruit and induce suppressive function in monocytic cells.
(A) Frequencies of ILC2 in urine samples with undetectable (n = 7) versus detectable (n = 6) urinary IL-13 (detection limit: 5 pg/ml). (B) Representative FACS histograms of IL-13–producing ILC2 upon stimulation with BCG (MOI = 1) or medium alone in PBMCs from HDs (n = 6) and MIBC patients (n = 5) and (C) their quantification. (D) IL-13 production in ILC2 from patients with MIBC following coculture with nonmalignant urothelium (HCV-29), Bu68.8, or TCC-Sup tumor cell lines. (C and D) Statistical analysis was performed using a 2-tailed, paired Student’s t test to compare stimulated versus medium-only conditions and a 2-tailed, unpaired Student’s t test to compare patients with HDs (C) and 1-way ANOVA followed by Dunnett’s test to compare cell lines with the control condition (D). (E) Representative example of IL-13Rα1 labeling. (F) Levels of ex vivo IL-13Rα1 expression on the indicated monocytic cells from PBMCs obtained from HDs (n = 9), NMIBC patients (n = 18), and MIBC patients (n = 10) and from post-BCG urine samples (n = 8), expressed as the ratio of mean fluorescence intensity (RFI) of specific staining versus the isotype Ig control. A 2-tailed, paired Student’s t test was performed to compare M-MDSCs with CD14+HLA-DR+/hi cells and an unpaired Student’s t test to compare urine with circulating counterparts. (G) Chemotactic response of CD14+ cells and CD3+/CD19+ lymphocytes from HD PBMCs (n = 6; upper chamber) to medium alone or IL-13 (100 ng/ml; lower chamber) using Transwell plates. (H) Representative FACS histograms of CFSE-labeled activated T cells cultured alone or with purified CD14+ cells pretreated with IL-13 (IL-13–treated CD14+ cells) or not (CD14+ cells). (I and J) Quantification of the proliferation index in CD8+ (I) and CD4+ (J) T cells. (K) IL-13 concentration in supernatants of PBMCs (n = 8) subjected to 3 days of stimulation with BCG or no stimulation. (L) Representative example of CFSE-labeled activated CD8+ T cells cocultured with CD14+ cells previously conditioned with filtered supernatants of unstimulated or BCG-stimulated PBMCs in the presence of either anti–IL-13–blocking antibody or isotype IgG1 control (10 μg/ml each). (M) Comparison of the proliferation index in each indicated condition (n = 3, representative of 2 independent sets of experiments). *P < 0.05, **P < 0.01, ***P < 0.001, and ****P < 0.0001, by 2-tailed, paired Student’s t test (GK) and 1-way ANOVA followed by Tukey’s test (M). Div, percentage of cells with at least 1 division; Ig, isotype IgG1 control; PI, proliferation index; SN, supernatant.
Figure 6
Figure 6. TCGA data analysis for MIBC.
Tumor mRNA expression levels were obtained from TCGA for 300 patients with BCa. (A) Survival analysis based on the CD3E/CD14 expression ratio (the median value was used to split samples). (B) Patients were first segregated on the basis of their CD3 levels (below and above the median value), and both groups were subsequently divided into 2 subgroups on the basis of CD14 levels (below and above the respective median values in the subgroups). (C) Comparison of CD14 levels (normalized as described in the Methods section) between samples with detectable and undetectable IL13 expression levels. (D) Survival analysis based on CD3E (the median value was used to split samples) and IL13 expression (detectable versus undetectable expression). P values were determined by log-rank test (A, B, and D) and the Wilcoxon test (C).
Figure 7
Figure 7. Putative model of a suppressive axis involved in BCa recurrence.
Schematic representation of the immune profiles associated with a high or low risk of bladder tumor recurrence. Interactions between tumor cells or BCG and immune cell subsets that are proposed to play an important role in the disease outcome are indicated. Both tumor and BCG can directly or indirectly recruit MDSCs and T cells locally, as well as recruit and activate ILC2 to produce IL-13 that can amplify MDSC recruitment and induction. Finally, the resulting balance between MDSC and T cell levels may be a critical factor regulating tumor recurrence.

References

    1. Gajewski TF, Schreiber H, Fu YX. Innate and adaptive immune cells in the tumor microenvironment. Nat Immunol. 2013;14(10):1014–1022. doi: 10.1038/ni.2703. - DOI - PMC - PubMed
    1. Joyce JA, Fearon DT. T cell exclusion, immune privilege, and the tumor microenvironment. Science. 2015;348(6230):74–80. doi: 10.1126/science.aaa6204. - DOI - PubMed
    1. Siegel RL, Miller KD, Jemal A. Cancer statistics, 2016. CA Cancer J Clin. 2016;66(1):7–30. doi: 10.3322/caac.21332. - DOI - PubMed
    1. Messing EM. Why should we increase public awareness of bladder cancer, and how can we do it? Nat Clin Pract Urol. 2008;5(3):117. - PubMed
    1. Babjuk M, et al. EAU Guidelines on non-muscle-invasive urothelial carcinoma of the bladder: update 2016. Eur Urol. 2017;71(3):447–461. doi: 10.1016/j.eururo.2016.05.041. - DOI - PubMed

MeSH terms