. 2017 Aug;23(8):945-953.
doi: 10.1038/nm.4362. Epub 2017 Jun 26.

A tripartite complex of suPAR, APOL1 risk variants and αvβ3 integrin on podocytes mediates chronic kidney disease

Affiliations

A tripartite complex of suPAR, APOL1 risk variants and αvβ3 integrin on podocytes mediates chronic kidney disease

Salim S Hayek et al. Nat Med. 2017 Aug.

Abstract

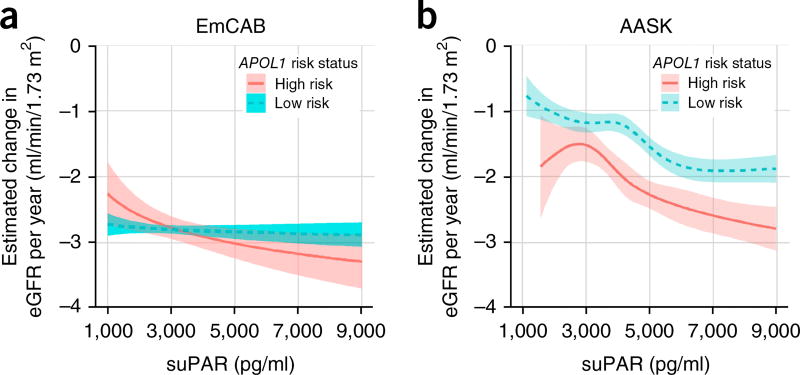
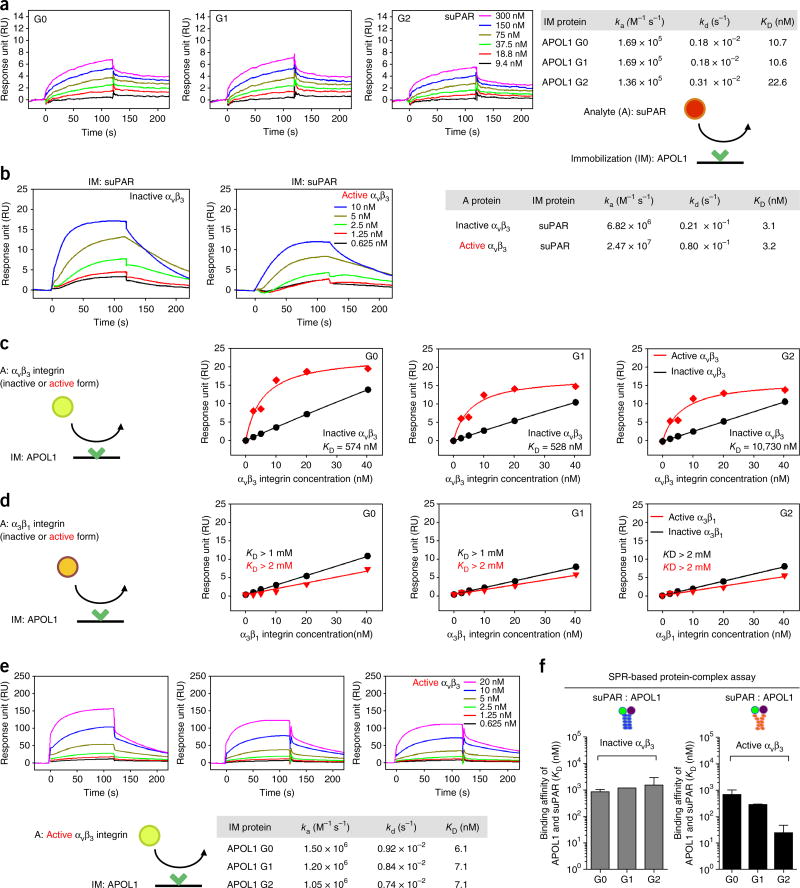
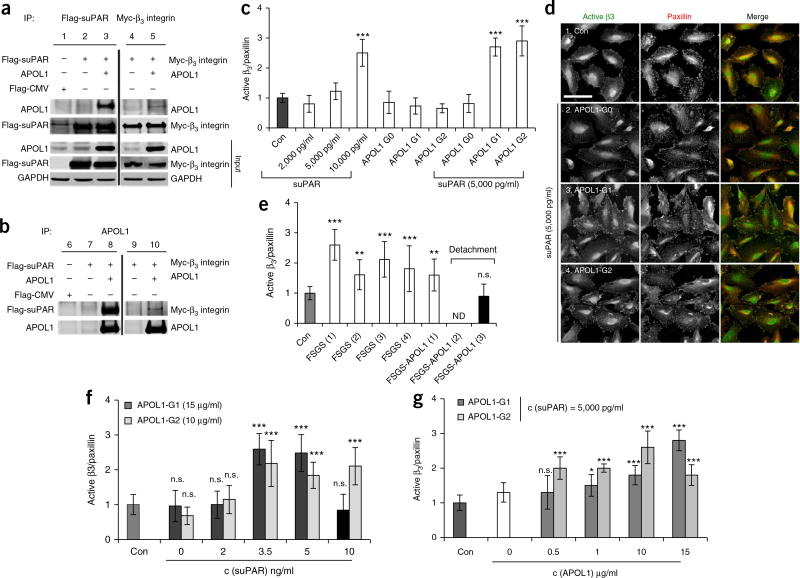
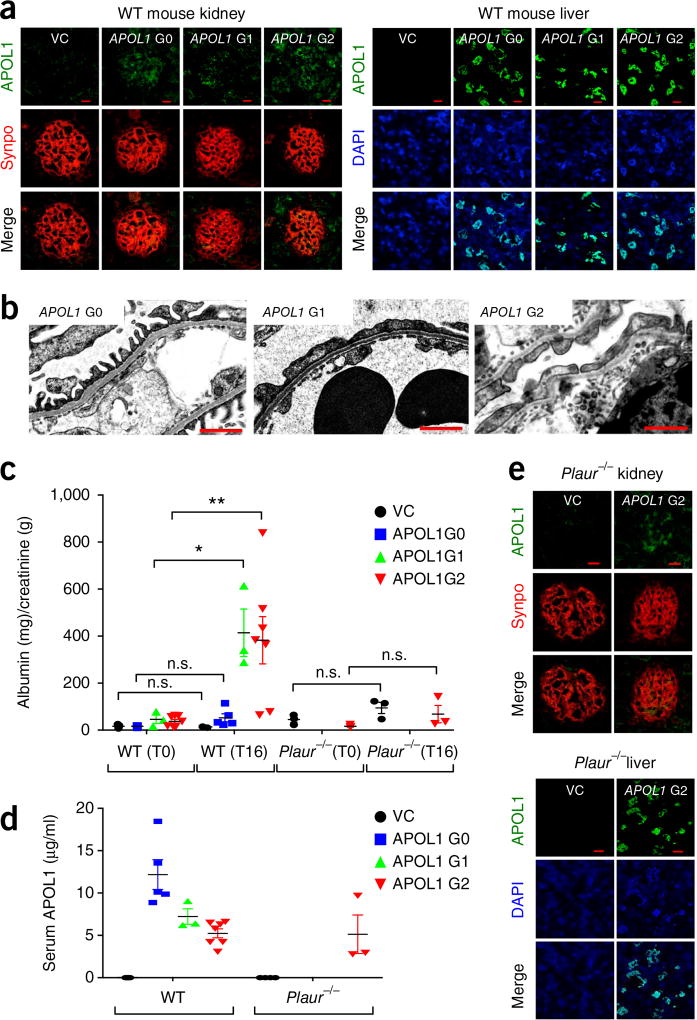
Soluble urokinase plasminogen activator receptor (suPAR) independently predicts chronic kidney disease (CKD) incidence and progression. Apolipoprotein L1 (APOL1) gene variants G1 and G2, but not the reference allele (G0), are associated with an increased risk of CKD in individuals of recent African ancestry. Here we show in two large, unrelated cohorts that decline in kidney function associated with APOL1 risk variants was dependent on plasma suPAR levels: APOL1-related risk was attenuated in patients with lower suPAR, and strengthened in those with higher suPAR levels. Mechanistically, surface plasmon resonance studies identified high-affinity interactions between suPAR, APOL1 and αvβ3 integrin, whereby APOL1 protein variants G1 and G2 exhibited higher affinity for suPAR-activated avb3 integrin than APOL1 G0. APOL1 G1 or G2 augments αvβ3 integrin activation and causes proteinuria in mice in a suPAR-dependent manner. The synergy of circulating factor suPAR and APOL1 G1 or G2 on αvβ3 integrin activation is a mechanism for CKD.


Conflict of interest statement

COMPETING FINANCIAL INTERESTS

The authors declare competing financial interests: details are available in the online version of the paper.

Figures

Figure 1
Figure 1
Synergy of an APOL1 high-risk genotype and suPAR levels determines yearly loss of kidney function. (a,b) Estimated yearly change in estimated glomerular filtration rate (eGFR) according to APOL1 status (green, low risk; red, high risk) and continuous levels of suPAR at cohort enrollment for the Emory Cardiovascular Biobank (EmCAB; n = 487) (a) and the African American Study of Kidney Disease and Hypertension cohort (AASK; n = 607) (b). Yearly change in eGFR was estimated from linear mixed-effects models of eGFR adjusted for age, sex, body-mass index, hypertension, diabetes mellitus (in EmCAB), smoking status, randomization group (in AASK) and suPAR level in both baseline levels and slope over time. In EmCAB, suPAR was log-transformed. In AASK, suPAR was log-transformed and modeled using restricted cubic splines to allow for deviations from log linearity.
Figure 2
Figure 2
APOL1 forms high-affinity interactions with suPAR and αvβ3 integrin. All sensorgrams were generated using SPR assays. Rate constants (ka and kd) were determined by kinetic fitting of the sensorgrams using a one-to-one binding equation, and equilibrium dissociation constant (KD) values were determined by calculating kd/ka. (a) Sensorgrams of suPAR (0–300 nM) binding to immobilized APOL1 protein variants (G0, G1 and G2), and calculated KD values. (b) Sensorgrams of αvβ3 integrin (0–10 nM) binding to immobilized suPAR in the absence (inactive form) and presence (active form) of Mn2+ (0.5 mM), and calculated KD values. (c,d) Steady-state affinity fitting curves of αvβ3 (c) or α3β1 (d) integrin (0–40 nM) binding to immobilized APOL1 (G0, G1 and G2) in the absence (inactive) and presence (active) of Mn2+ (0.5 mM). (e) Sensorgrams of αvβ3 integrin (0–20 nM) binding to immobilized APOL1 (G0, G1 and G2) in the presence of Mn2+ (0.5 mM), and calculated KD values. (f) Bar graphs showing the determined KD values for suPAR in the presence of αvβ3 (5 nM), increasing concentrations of suPAR (0–300 nM) and immobilized APOL1 proteins (G0, G1 and G2) in the absence (inactive) or presence (active) of Mn2+ (0.5 mM). The average KD values were determined from two independent experiments, and error bars for KD measurements indicate s.e.m. (n = 2) (a–f). A, analyte; IM, immobilization.
Figure 3
Figure 3
High levels of suPAR are needed to synergize with APOL1 G1 and G2 to induce αvβ3 integrin activation on human podocytes. (a,b) Representative western blot images for immunoprecipitation assay using HEK293T cells transfected with plasmids expressing APOL1 G0, Flag-tagged suPAR and Myc-tagged β3 integrin in different combinations, as indicated. Data are representative of at least three independent experiments. The empty pFlag-CMV3 vector was used as a negative control. (a) Cell lysates were immunoprecipitated using a mouse monoclonal anti-Flag (M2) or monoclonal anti-Myc antibody. (b) Cell lysates were immunoprecipitated using a rabbit polyclonal anti-APOL1. The cell lysates and immunoprecipitates were analyzed by immunoblotting with antibodies, as indicated. Analysis of the input (1%) indicates that the levels of APOL1, β3 integrin and suPAR are overexpressed in the transfected cells. IP, immunoprecipitation. (c) Bar graph representing level of activated β3 integrin detected in human podocytes cultured in healthy serum without (Con) or with added proteins: suPAR (2,000, 5,000 and 10,000 pg/ml), APOL1 G0, G1 and G2 (15 µg/ml) or a combination of both proteins. Data represent measurements of >50 cells and are plotted as means ± s.d. (n = 3). ***P < 0.001. Statistical significance was determined by unpaired two-tailed Student’s t-test. (d) Immunofluorescence analysis of human podocytes grown in human serum in the absence (Con) or presence of suPAR (5,000 pg/ml) and three APOL1 variant proteins (15 µg/ml). Cells were stained with AP5 antibody that specifically recognizes the active form of β3 integrin, and with anti-paxillin antibody to mark focal adhesions. Scale bar, 25 µm. (e) Bar graph representing the level of β3-integrin activation detected in human podocytes cultured in healthy serum without (Con) or with three serum samples from individuals with FSGS carrying the nonrisk APOL1 genotype, and three different serum samples from individuals with FSGS carrying two APOL1 risk-allele genotypes. FSGS-APOL1 serum #2, and to a substantial degree, serum #3, detached the cells such that the quantification of β3-integrin activation was either not determined (n.d.) or not accurate (striped bar graph). Data represent measurements of >50 cells and are plotted as means ± s.d. (n = 3). Statistical significance was determined by unpaired two-tailed Student’s t-test. (f,g) Bar graph representing the level of β3-integrin activation detected in human podocytes cultured in healthy serum without (Con) or with the addition of the indicated concentrations of the proteins. In g, the concentration of suPAR was 5,000 pg/ml. Data represent measurements of >50 cells and are plotted as means ± s.d. (n = 3). *P < 0.01; ***P < 0.001. Statistical significance was determined by unpaired two-tailed Student’s t-test.
Figure 4
Figure 4
In vivo gene delivery of APOL1 G1 and G2, but not of G0, gene constructs caused proteinuria and podocyte foot-process effacement in wild-type mice, but not in Plaur−/− mice. To express APOL1 in C57BL/6 mice or Plaur−/− mice, in vivo gene delivery was performed and the kidney phenotype evaluated 16 h after APOL1 gene (G0, G1 and G2) injection. (a) APOL1 protein could be detected in both the glomerulus and liver of injected animals. Double immunostaining of APOL1 (green) and synaptopodin (synpo, red), a podocyte marker. VC, pcDNA 3.1 vector control. Scale bars, 10 µm. (b) Transmission electron microscopy (TEM) analysis of the kidney glomeruli in APOL1 gene (G0, G1 and G2) engineered mice. TEM images display podocyte foot processes. Scale bars, 1 µm. (c,d) Examination of proteinuria (c) and serum APOL1 levels (d) in animals into which APOL1 genes were injected (n = 7 for VC; n = 5 for APOL1 G0; n = 3 for APOL1 G1; n = 7 for APOL1 G2; n = 3 for all Plaur−/− mice). Analysis of urinary protein is shown as albumin (mg)/creatinine (g) ratio before (T0) and 16 h after (T16) gene delivery. Data are shown as means ± s.e.m. One-way ANOVA, followed by Tukey′s multiple-comparison test in which values at T16 were compared to those at T0; *P < 0.05, **P < 0.01. Welch’s ANOVA was used when unequal variances were noted between groups (P = 0.014). (e) APOL1 G2 protein was detected in the glomerulus and liver of Plaur−/− mice 16 h after the gene was injected into a tail vein. Double immunostaining of Plaur−/− (green) and synaptopodin (synpo, red). VC, pcDNA 3.1 vector control. Scale bars, 10 µm.

Comment in

References

    1. Chen TK, Estrella MM, Parekh RS. The evolving science of apolipoprotein-L1 and kidney disease. Curr. Opin. Nephrol. Hypertens. 2016;25:217–225. - PubMed
    1. Tzur S, et al. Missense mutations in the APOL1 gene are highly associated with end stage kidney disease risk previously attributed to the MYH9 gene. Hum. Genet. 2010;128:345–350. - PMC - PubMed
    1. Genovese G, et al. Association of trypanolytic ApoL1 variants with kidney disease in African Americans. Science. 2010;329:841–845. - PMC - PubMed
    1. Kao WH, et al. MYH9 is associated with nondiabetic end-stage renal disease in African Americans. Nat. Genet. 2008;40:1185–1192. - PMC - PubMed
    1. Parsa A, et al. APOL1 risk variants, race, and progression of chronic kidney disease. N. Engl. J. Med. 2013;369:2183–2196. - PMC - PubMed

MeSH terms