. 2017 Oct 26;36(43):5958-5968.
doi: 10.1038/onc.2017.206. Epub 2017 Jun 26.

Ror2-mediated alternative Wnt signaling regulates cell fate and adhesion during mammary tumor progression

Affiliations

Ror2-mediated alternative Wnt signaling regulates cell fate and adhesion during mammary tumor progression

K Roarty et al. Oncogene. .

Abstract

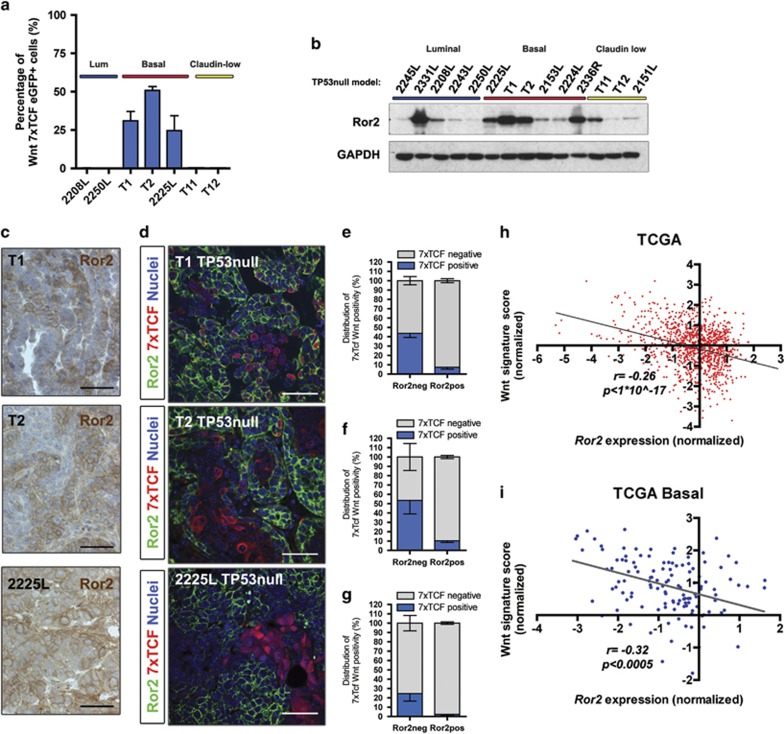
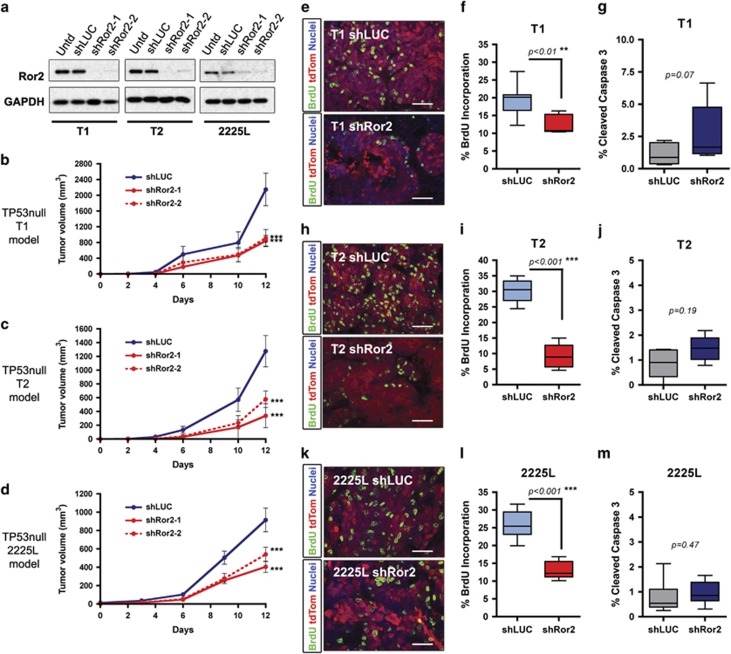
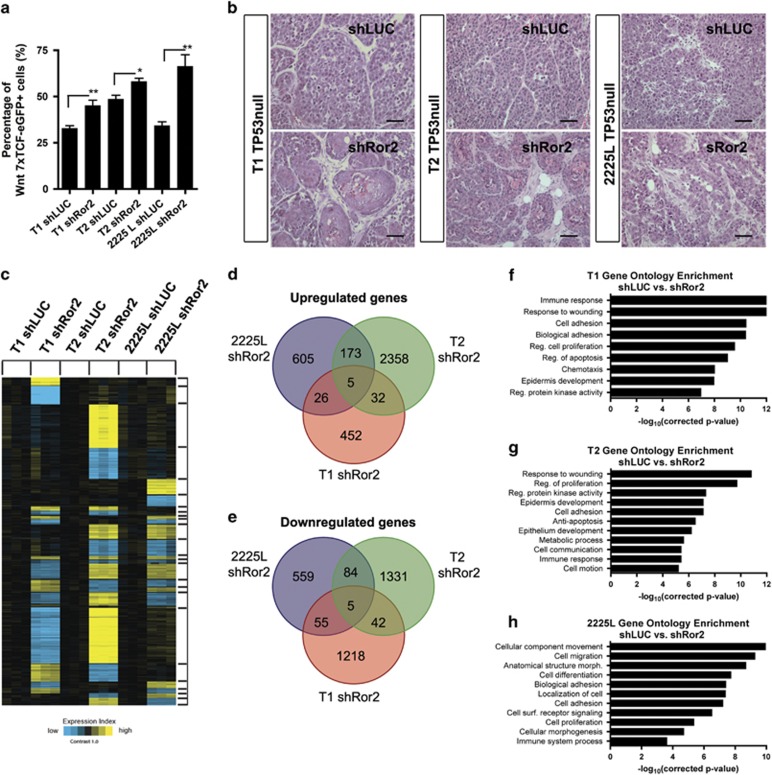
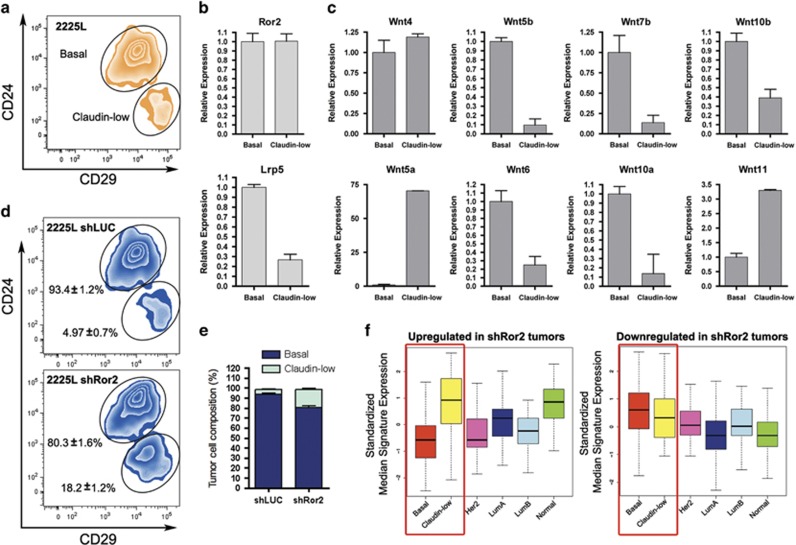
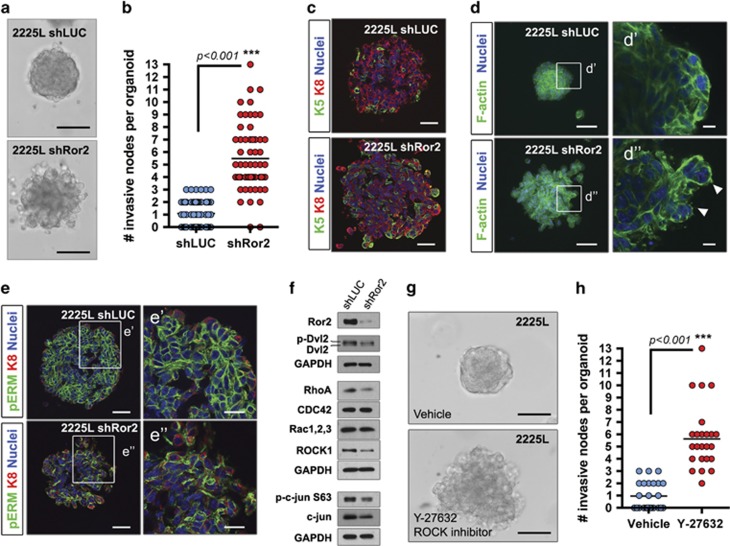
Cellular heterogeneity is a common feature in breast cancer, yet an understanding of the coexistence and regulation of various tumor cell subpopulations remains a significant challenge in cancer biology. In the current study, we approached tumor cell heterogeneity from the perspective of Wnt pathway biology to address how different modes of Wnt signaling shape the behaviors of diverse cell populations within a heterogeneous tumor landscape. Using a syngeneic TP53-null mouse model of breast cancer, we identified distinctions in the topology of canonical Wnt β-catenin-dependent signaling activity and non-canonical β-catenin-independent Ror2-mediated Wnt signaling across subtypes and within tumor cell subpopulations in vivo. We further discovered an antagonistic role for Ror2 in regulating canonical Wnt/β-catenin activity in vivo, where lentiviral shRNA depletion of Ror2 expression augmented canonical Wnt/β-catenin signaling activity across multiple basal-like models. Depletion of Ror2 expression yielded distinct phenotypic outcomes and divergent alterations in gene expression programs among different tumors, despite all sharing basal-like features. Notably, we uncovered cell state plasticity and adhesion dynamics regulated by Ror2, which influenced Ras Homology Family Member A (RhoA) and Rho-Associated Coiled-Coil Kinase 1 (ROCK1) activity downstream of Dishevelled-2 (Dvl2). Collectively, these studies illustrate the integration and collaboration of Wnt pathways in basal-like breast cancer, where Ror2 provides a spatiotemporal function to regulate the balance of Wnt signaling and cellular heterogeneity during tumor progression.


Conflict of interest statement

The authors declare no conflict of interest.

Figures

Figure 1
Figure 1
Assessment of canonical Wnt activity and Ror2 expression uncovers the complex coexistence of Wnt pathways in TP53-null mouse models and human breast cancer. (a) The percentage of canonical Wnt-active cells in basal-like TP53-null tumors relative to luminal and claudin-low, based on fluorescence-activated cell sorting (FACS) analysis of tumors harboring a lentiviral Wnt reporter with a 7xTCF responsive promoter upstream of eGFP. FACS percentages for basal-like tumors: T1 (31.0±6.1%, n=3 tumors), T2 (50.9±2.5%, n=3 tumors) and 2225L (24.6±9.8%, n=3 tumors). (b) Western blot for Ror2 in a panel of TP53-null tumors representing luminal, basal-like and claudin-low subtypes. (c) Immunohistochemistry for Ror2 within T1, T2 and 2225L basal-like TP53-null models depicting a spectrum of Ror2 positivity within each basal-like model. Scale 50 μm. (d) Co-immunofluorescence for Ror2 (green) and 7xTCF-mCherry (red), demarcating active canonical Wnt activity, across three TP53-null basal-like models. Scale 50 μm. (eg) Quantitation of immunofluorescence staining of mCherry positive (7xTCF responsive) Wnt populations within Ror2-negative and Ror2-positive populations within basal-like tumors (e) T1 (43.7±4.4% in Ror2-neg vs 7.3±2.1% in Ror2-pos tumor cells, n=6 tumors), (f) T2 (53.5±14.14% in Ror2-neg vs 10.2±1.7% in Ror2-pos tumor cells, n=6 tumors) and (g) 2225L (24±8.2% in Ror2-neg vs 2.2±1.3% in Ror2-pos tumor cells). (h) Scatter plot of individual human breast tumors within the TCGA database illustrating an inverse correlation between Ror2 expression and an active canonical Wnt signature (Spearman rank correlation, n=1095 cases, correlation coefficient: −0.26, one-sided P<1 × 10⁻¹⁷). (i) Scatter plot of human breast tumors of the basal-like subtype within TCGA demonstrating an inverse correlation between Ror2 expression and an active canonical Wnt signature (Spearman rank correlation, 122 cases, correlation coefficient: −0.32, one-sided P<0.0005).
Figure 2
Figure 2
Lentiviral silencing of Ror2 expression in basal-like TP53-null models impairs tumor growth. (a) Western blots for Ror2 illustrating shRNA depletion of Ror2 protein levels with two independent hairpins in T1, T2 and 2225L TP53-null basal-like models. GAPDH protein depicts equal loading between samples. (b–d) Tumor growth curves representing changes in tumor volume over time (days) for (b) T1, (c) T2 and (d) 2225L, comparing changes in tumor volume between shLUC control tumors and shRor2 tumors (n=6 tumors within each group, ***P<0.001). Volumes were calculated using the formula, volume=(length × width2)/2. (e,f,h,i,k,l) Proliferation of shLUC vs shRor2 tumors based on BrdU incorporation. (e,h,k) Representative immunofluorescence images of BrdU-positive cells (green) among transduced tumor cells (red) between shLUC and shRor2 groups within (e) T1, (h) T2 and (k) 2225L. Scale 50 μm. (f,i,l) Quantitation of BrdU-positive cells (green) among transduced tumors cells (red) between shLUC and shRor2 groups among (f) T1 (shLUC 19.4±4.2% vs shRor2 12.6±2.5%, n=6 **P<0.01), (i) T2 (shLUC 30.1±3.6% vs shRor2 9.1±3.8%, n=6, ***P<0.001), (l) 2225L (shLUC 26.1±3.9% vs shRor2 13.0±2.4%, n=6, ***P<0.001). (g,j,m) Quantitation of apoptosis, CC3 positivity, among transduced tumor cells between shLUC and shRor2 groups among (g) T1 (shLUC 1.0±0.4% vs shRor2 3.5±3.2%, n=6), (j) T2 (shLUC 0.90±0.52% vs shRor2 1.5±0.50%, n=6) and (m) 2225L (shLUC 0.80±0.65% vs shRor2 0.96±0.47%, n=6).
Figure 3
Figure 3
Depletion of Ror2 expression enhances canonical Wnt signaling across basal-like TP53-null models despite distinctions in both histopathology and gene expression outcomes. (a) Elevated Wnt/β-catenin signaling occurs in the absence of Ror2 in all three basal-like TP53-null models. Quantitation of fluorescence-activated cell sorting analysis of 7xTCF-eGFP positivity within shLUC and shRor2 tumors within T1, T2 and 2225L models (n=3 shLUC tumors and n=3 shRor2 tumors per basal-like model, *P<0.05, **P<0.001). (b) H&E staining of shLUC and shRor2 tumors showing squamous differentiation in T1 and T2 and disorganization in 2225L upon Ror2 loss. Scale 50 μm. (c) Supervised clustering and heat map showing gene expression changes (P<0.01 by t-test, fold change>1.4) across TP53-null basal-like models T1, T2 and 2225L, harboring shLUC vs shRor2 hairpins (derived from sorted transduced tdTomato-positive tumor cells). Within each model (T1, T2, 2225L), expression values were centered on the corresponding control. Bright yellow/blue represents minimum of two-fold change from the corresponding control. (d, e) Venn diagrams of (d) upregulated and (e) downregulated genes represented in shLUC and shRor2 groups within T1, T2 and 2225L, illustrating gene expression overlap between basal-like TP53-null models in response to Ror2 depletion. (f–h) Gene ontology analysis illustrating the enrichment of particular gene expression programs within (f) T1, (g) T2 and (h) 2225L.
Figure 4
Figure 4
shRNA depletion of Ror2 expression in vivo results in changes in tumor cell plasticity between basal-like and claudin-low subpopulations in the 2225L TP53-null model. (a) Representative fluorescence-activated cell sorting (FACS) plot depicting the segregation of 2225L tumors into two distinct populations based on CD24 and CD29 cell surface marker staining. (b) Quantitative real-time PCR of Ror2 and Lrp5 within sorted basal-like and claudin-low fractions from 2225L. (c) Quantitative real-time PCR of Wnt ligands within sorted basal-like and claudin-low subpopulations within 2225L. (d) FACS plots of shLUC and shRor2 tumors stained with CD24 and CD29, illustrating the shift in tumor cell populations upon Ror2 loss, from basal-like to claudin-low. (e) Quantitation of basal-like and claudin-low populations within shLUC and shRor2 2225L TP53-null tumors (shLUC basal-like 93.4±1.2% claudin-low 4.97±0.7% vs shRor2 basal-like 80.3±1.6% claudin-low 18.2±1.2%, n=5). (f) Box plots depicting gene expression signatures across subtypes represented in shRor2 vs shLUC tumors. Genes upregulated in shRor2 2225L tumors are associated with claudin-low features. Genes downregulated are associated with basal-like features (red boxes).
Figure 5
Figure 5
Three-dimensional modeling of tumor organoids reveals alterations in cytoskeletal and adhesion dynamics upon Ror2 loss. (a) Brightfield DIC images showing enhanced migration of shRor2 organoids into the surrounding matrix. Scale 50 μm. (b) Quantitation of cellular protrusions emanating into the surrounding matrix in shLUC vs shRor2 organoids (***P<0.001, n=63 organoids per shLUC and shRor2 group). (c) Immunofluorescence of shLUC and shRor2 organoids for K8 (red) and K5 (green). Scale 50 μm. (d) Phalloidin staining and Maximum Intensity Projection of shLUC and shRor2 organoids demonstrating alterations in F-actin dynamics upon Ror2 loss. Scale 50 μm. (d′) Magnified slice of shLUC organoid within (d) depicting cortical F-actin staining at cell junctions in shLUC 2225L organoids. (d″) Magnified slice of shRor2 organoid within (d) illustrating the change in patterning of F-actin and presence of F-actin projections within protrusive nodes of shRor2 organoids (arrows). Scale 10 μm. (e) Immunofluorescence of pERM (green), K8 (red) and nuclei (blue), showing changes in pERM upon Ror2 loss. Scale 50 μm. (e′) Magnified shLUC pERM staining. (e″) Magnified shRor2 pERM staining. Scale 25 μm. (f) Western blot of 2225L shLUC vs shRor2 organoids for Ror2, p-Dvl2, Dvl2, RhoA, CDC42, Rac1/2/3, ROCK1, p-c-jun S63 and c-jun. (g) Representative brightfield DIC images of shLUC vs shRor2 organoids after administration of Y-27632, a ROCK inhibitor (50 μm). Scale 50 μm. (h) Quantitation of the number of invasive nodes per organoids between control and ROCK inhibitor-treated organoids after 3 days (***P<0.001, n=30 organoids per shLUC and shRor2 group).

References

    1. Perou CM, Sorlie T, Eisen MB, van de Rijn M, Jeffrey SS, Rees CA et al. Molecular portraits of human breast tumours. Nature 2000; 406: 747–752. - PubMed
    1. Sorlie T, Perou CM, Tibshirani R, Aas T, Geisler S, Johnsen H et al. Gene expression patterns of breast carcinomas distinguish tumor subclasses with clinical implications. Proc Natl Acad Sci USA 2001; 98: 10869–10874. - PMC - PubMed
    1. Sorlie T, Tibshirani R, Parker J, Hastie T, Marron JS, Nobel A et al. Repeated observation of breast tumor subtypes in independent gene expression data sets. Proc Natl Acad Sci USA 2003; 100: 8418–8423. - PMC - PubMed
    1. Prat A, Perou CM. Deconstructing the molecular portraits of breast cancer. Mol Oncol 2011; 5: 5–23. - PMC - PubMed
    1. Lehmann BD, Bauer JA, Chen X, Sanders ME, Chakravarthy AB, Shyr Y et al. Identification of human triple-negative breast cancer subtypes and preclinical models for selection of targeted therapies. J Clin Invest 2011; 121: 2750–2767. - PMC - PubMed

MeSH terms