. 2017 Jun 26;13(6):e1006862.
doi: 10.1371/journal.pgen.1006862. eCollection 2017 Jun.

Distinguishing functional polymorphism from random variation in the sequences of >10,000 HLA-A, -B and -C alleles

Affiliations

Distinguishing functional polymorphism from random variation in the sequences of >10,000 HLA-A, -B and -C alleles

James Robinson et al. PLoS Genet. .

Abstract

HLA class I glycoproteins contain the functional sites that bind peptide antigens and engage lymphocyte receptors. Recently, clinical application of sequence-based HLA typing has uncovered an unprecedented number of novel HLA class I alleles. Here we define the nature and extent of the variation in 3,489 HLA-A, 4,356 HLA-B and 3,111 HLA-C alleles. This analysis required development of suites of methods, having general applicability, for comparing and analyzing large numbers of homologous sequences. At least three amino-acid substitutions are present at every position in the polymorphic α1 and α2 domains of HLA-A, -B and -C. A minority of positions have an incidence >1% for the 'second' most frequent nucleotide, comprising 70 positions in HLA-A, 85 in HLA-B and 54 in HLA-C. The majority of these positions have three or four alternative nucleotides. These positions were subject to positive selection and correspond to binding sites for peptides and receptors. Most alleles of HLA class I (>80%) are very rare, often identified in one person or family, and they differ by point mutation from older, more common alleles. These alleles with single nucleotide polymorphisms reflect the germ-line mutation rate. Their frequency predicts the human population harbors 8-9 million HLA class I variants. The common alleles of human populations comprise 42 core alleles, which represent all selected polymorphism, and recombinants that have assorted this polymorphism.


Conflict of interest statement

The authors have declared that no competing interests exist. The authors NC and SYY are employed by Histogenetics Inc. There are no patents, products in development or marketed products to declare. This does not alter their adherence to all the PLOS Genetics policies on sharing data and materials, as detailed online in the guide for authors.

Figures
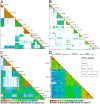
Fig 1
Fig 1. Pairwise comparison defines allele groups with high sequence similarity.
The dot plots show the results of pairwise comparison of nucleotide sequences within HLA-A, (Panel A) HLA-B (Panel B) HLA-C (Panel C) and all three combined (Panel D). A color scale indicates the number of nucleotide differences in each pair compared with red representing the most closely related alleles. The diagonal labeling in the individual gene plots indicates the allele groups, i.e. 01 in panel A is HLA-A*01, N indicates the number of alleles in each group that were used in the analysis. The diagonal labels do not show the following groups where N is less than 25: A*34, A*36, A*43, A*66, A*69, A*74, A*80, B*42, B*45, B*47, B*49, B*50, B*54, B*59, B*67, B*73, B*78, B*81, B*82, B*83 and C*18.
Fig 2
Fig 2. Frequencies of the second most common nucleotide at positions in exons 2 and 3.
The histograms show the frequency for HLA-A (top) –B (center) and –C (bottom) of the second most common nucleotide at each position in exons 2 and 3.
Fig 3
Fig 3. Distribution of polymorphic positions in the α1 and α2 domains.
The figure shows the frequency of the second most common amino acid at positions in the α1 and α2 domains of HLA-A (top), -B (center) and –C (bottom) allotypes where it has a frequency >1%. Position numbering is based on the mature protein.
Fig 4
Fig 4. Gene-specific positions of polymorphism.
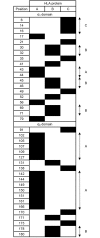
Boxes shaded black denote polymorphic positions (where the second most common amino acid has an incidence >1%) that are only polymorphic in one of the three HLA class I proteins.
Fig 5
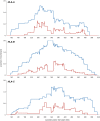
Fig 5. Gene conversion plots.
The figure provides a graphical representation of the output from the algorithm used to identify recombinant regions and plots the frequency with which each position is likely to part of a recombinant region. The two lines represent the minimum (red) and maximum (blue) potential regions likely to have been subject to recombination. The region with the greatest proportion of recombinants in the HLA-B graph, between positions 300 and 325, maps to the region encoding the Bw4 motif, which is known to have recombined between different HLA-B allele groups.
Fig 6
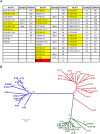
Fig 6. Core HLA-A, -B and –C alleles.
A Starting with the 42 core alleles (11 HLA-A, 17 HLA-B and 14 HLA-C) it is possible to derive all the other HLA-A, -B and –C alleles by events of recombination and point mutation. This is the minimum number of alleles by which this can be achieved. The core alleles are not meant to represent any particular human population, either ancient or modern. The yellow shading indicates potential archaic alleles that have been transmitted from Denisovans or Neanderthals. Red shading indicates rare allele that does not have a frequency > 0.001 in more than one reference population. B An unrooted phylogenetic tree of the core alleles. Numbers at the nodes indicate bootstrap support. Where a number is absent, support at that node was < 50.
Fig 7
Fig 7. Pairwise distances of alleles form characteristic distributions for HLA-A, -B and –C.
Shows the distribution of pairwise differences for all alleles (top row), core alleles and recombinant alleles (center row), and core alleles alone (bottom row) for HLA-A (left column), HLA-B (center column) and HLA-C (right column).
Fig 8
Fig 8. Most alleles within a SEG are related by single point substitutions.
Shows all of the members of the final HLA-A*02:01:01:01 SEG. A The parental HLA-A*02:01:01:01 allele has 423 “child” alleles that vary from A*02:01:01:01 by a point substitution (green). Additional alleles can be connected by two or more point substitutions (red). In the algorithm the intermediate SEGs, for example HLA-A*02:07:01, are constructed and subsequently added to other larger SEGs. B Ten other HLA-A*02 SEGs were identified that could not directly be linked to the HLA-A*02:01:01:01 SEG because they differed from it by more than one point substitution and no intermediate alleles were identified. All of the SEGS with more than a single child are derived by intragenic recombination. Six of the seven are based on an intragenic recombinant involving the HLA-A*02:01:01:01 SEG. The seventh is the core allele HLA-A*02:05:01.

References

    1. Altmann DM, Trowsdale J. Major histocompatibility complex structure and function. Curr Opin Immunol. 1989;2(1):93–8. Epub 1989/10/01. - PubMed
    1. Koller BH, Geraghty DE, DeMars R, Duvick L, Rich SS, Orr HT. Chromosomal organization of the human major histocompatibility complex class I gene family. J Exp Med. 1989;169(2):469–80. - PMC - PubMed
    1. Horton R, Wilming L, Rand V, Lovering RC, Bruford EA, Khodiyar VK, et al. Gene map of the extended human MHC. Nat Rev Genet. 2004;5(12):889–99. Epub 2004/12/02. doi: 10.1038/nrg1489 - DOI - PubMed
    1. Lienert K, Parham P. Evolution of MHC class I genes in higher primates. Immunol Cell Biol. 1996;74(4):349–56. doi: 10.1038/icb.1996.62 - DOI - PubMed
    1. Hughes AL, Yeager M, Carrington M. Peptide binding function and the paradox of HLA disease associations. Immunol Cell Biol. 1996;74(5):444–8. doi: 10.1038/icb.1996.74 - DOI - PubMed