

Assessing the impact of Benzo[a]pyrene on Marine Mussels: Application of a novel targeted low density microarray complementing classical biomarker responses
- PMID: 28651000
- PMCID: PMC5484464
- DOI: 10.1371/journal.pone.0178460
Assessing the impact of Benzo[a]pyrene on Marine Mussels: Application of a novel targeted low density microarray complementing classical biomarker responses
Abstract
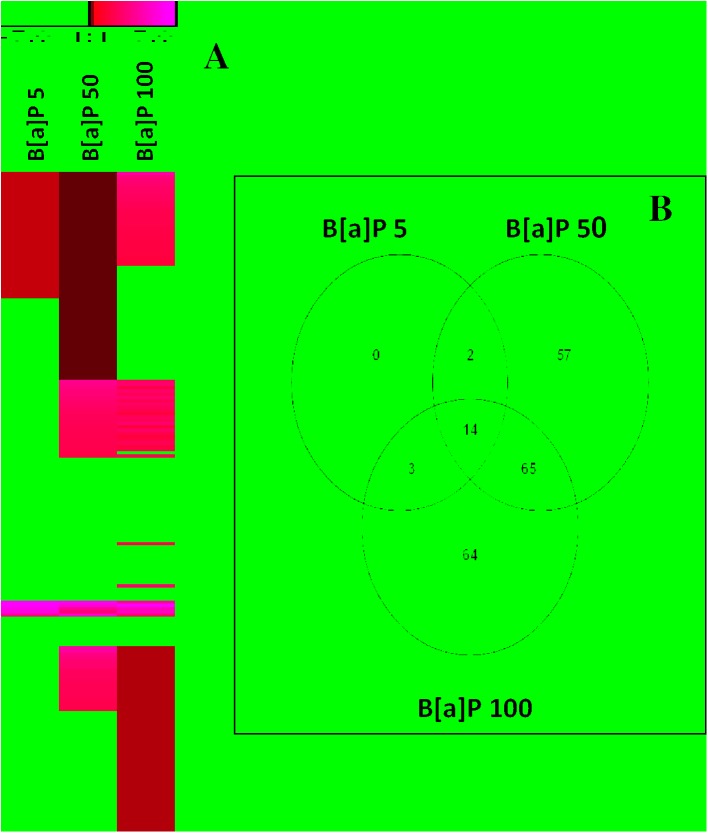
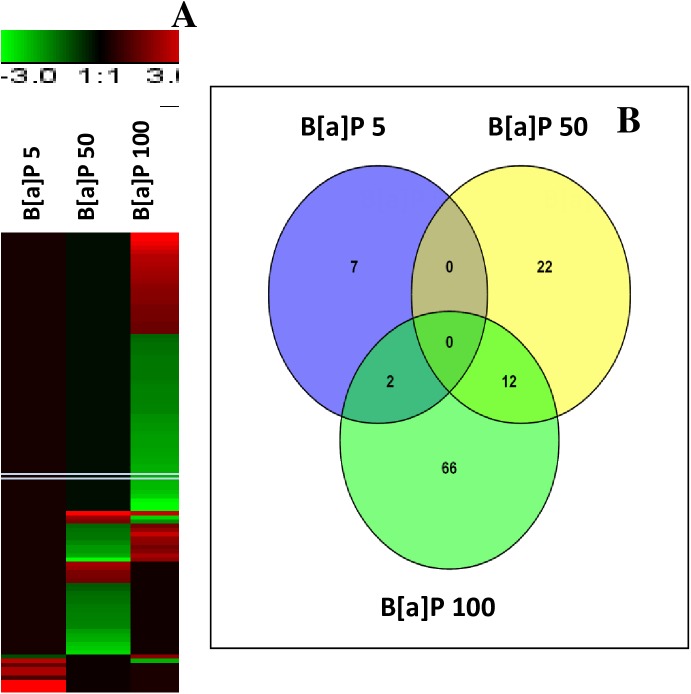
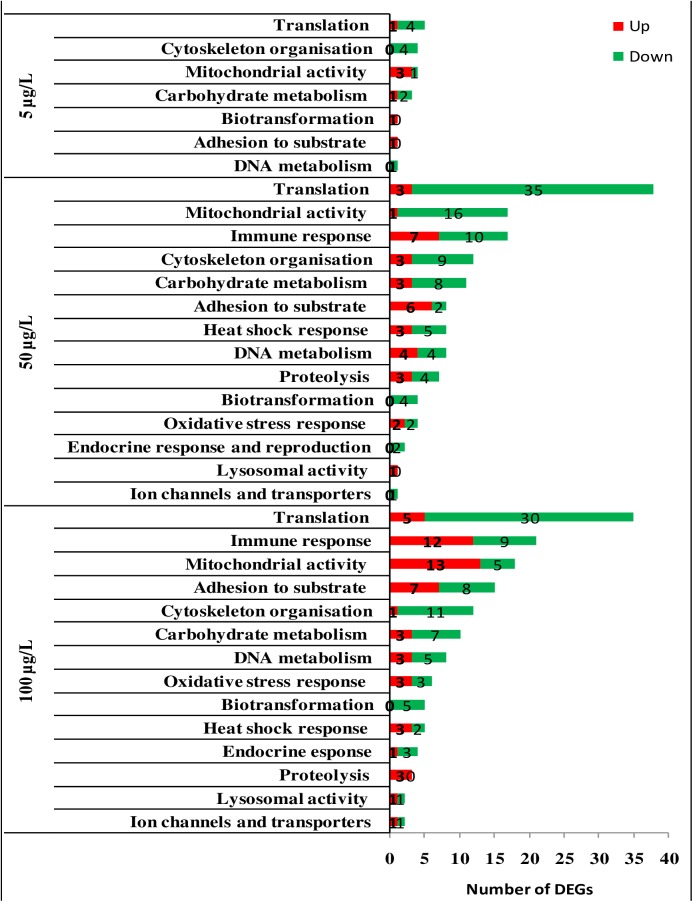
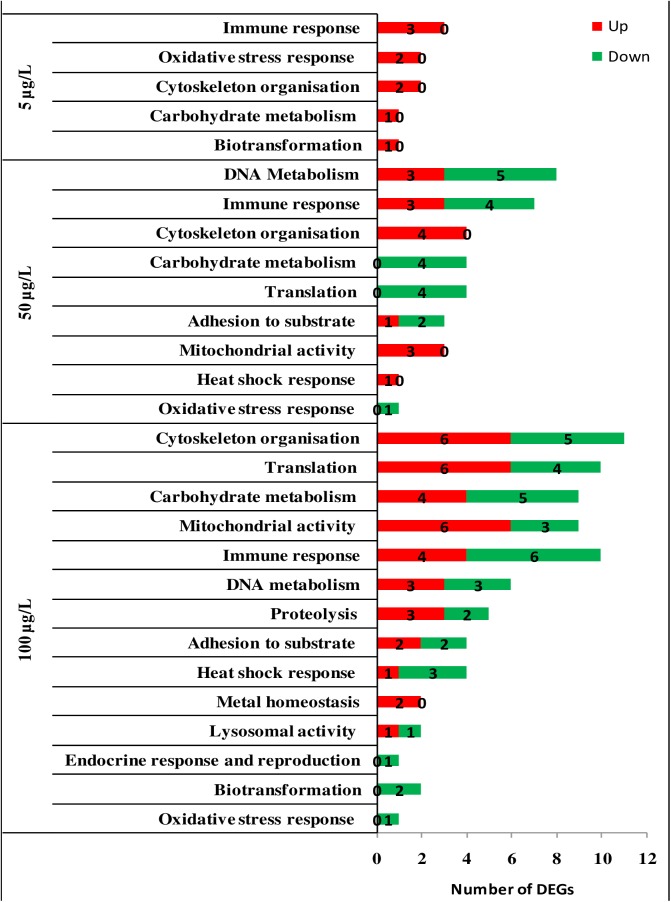
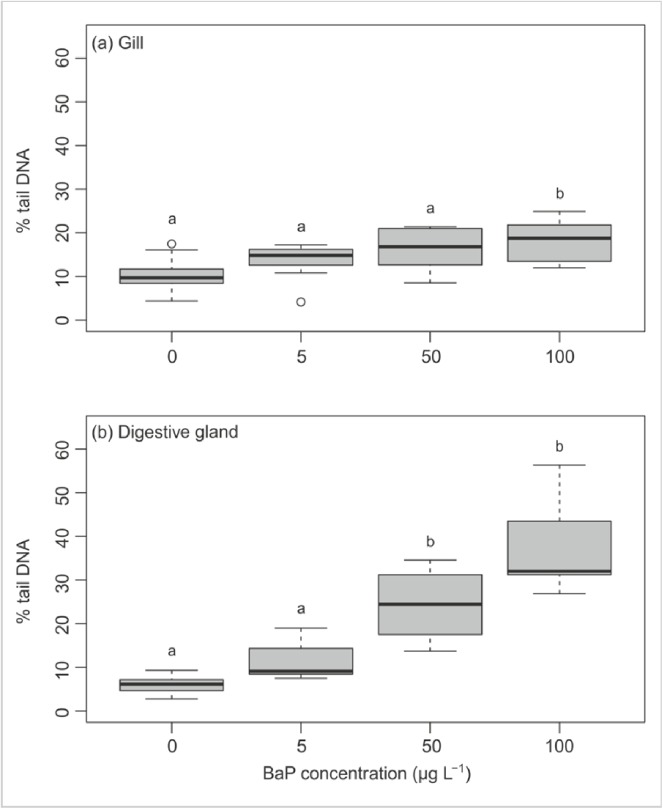
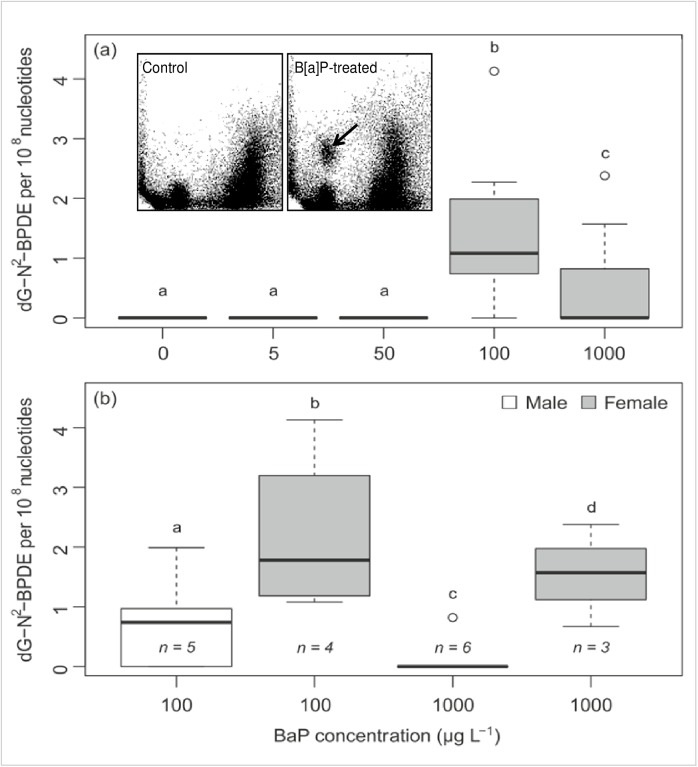
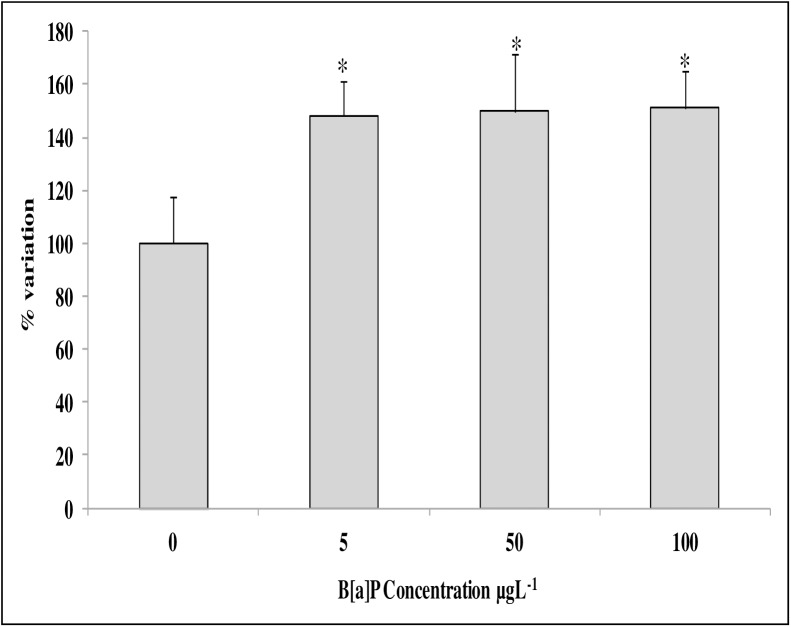
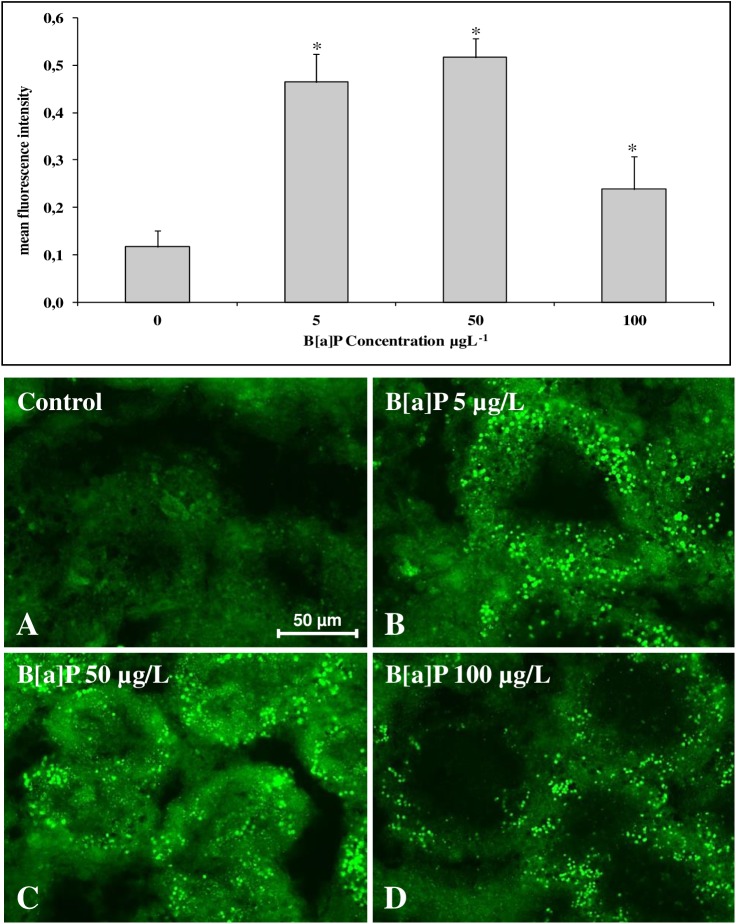
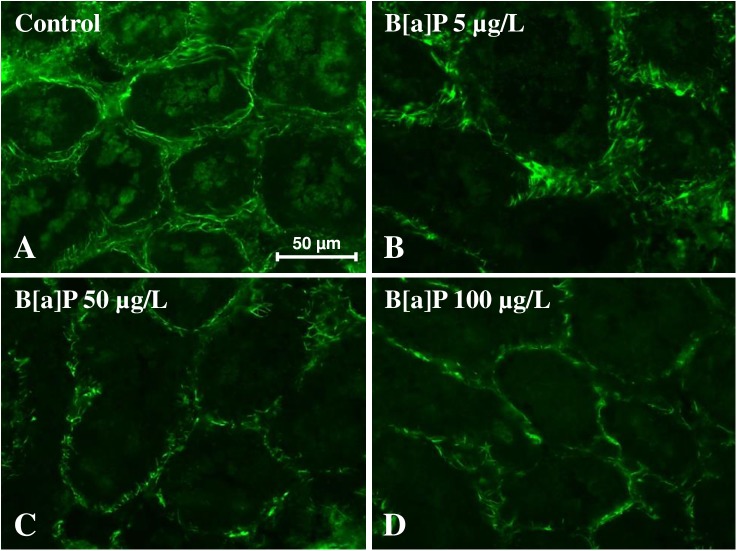
Despite the increasing use of mussels in environmental monitoring and ecotoxicological studies, their genomes and gene functions have not been thoroughly explored. Several cDNA microarrays were recently proposed for Mytilus spp., but putatively identified partial transcripts have rendered the generation of robust transcriptional responses difficult in terms of pathway identification. We developed a new low density oligonucleotide microarray with 465 probes covering the same number of genes. Target genes were selected to cover most of the well-known biological processes in the stress response documented over the last decade in bivalve species at the cellular and tissue levels. Our new 'STressREsponse Microarray' (STREM) platform consists of eight sub-arrays with three replicates for each target in each sub-array. To assess the potential use of the new array, we tested the effect of the ubiquitous environmental pollutant benzo[a]pyrene (B[a]P) at 5, 50, and 100 μg/L on two target tissues, the gills and digestive gland, of Mytilus galloprovincialis exposed invivo for three days. Bioaccumulation of B[a]P was also determined demonstrating exposure in both tissues. In addition to the well-known effects of B[a]P on DNA metabolism and oxidative stress, the new array data provided clues about the implication of other biological processes, such as cytoskeleton, immune response, adhesion to substrate, and mitochondrial activities. Transcriptional data were confirmed using qRT-PCR. We further investigated cellular functions and possible alterations related to biological processes highlighted by the microarray data using oxidative stress biomarkers (Lipofuscin content) and the assessment of genotoxicity. DNA damage, as measured by the alkaline comet assay, increased as a function of dose.DNA adducts measurements using 32P-postlabeling method also showed the presence of bulky DNA adducts (i.e. dG-N2-BPDE). Lipofiscin content increased significantly in B[a]P exposed mussels. Immunohistochemical analysis of tubulin and actin showed changes in cytoskeleton organisation. Our results adopting an integrated approach confirmed that the combination of newly developed transcriptomic approcah, classical biomarkers along with chemical analysis of water and tissue samples should be considered for environmental bioimonitoring and ecotoxicological studies to obtain holistic information to assess the impact of contaminants on the biota.
Conflict of interest statement
Figures
Similar articles
-
Integrated biological responses and tissue-specific expression of p53 and ras genes in marine mussels following exposure to benzo(α)pyrene and C60 fullerenes, either alone or in combination.Mutagenesis. 2017 Jan;32(1):77-90. doi: 10.1093/mutage/gew049. Epub 2016 Oct 10. Mutagenesis. 2017. PMID: 28011749
-
Application of a new targeted low density microarray and conventional biomarkers to evaluate the health status of marine mussels: A field study in Sardinian coast, Italy.Sci Total Environ. 2018 Jul 1;628-629:319-328. doi: 10.1016/j.scitotenv.2018.01.293. Epub 2018 Feb 13. Sci Total Environ. 2018. PMID: 29444484
-
Tissue differences, dose-response relationship and persistence of DNA adducts in blue mussels (Mytilus edulis L) exposed to benzo[a]pyrene.Aquat Toxicol. 2003 Jan 24;62(2):165-77. doi: 10.1016/s0166-445x(02)00102-9. Aquat Toxicol. 2003. PMID: 12505383
-
Shellfish and residual chemical contaminants: hazards, monitoring, and health risk assessment along French coasts.Rev Environ Contam Toxicol. 2011;213:55-111. doi: 10.1007/978-1-4419-9860-6_3. Rev Environ Contam Toxicol. 2011. PMID: 21541848 Review.
-
Adaptation of the human population to the environment: Current knowledge, clues from Czech cytogenetic and "omics" biomonitoring studies and possible mechanisms.Mutat Res Rev Mutat Res. 2017 Jul;773:188-203. doi: 10.1016/j.mrrev.2017.07.002. Epub 2017 Jul 12. Mutat Res Rev Mutat Res. 2017. PMID: 28927528 Review.
Cited by
-
Co-exposure to polystyrene plastic beads and polycyclic aromatic hydrocarbon contaminants in fish gill (RTgill-W1) and intestinal (RTgutGC) epithelial cells derived from rainbow trout (Oncorhynchus mykiss).Environ Pollut. 2019 May;248:706-714. doi: 10.1016/j.envpol.2019.02.066. Epub 2019 Feb 22. Environ Pollut. 2019. PMID: 30849588 Free PMC article.
-
Antagonistic Interactions between Benzo[a]pyrene and Fullerene (C60) in Toxicological Response of Marine Mussels.Nanomaterials (Basel). 2019 Jul 8;9(7):987. doi: 10.3390/nano9070987. Nanomaterials (Basel). 2019. PMID: 31288459 Free PMC article.
-
Biological and analytical techniques used for detection of polyaromatic hydrocarbons.Environ Sci Pollut Res Int. 2017 Nov;24(33):25810-25827. doi: 10.1007/s11356-017-0415-2. Epub 2017 Oct 14. Environ Sci Pollut Res Int. 2017. PMID: 29032529 Review.
-
Interactions of oxidative DNA damage and CYP1A gene expression with the liver enzymes in Klunzinger's mullet exposed to benzo[a]pyrene.Toxicol Rep. 2019 Oct 19;6:1097-1103. doi: 10.1016/j.toxrep.2019.10.013. eCollection 2019. Toxicol Rep. 2019. PMID: 31720230 Free PMC article.
-
Physiological and gene transcription assays to assess responses of mussels to environmental changes.PeerJ. 2019 Oct 4;7:e7800. doi: 10.7717/peerj.7800. eCollection 2019. PeerJ. 2019. PMID: 31592166 Free PMC article.
References
-
- Tanguy A, Bierne N, Saavedra Pina B, Bachère E et al. (2008) Increasing genomic information in bivalves through new EST collections in four species: development of new genetic markers for environmental studies and genome evolution. Gene 31;408(1–2):27–36. doi: 10.1016/j.gene.2007.10.021 - DOI - PubMed
-
- Lockwood BL, Sanders JG, Somero GN (2010) Transcriptomic responses to heat stress in invasive and native blue mussels (genus Mytilus): molecular correlates of invasive success. J Exp Biol 213: 3548–58. doi: 10.1242/jeb.046094 - DOI - PubMed
-
- Canesi L, Negri A, Barmo C, Banni M, Gallo G et al. (2011) The organophosphate chlorpyrifos interferes with the responses to 17b-estradiol in the digestive gland of the marine mussel Mytilusgalloprovinciali. PLos One 6 (5),e19803 doi: 10.1371/journal.pone.0019803 - DOI - PMC - PubMed
-
- Negri A, Oliveri C, Sforzini S, Mignione F, Viarengo A et al. (2013) Transcriptional response of the mussel Mytilusgalloprovincialis (Lam.) following exposure to heat stress and copper. PLoS One. 2013; 8(6), e66802 doi: 10.1371/journal.pone.0066802 - DOI - PMC - PubMed
MeSH terms
Substances
Grants and funding
LinkOut - more resources
Full Text Sources
Other Literature Sources
Molecular Biology Databases
Miscellaneous
