Human Adolescent Phase Response Curves to Bright White Light
- PMID: 28651468
- PMCID: PMC5972384
- DOI: 10.1177/0748730417713423
Human Adolescent Phase Response Curves to Bright White Light
Abstract
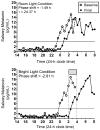
Older adolescents are particularly vulnerable to circadian misalignment and sleep restriction, primarily due to early school start times. Light can shift the circadian system and could help attenuate circadian misalignment; however, a phase response curve (PRC) to determine the optimal time for receiving light and avoiding light is not available for adolescents. We constructed light PRCs for late pubertal to postpubertal adolescents aged 14 to 17 years. Participants completed 2 counterbalanced 5-day laboratory sessions after 8 or 9 days of scheduled sleep at home. Each session included phase assessments to measure the dim light melatonin onset (DLMO) before and after 3 days of free-running through an ultradian light-dark (wake-sleep) cycle (2 h dim [~20 lux] light, 2 h dark). In one session, intermittent bright white light (~5000 lux; four 20-min exposures) was alternated with 10 min of dim room light once per day for 3 consecutive days. The time of light varied among participants to cover the 24-h day. For each individual, the phase shift to bright light was corrected for the free-run derived from the other laboratory session with no bright light. One PRC showed phase shifts in response to light start time relative to the DLMO and another relative to home sleep. Phase delay shifts occurred around the hours corresponding to home bedtime. Phase advances occurred during the hours surrounding wake time and later in the afternoon. The transition from delays to advances occurred at the midpoint of home sleep. The adolescent PRCs presented here provide a valuable tool to time bright light in adolescents.
Keywords: adolescent; bright light; circadian; phase response curve; phase shift; school start time; sleep.
Figures


Similar articles
-
Phase advancing human circadian rhythms with morning bright light, afternoon melatonin, and gradually shifted sleep: can we reduce morning bright-light duration?Sleep Med. 2015 Feb;16(2):288-97. doi: 10.1016/j.sleep.2014.12.004. Epub 2014 Dec 18. Sleep Med. 2015. PMID: 25620199 Free PMC article.
-
Human phase response curves to three days of daily melatonin: 0.5 mg versus 3.0 mg.J Clin Endocrinol Metab. 2010 Jul;95(7):3325-31. doi: 10.1210/jc.2009-2590. Epub 2010 Apr 21. J Clin Endocrinol Metab. 2010. PMID: 20410229 Free PMC article.
-
Combinations of bright light, scheduled dark, sunglasses, and melatonin to facilitate circadian entrainment to night shift work.J Biol Rhythms. 2003 Dec;18(6):513-23. doi: 10.1177/0748730403258422. J Biol Rhythms. 2003. PMID: 14667152 Clinical Trial.
-
Melatonin marks circadian phase position and resets the endogenous circadian pacemaker in humans.Ciba Found Symp. 1995;183:303-17; discussion 317-21. doi: 10.1002/9780470514597.ch15. Ciba Found Symp. 1995. PMID: 7656692 Review.
-
Dim light melatonin onset (DLMO): a tool for the analysis of circadian phase in human sleep and chronobiological disorders.Prog Neuropsychopharmacol Biol Psychiatry. 2007 Jan 30;31(1):1-11. doi: 10.1016/j.pnpbp.2006.06.020. Epub 2006 Aug 1. Prog Neuropsychopharmacol Biol Psychiatry. 2007. PMID: 16884842 Review.
Cited by
-
Habitual light exposure relative to circadian timing in delayed sleep-wake phase disorder.Sleep. 2018 Nov 1;41(11):zsy166. doi: 10.1093/sleep/zsy166. Sleep. 2018. PMID: 30423177 Free PMC article.
-
Correlation Analysis Between Time Awareness and Morningness-Eveningness Preference.J Circadian Rhythms. 2023 Oct 11;21:2. doi: 10.5334/jcr.225. eCollection 2023. J Circadian Rhythms. 2023. PMID: 37842163 Free PMC article.
-
Bright light therapy and early morning attention, mathematical performance, electroencephalography and brain connectivity in adolescents with morning sleepiness.PLoS One. 2023 Aug 22;18(8):e0273269. doi: 10.1371/journal.pone.0273269. eCollection 2023. PLoS One. 2023. PMID: 37607203 Free PMC article.
-
The effects of dynamic daylight-like light on the rhythm, cognition, and mood of irregular shift workers in closed environment.Sci Rep. 2021 Jun 22;11(1):13059. doi: 10.1038/s41598-021-92438-y. Sci Rep. 2021. PMID: 34158564 Free PMC article. Clinical Trial.
-
Circadian disruption and human health.J Clin Invest. 2021 Oct 1;131(19):e148286. doi: 10.1172/JCI148286. J Clin Invest. 2021. PMID: 34596053 Free PMC article. Review.
References
-
- Agostini A, Carskadon MA, Dorrian J, Coussens S, Short MA. An experimental study of adolescent sleep restriction during a simulated school week: changes in phase, sleep staging, performance and sleepiness. J Sleep Res. 2017;26:227–235. - PubMed
Publication types
MeSH terms
Substances
Grants and funding
LinkOut - more resources
Full Text Sources
Other Literature Sources

