. 2017 Jun 26;16(1):110.
doi: 10.1186/s12943-017-0677-9.

Linc00152 promotes malignant progression of glioma stem cells by regulating miR-103a-3p/FEZF1/CDC25A pathway

Affiliations

Linc00152 promotes malignant progression of glioma stem cells by regulating miR-103a-3p/FEZF1/CDC25A pathway

Mingjun Yu et al. Mol Cancer. .

Retraction in

Abstract

Background: Glioma is one of the most frequent intracranial malignant tumors. LncRNAs have been identified as new modulators in the origination and progression of glioma.

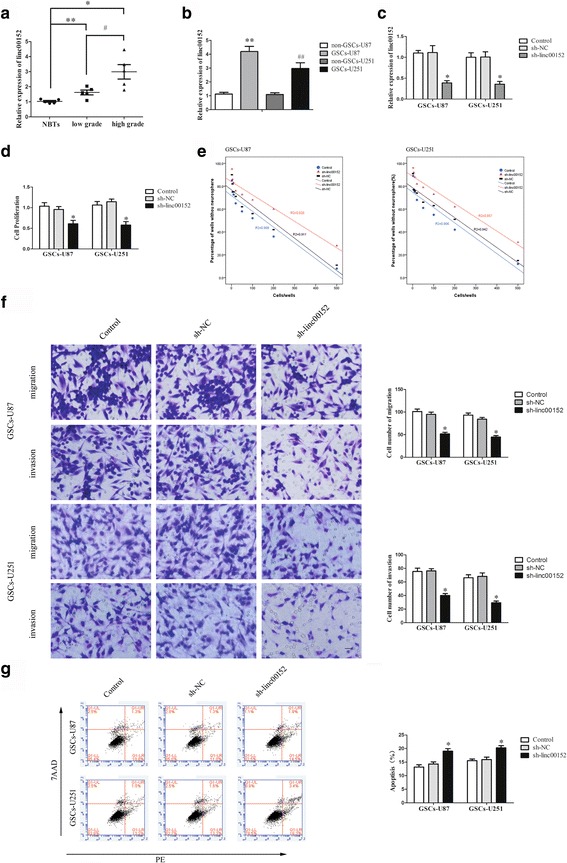
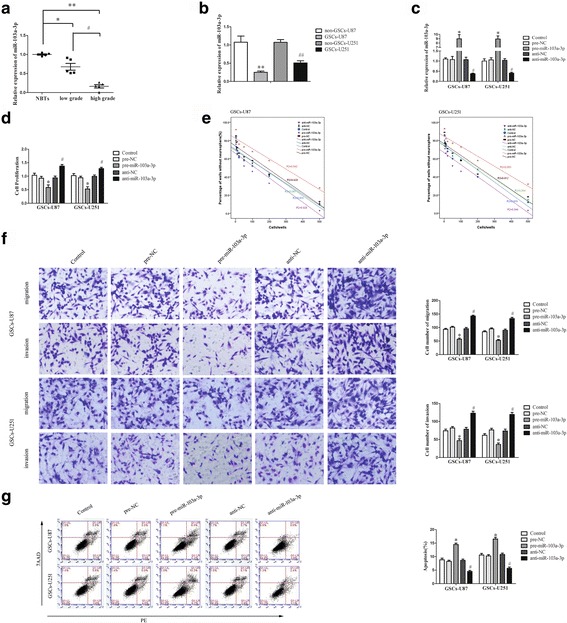
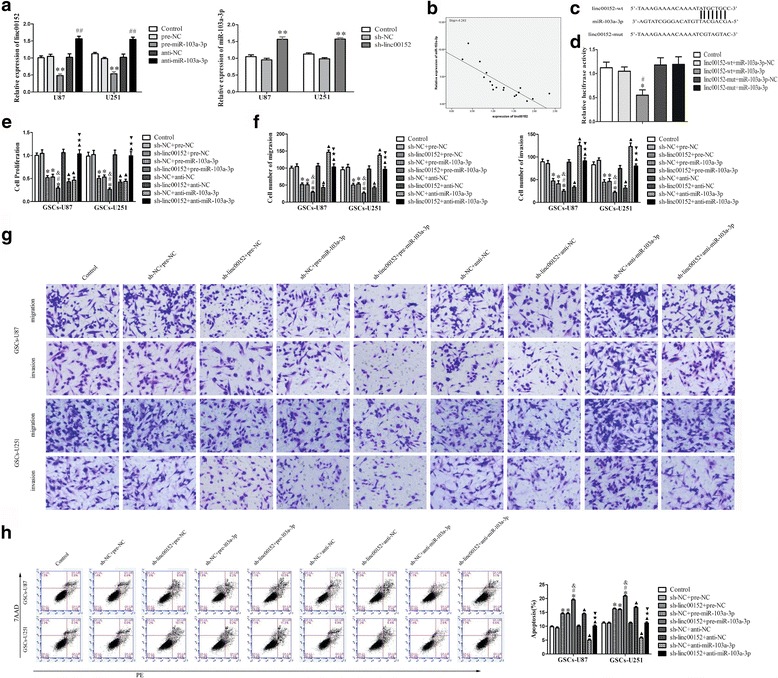
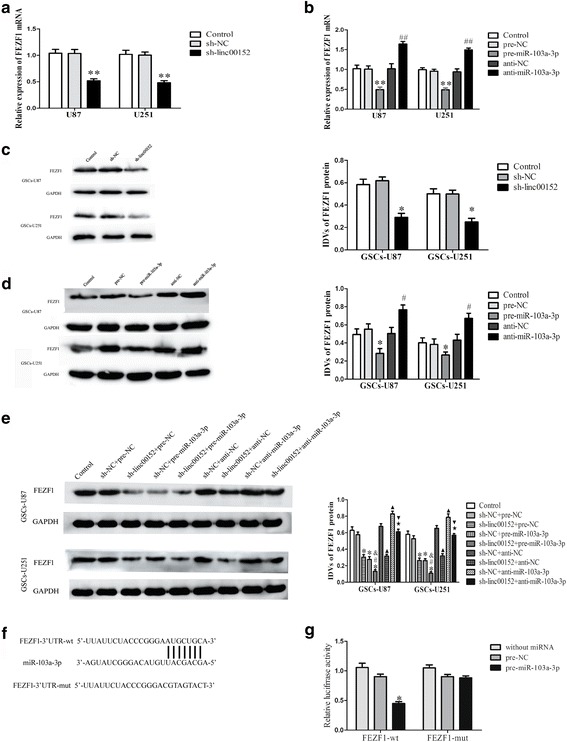
Methods: Quantitative real-time PCR were conducted to evaluate the expression of linc00152 and miRNA-103a-3p in glioma tissues and cells. Western blot were used to determine the expression of FEZF1 and CDC25A in glioma tissues and cells. Stable knockdown of linc00152 or over-expression of miR-103a-3p in glioma stem cells (GSCs) were established to explore the function of linc00152 and miR-103a-3p in GSCs. Further, luciferase reports were used to investigate the correlation between linc00152 and miR-103a-3p. Cell Counting Kit-8, transwell assays, and flow cytometry were used to investigate the function of linc00152 and miR-103a-3p in GSC malignant biological behaviors. ChIP assays were employed to ascertain the correlations between FEZF1 and CDC25A.

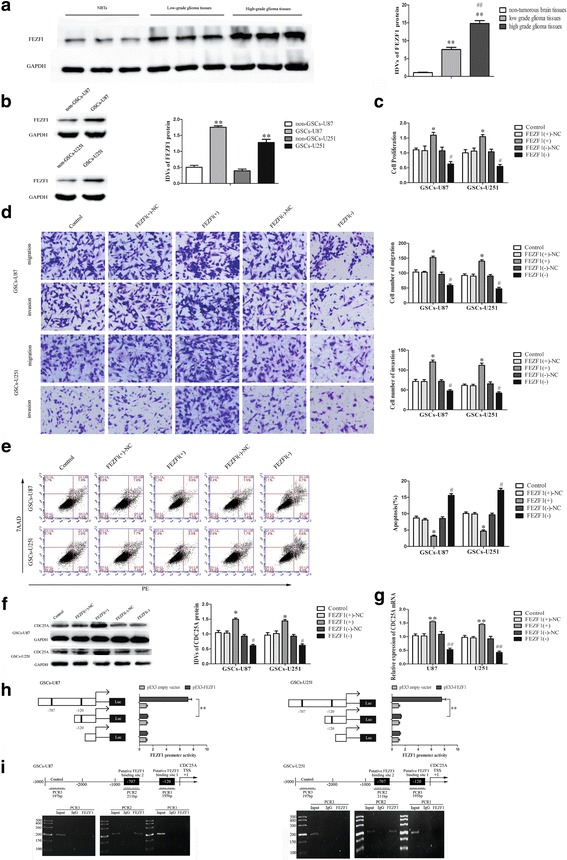
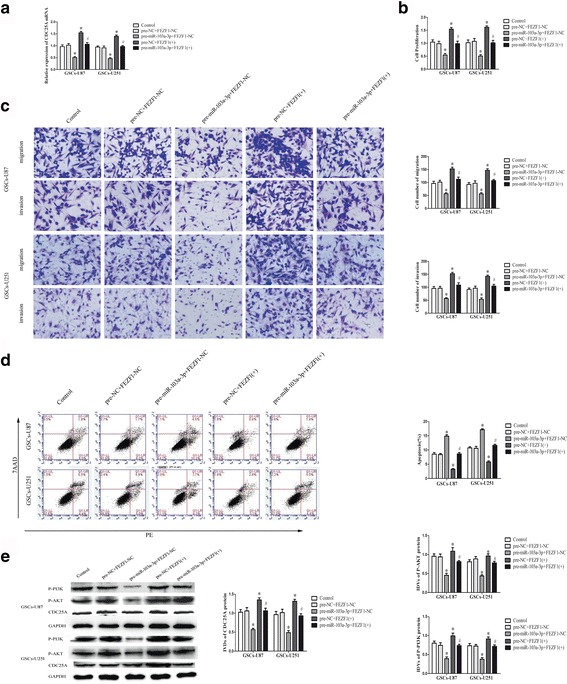
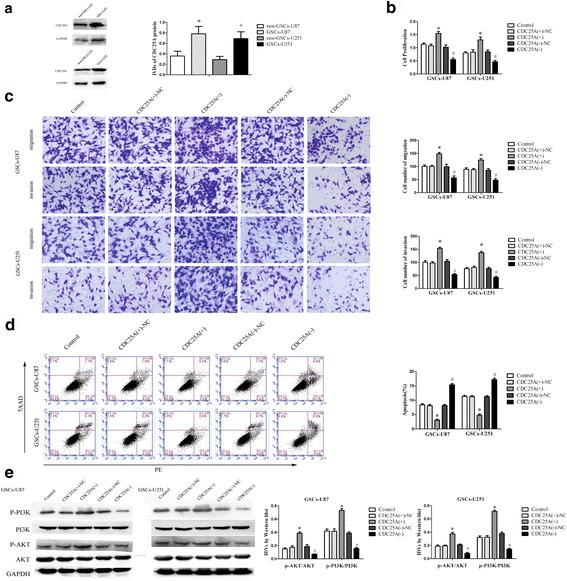
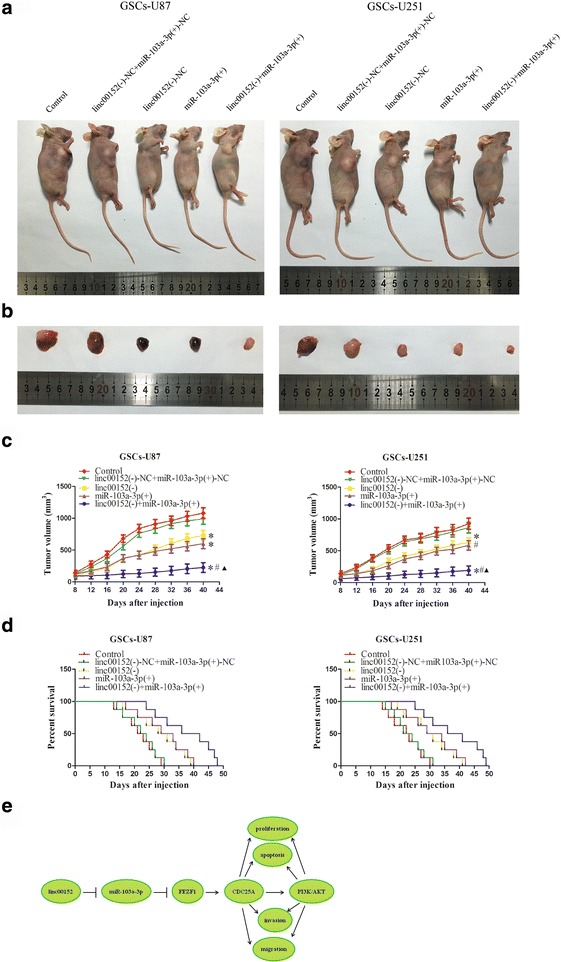
Results: Linc00152 was up-regulated in glioma tissues as well as in GSCs. Knockdown of linc00152 inhibited cell proliferation, migration and invasion, while promoted GSC apoptosis. Linc00152 regulated the malignant behavior of GSCs by binding to miR-103a-3p, which functions as a tumor suppressor. In addition, knockdown of linc00152 down-regulated forebrain embryonic zinc finger protein 1 (FEZF1), a direct target of miR-103a-3p which played an oncogenic role in GSCs. FEZF1 elevated promoter activities and up-regulated expression of the oncogenic gene cell division cycle 25A (CDC25A). CDC25A over-expression activated the PI3K/AKT pathways, which regulated the malignant behavior of GSCs.

Conclusions: Linc00152/miR-103a-3p/FEZF1/CDC25A axis plays a novel role in regulating the malignant behavior of GSCs, which may be a new potential therapeutic strategy for glioma therapy.

Keywords: CDC25A; FEZF1; Glioma stem cells; Long non-coding RNA; linc00152; miR-103a-3p.


Figures

Fig. 1
Fig. 1
linc00152 functioned as an oncogene in GSCs. a Expression of linc00152 in glioma tissues of different grades and normal brain tissues (NBTs). (Data are presented as the mean ± SD (n = 10, each group). **P < 0.01 vs. NBTs group; *P < 0.05 vs. low grade group; # P < 0.05 vs. low grade group. b Expression of linc00152 in non-GSCs and GSCs (Data are presented as the mean ± SD (n = 5, each group). **P < 0.01 vs. non-GSCs-U87 group; ## P < 0.01 vs. non-GSCs-U251 group. c Relative expression of linc00152 after GSCs transfected with sh-linc00152 plasmids and scrambled vectors (NC). d CCK-8 assay was conducted to explore the proliferation effect of linc00152 on GSCs. e Limiting dilution assay showing the impact of linc00152 on the sphere-formation ability of GSCs. f Transwell assays for assessing GSC migration and invasion. Typical images and accompanying statistical plots were presented. g Flow cytometry detected the apoptosis of GSCs with the knockdown of linc00152. Data are presented as the mean ± SD (n = 5, each group). *P < 0.05 vs. sh-NC group. Scale bars represent 20 μm. The photographs were taken at 200 × magnification
Fig. 2
Fig. 2
miR-103a-3p manifested an anti-oncogene in GSCs. a Expression of miR-103a-3p in glioma tissues of different grades and NBTs (Data are presented as the mean ± SD (n = 10, each group). **P < 0.01 vs. NBTs group; *P < 0.05 vs. NBTs group; # P < 0.05 vs. low grade group. b Expression of miR-103a-3p in non-GSCs and GSCs (Data are presented as the mean ± SD (n = 5, each group). **P < 0.01 vs. non-GSCs-U87 group; ## P < 0.01 vs. non-GSCs-U251 group. c Relative expression of miR-103a-3p after GSCs transfected with pre-miR-103a-3p, anti-miR-103a-3p as well as their scrambled vectors (NC). d Effect of miR-103a-3p on the proliferation of GSCs. e Effect of miR-103a-3p on the sphere-formation ability of GSCs. f Effect of miR-103a-3p on the migration and invasion of GSCs. g The apoptotic rates after GSCs transfected with pre-miR-103a-3p and anti-miR-103a-3p. *P < 0.05 vs. pre-NC group; # P < 0.05 vs. anti-NC group. Scale bars, 20 μm. The photographs were taken at 200 × magnification
Fig. 3
Fig. 3
Reciprocal restrain between miR-103a-3p and linc00152, down-regulated of linc00152 hindered the malignant behavior of GSCs by target miR-103a-3p. a qRT-PCR analysis revealed the negative correlation between miR-103a-3p and linc00152 expression in glioma cells. **P < 0.01 vs. pre-NC group; ## P < 0.01 vs. anti-NC group; **P < 0.01 vs. sh-NC group. b Linear regression analysis was done to each individual linc00152 and miR-103a-3p expression, the slope was −4.243, **P < 0.01. c Schematic representation of the putative binding site for linc00152 and miR-103a-3p, and the contrivable mutant sequence indicated for the reporter assay. d The relative luciferase activities were restrained in the HEK-293 T cells co-transfected with vector linc00152-wt and miR-103a-3p. *P < 0.05. vs. linc00152-wt + miR-103a-3p-NC group; # P < 0.05. vs. linc00152-mut + miR-103a-3p-NC group. e The CCK-8 assay was conducted to evaluate the effects of linc00152 and miR-103a-3p on the proliferation of GSCs. f-g The capacities of migration and invasion were detected through transwell assays on GSCs. h Flow cytometry analysis of GSCs in groups according to linc00152 and miR-103a-3p expression. *P < 0.05 vs. sh-NC + pre-NC group; # P < 0.05 vs. sh-linc00152 + pre-NC groups;& P < 0.05 vs. sh-NC + pre-miR-103a-3p group; P < 0.05 vs. sh-NC + anti-NC group; P < 0.05 vs. sh-linc00152 + anti-NC group; P < 0.05 vs. sh-NC + anti-miR-103a -3p group. Scale bars, 20 μm. For a, c, d, e and g, data are presented as the mean ± SD (n = 5, each group)
Fig. 4
Fig. 4
FEZF1 was a target gene of miR-103a-3p, the expression of FEZF1 was regulated by both linc00152 and miR-103a-3p. a qRT-PCR analysis of the effect of linc00152 on FEZF1 mRNA expression in glioma cells. **P < 0.01 vs. sh-NC group. b qRT-PCR analysis of the effect of miR-103a-3p on FEZF1 mRNA expression in glioma cells. **P < 0.01 vs. pre-NC group; ## P < 0.01 vs. anti-NC group. c Western blot analysis on FEZF1 in linc00152-knockdown GSCs, with GAPDH as an endogenous control. *P < 0.05 vs. sh-NC group. d Western blot analysis for expression between miR-103a-3p and FEZF1 in GSCs, with GAPDH as an endogenous control. *P < 0.05 vs. pre-NC group; # P < 0.05 vs. anti-NC group. e Western blot analysis for FEZF1 in GSCs co-transfected with sh-linc00152 and pre-miR-103a-3p or anti-miR-103a-3p, with GAPDH as an endogenous control. *P < 0.05 vs. sh-NC+ pre-NC group. # P < 0.05 vs. sh-linc00152 + pre-NC group; & P < 0.05 vs. sh-NC + pre-miR-103a-3p group; P < 0.05 vs. sh-NC + anti-NC group; P < 0.05 vs. sh-linc00152 + anti-NC group; P < 0.05 vs. sh-NC + anti-miR-103a -3p group. For a-e, data are presented as the mean ± SD (n = 5, each group). f Schematic representation of the putative binding site for miR-103a-3p and FEZF1, and the contrivable mutant sequence for the reporter assay. g The relative luciferase activities were hindered in the HEK-293 T cells co-transfected with vector pre-miR-103a-3p and FEZF1-wt. *P < 0.05. vs. FEZF1-wt + pre-NC group
Fig. 5
Fig. 5
FEZF1 was up-regulated in glioma tissues, and played an oncogenic role in GSCs. a FEZF1 protein expression in non-tumorous brain tissues, low-grade glioma tissues (WHO I-II), and high-grade glioma tissues (WHO III-IV), with GAPDH as an endogenous control. Data are presented as the mean ± SD (n = 10, each group). **P or ## P < 0.01 vs. non-tumorous brain tissue group. b Western blot analysis of FEZF1 expression in non-GSCs and GSCs, with GAPDH as an endogenous control. **P < 0.01 vs. non-GSC group. c CCK8 assay was performed to evaluate the effect of FEZF1 on the proliferation of GSCs. d Quantification of GSC migration and invasion upon FEZF1 over-expression or down-regulation. Representative images and accompanying statistical plots are presented. e Flow cytometry analysis of the effects of FEZF1 on GSCs. Data are presented as the mean ± SD (n = 5, each group). *P < 0.05 vs. FEZF1 (+)-NC group; # P < 0.05 vs. FEZF1(−)-NC group. Scale bars, 20 μm. The photographs were taken at 200 × magnification. f Effect of FEZF1 on the CDC25A protein expression, with GAPDH as an endogenous control. Data are presented as the mean ± SD (n = 5, each group). *P < 0.05 vs. FEZF1(+)-NC group, # P < 0.05 vs. FEZF1(+)-NC group. g Effect of FEZF1 on the CDC25A mRNA expression. Data are presented as the mean ± SD (n = 5, each group). *P < 0.05 vs. FEZF1(+)-NC group, # P < 0.05 vs. FEZF1(+)-NC group. h Schematic depiction of the CDC25A reporter constructs used and the luciferase activity. The Y-bar shows the position of the deletions on the DNA fragments. X-bar shows the constructed plasmid activity after normalization with the co-transfected reference vector (pRL-TK), and relative to the activity of pEX3 empty vector,which the activity was set to 1. Data representmeans ± SD (n = 5, each). i Schematic representation of the CDC25A promoter region 3000 bp upstream of the transcription start site (TSS) which designated as +1. ChIP PCR products for putative binding sites and an upstream region not expected to associate with FEZF1 are depicted with bold lines. Immunoprecipitated DNA was amplified by PCR. Normal rabbit IgG was used as a negative control
Fig. 6
Fig. 6
miR-103a-3p inhibited malignant progression of GSCs by binding to the FEZF1 3′-UTR. a Effect of miR-103a-3p and FEZF1 co-transfection on the CDC25A mRNA expression. b The CCK-8 assay was used to assess the effects of miR-103a-3p and FEZF1 on GSC proliferation. c Transwell assay was employed to detect the effects of miR-103a-3p and FEZF1 on GSC migration and invasion. Representative images and accompanying statistical plots are presented. d Flow cytometry analysis of GSCs in groups according to miR-103a-3p and FEZF1(+) expression. e Effect of miR-103a-3p and FEZF1 co-transfection on the CDC25A, p-AKT and p-PI3K protein expression, with GAPDH as an endogenous control. *P < 0.05 vs. pre-NC + FEZF1 -NC group, # P < 0.05 vs. pre- miR-103a-3p + FEZF1-NC group. Scale bars, 20 μm. The photographs were taken at 200 × magnification. Data are presented as the mean ± SD (n = 5, each group)
Fig. 7
Fig. 7
CDC25A was up-regulated in GSCs, and played an oncogenic role in GSCs. a Western blot analysis of CDC25A expression in non-GSCs and GSCs, with GAPDH as an endogenous control. *P < 0.05 vs. non-GSCs-U87 group, # P < 0.05 vs. non-GSCs-U251 group. b CCK8 assay was performed to evaluate the effect of CDC25A on the proliferation of GSCs. c Quantification of GSC migration and invasion upon CDC25A overexpression or downregulation. Representative images and accompanying statistical plots are presented. d Flow cytometry analysis of the effects of CDC25A on GSCs. e Western blot analysis of the PI3K/AKT pathway regulated by CDC25A in GSCs. Data are presented as the mean ± SD (n = 5, each group). *P < 0.05 vs. CDC25A (+)-NC group; # P < 0.05 vs. CDC25A (−)-NC group. Scale bars, 20 μm. The photographs were taken at 200 × magnification
Fig. 8
Fig. 8
Tumor xenografts study of tumor growth and survival rates in nude mice. a The nude mice carrying tumors of respective groups were shown. b Sample tumors from respective group were shown. c Tumor growth curves of five groups in nude mice (n = 8). Tumor growth was monitored for up to 40 days. *P < 0.05 vs. linc00152(−)-NC + miR-103a-3p(+)-NC group, # P < 0.05 vs. linc00152(−) group, P < 0.05 vs. miR-103a-3p(+) group. d Survival curves of nude mice injected into the right striatum. Mice were monitored for up to 50 days (n = 8). e The schematic cartoon of the mechanism of linc00152 as an oncogene by regulating miR-103a-3p/FEZF1/CDC25A pathway in glioma stem cells

Similar articles

Cited by

References

    1. Zheng J, Liu X, Xue Y, Gong W, Ma J, Xi Z, et al. TTBK2 circular RNA promotes glioma malignancy by regulating miR-217/HNF1beta/Derlin-1 pathway. J Hematol Oncol. 2017;10:52. doi: 10.1186/s13045-017-0422-2. - DOI - PMC - PubMed
    1. Tso JL, Yang S, Menjivar JC, Yamada K, Zhang Y, Hong I, et al. Bone morphogenetic protein 7 sensitizes O6-methylguanine methyltransferase expressing-glioblastoma stem cells to clinically relevant dose of temozolomide. Mol Cancer. 2015;14:189. doi: 10.1186/s12943-015-0459-1. - DOI - PMC - PubMed
    1. Bao S, Wu Q, McLendon RE, Hao Y, Shi Q, Hjelmeland AB, et al. Glioma stem cells promote radioresistance by preferential activation of the DNA damage response. Nature. 2006;444:756–760. doi: 10.1038/nature05236. - DOI - PubMed
    1. Cheng P, Wang J, Waghmare I, Sartini S, Coviello V, Zhang Z, et al. FOXD1-ALDH1A3 signaling is a determinant for the self-renewal and Tumorigenicity of Mesenchymal Glioma stem cells. Cancer Res. 2016;76:7219–7230. doi: 10.1158/0008-5472.CAN-15-2860. - DOI - PMC - PubMed
    1. Zhang XQ, Leung GK. Long non-coding RNAs in glioma: functional roles and clinical perspectives. Neurochem Int. 2014;77:78–85. doi: 10.1016/j.neuint.2014.05.008. - DOI - PubMed

Publication types

MeSH terms