

Acute salinity tolerance and the control of two prolactins and their receptors in the Nile tilapia (Oreochromis niloticus) and Mozambique tilapia (O. mossambicus): A comparative study
- PMID: 28652133
- PMCID: PMC5742082
- DOI: 10.1016/j.ygcen.2017.06.018
Acute salinity tolerance and the control of two prolactins and their receptors in the Nile tilapia (Oreochromis niloticus) and Mozambique tilapia (O. mossambicus): A comparative study
Abstract
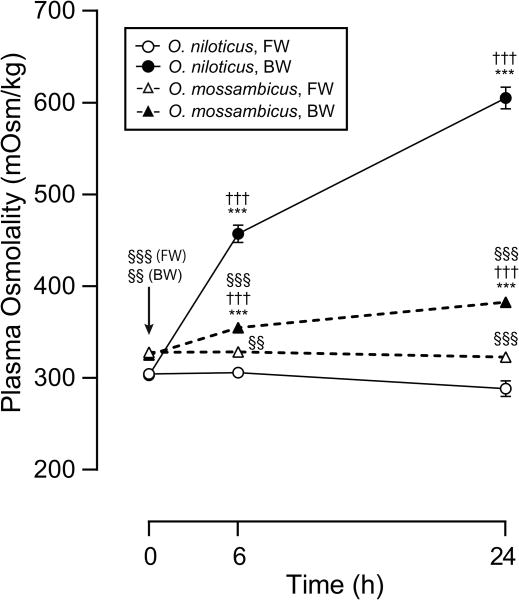
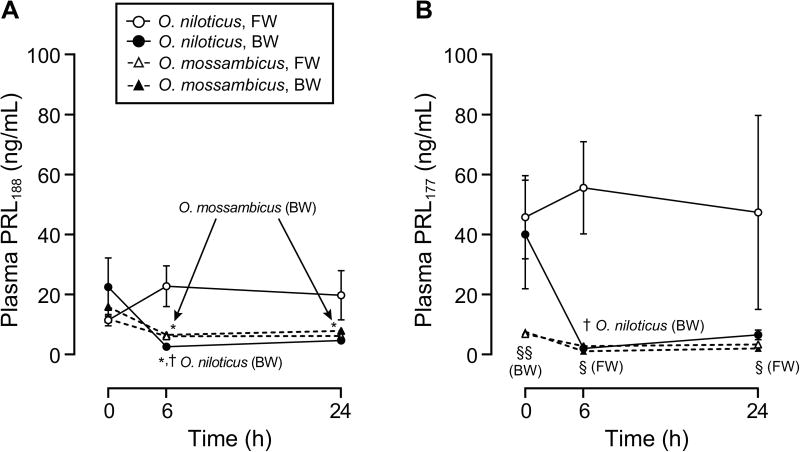
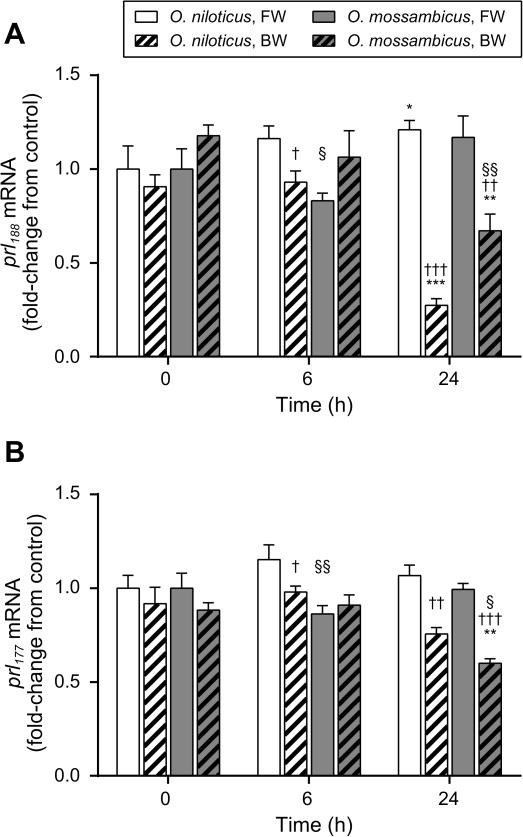
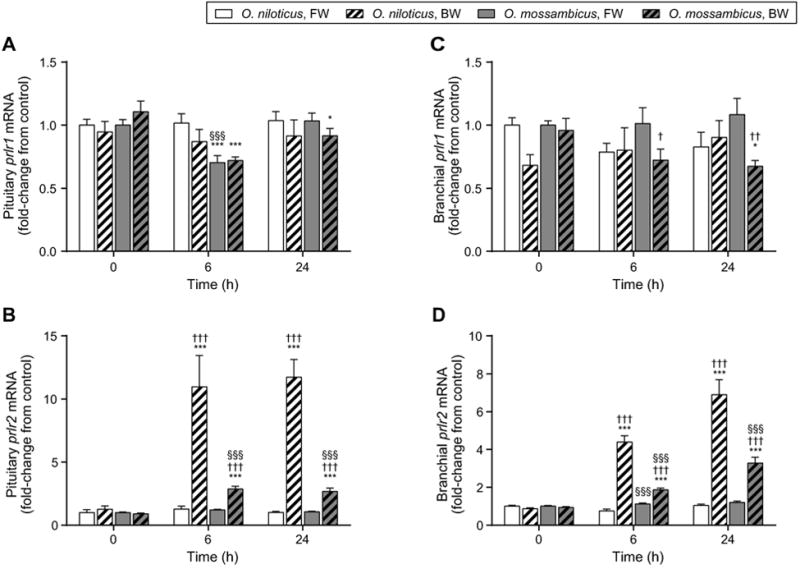
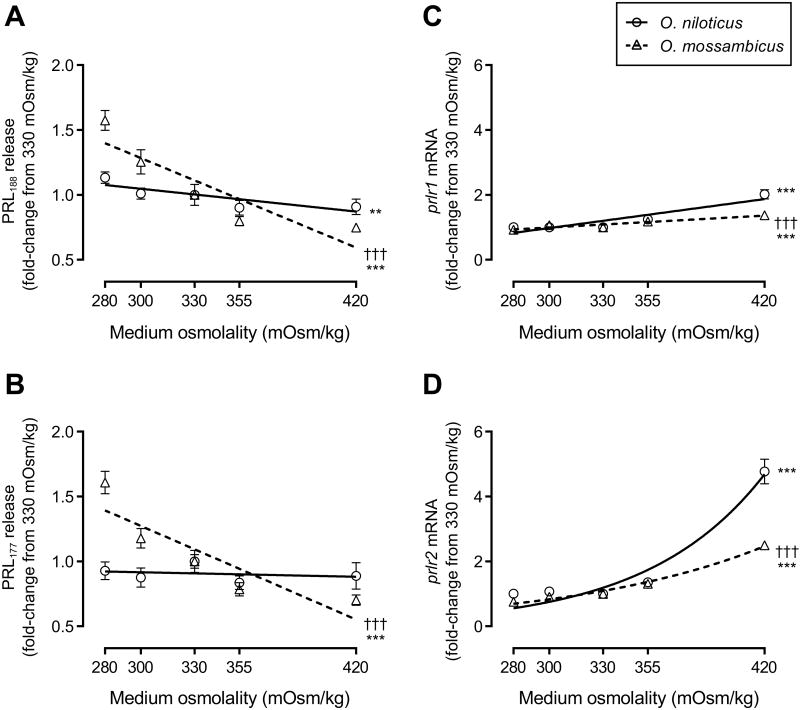
Osmoregulation in vertebrates is largely controlled by the neuroendocrine system. Prolactin (PRL) is critical for the survival of euryhaline teleosts in fresh water by promoting ion retention. In the euryhaline Mozambique tilapia (Oreochromis mossambicus), pituitary PRL cells release two PRL isoforms, PRL188 and PRL177, in response to a fall in extracellular osmolality. Both PRLs function via two PRL receptors (PRLRs) denoted PRLR1 and PRLR2. We conducted a comparative study using the Nile tilapia (O. niloticus), a close relative of Mozambique tilapia that is less tolerant to increases in environmental salinity, to investigate the regulation of PRLs and PRLRs upon acute hyperosmotic challenges in vivo and in vitro. We hypothesized that differences in the regulation of PRLs and PRLRs underlie the variation in salinity tolerance of tilapias within the genus Oreochromis. When transferred from fresh water to brackish water (20‰), Nile tilapia increased plasma osmolality and decreased circulating PRLs, especially PRL177, to a greater extent than Mozambique tilapia. In dispersed PRL cell incubations, the release of both PRLs was less sensitive to variations in medium osmolality in Nile tilapia than in Mozambique tilapia. By contrast, increases in pituitary and branchial prlr2 gene expression in response to a rise in extracellular osmolality were more pronounced in Nile tilapia relative to its congener, both in vitro and in vivo. Together, these results support the conclusion that inter-specific differences in salinity tolerance between the two tilapia congeners are tied, at least in part, to the distinct responses of both PRLs and their receptors to osmotic stimuli.
Keywords: Osmoregulation; Osmosensitivity; Prolactin; Salinity tolerance; Tilapia.
Copyright © 2017 Elsevier Inc. All rights reserved.
Figures
References
-
- Auperin B, Rentier-Delrue F, Martial JA, Prunet P. Evidence that two tilapia (Oreochromis niloticus) prolactins have different osmoregulatory functions during adaptation to a hyperosmotic environment. J Mol Endocrinol. 1994;12:13–24. - PubMed
-
- Ayson FG, Kaneko T, Tagawa M, Hasegawa S, Grau EG, Nishioka RS, King DS, Bern HA, Hirano T. Effects of acclimation to hypertonic environment on plasma and pituitary levels of two prolactins and growth hormone in two species of tilapia, Oreochromis mossambicus and Oreochromis niloticus. Gen Comp Endocrinol. 1993;89:138–148. - PubMed
-
- Borski RJ, Hansen MU, Nishioka RS, Grau EG. Differential processing of the two prolactins of the tilapia (Oreochromis mossambicus), in relation to environmental salinity. J Exp Zool. 1992;264:46–54.
-
- Breves JP, Fox BK, Pierce AL, Hirano T, Grau EG. Gene expression of growth hormone family and glucocorticoid receptors, osmosensors, and ion transporters in the gill during seawater acclimation of Mozambique tilapia, Oreochromis mossambicus. J Exp Zool. 2010a;313:432–441. - PubMed
-
- Breves JP, Hasegawa S, Yoshioka M, Fox BK, Davis LK, Lerner DT, Takei Y, Hirano T, Grau EG. Acute salinity challenges in Mozambique and Nile tilapia: differential responses of plasma prolactin, growth hormone and branchial expression of ion transporters. Gen Comp Endocrinol. 2010b;167:135–142. - PubMed
Publication types
MeSH terms
Substances
Grants and funding
LinkOut - more resources
Full Text Sources
Other Literature Sources
