. 2017 Aug;174(4):2376-2396.
doi: 10.1104/pp.17.00311. Epub 2017 Jun 26.

Ripening Transcriptomic Program in Red and White Grapevine Varieties Correlates with Berry Skin Anthocyanin Accumulation

Affiliations

Ripening Transcriptomic Program in Red and White Grapevine Varieties Correlates with Berry Skin Anthocyanin Accumulation

Mélanie Massonnet et al. Plant Physiol. 2017 Aug.

Abstract

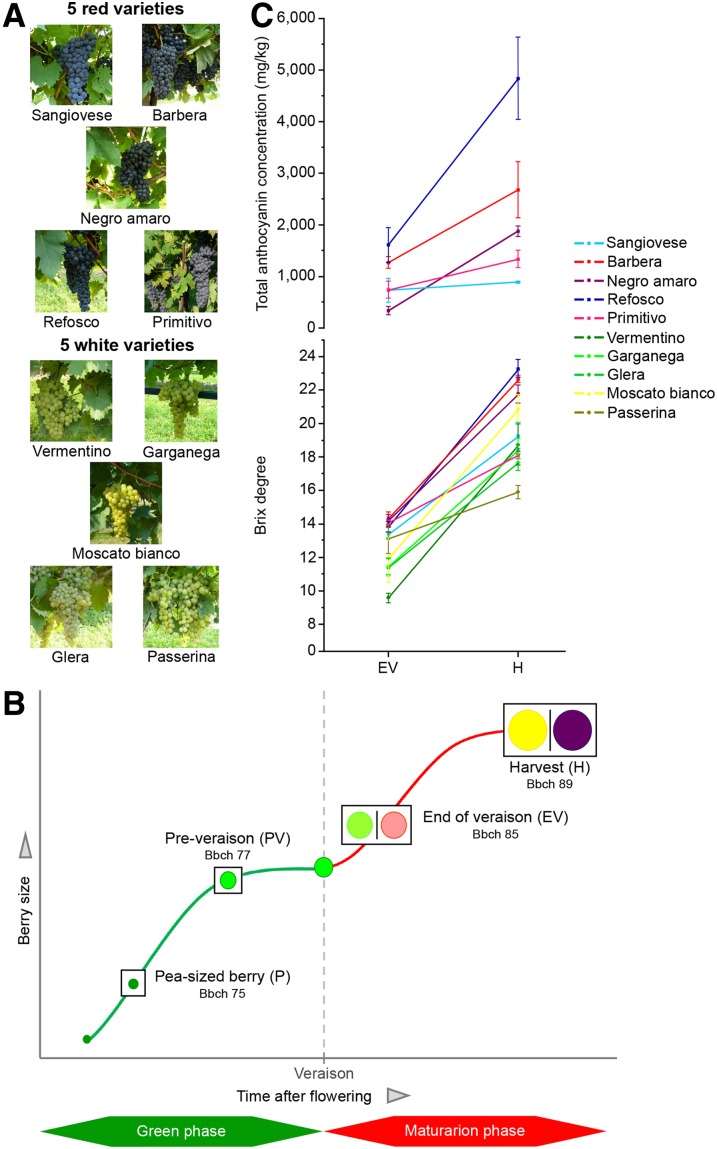
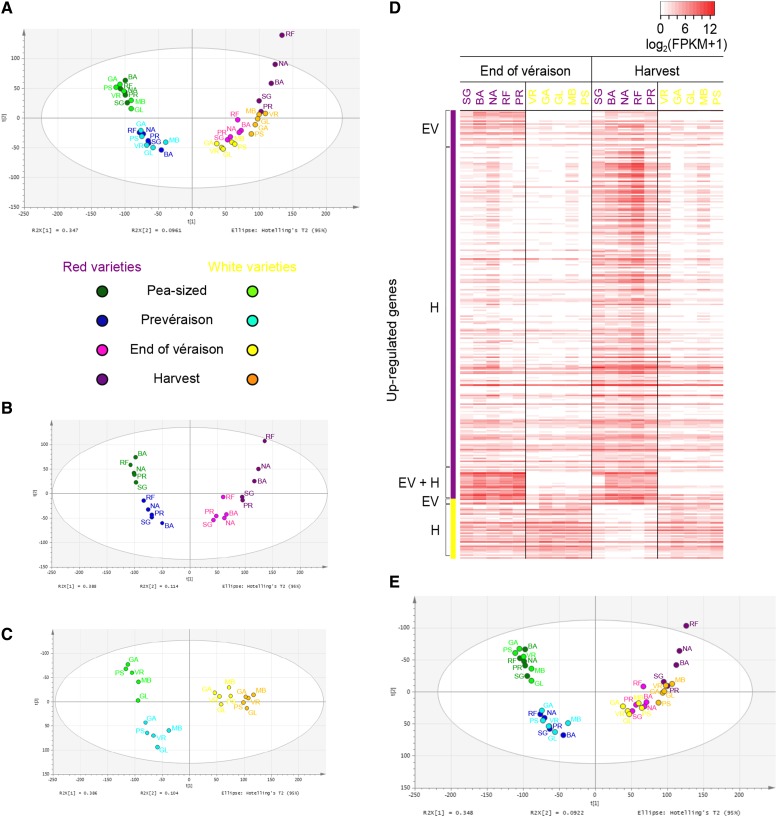
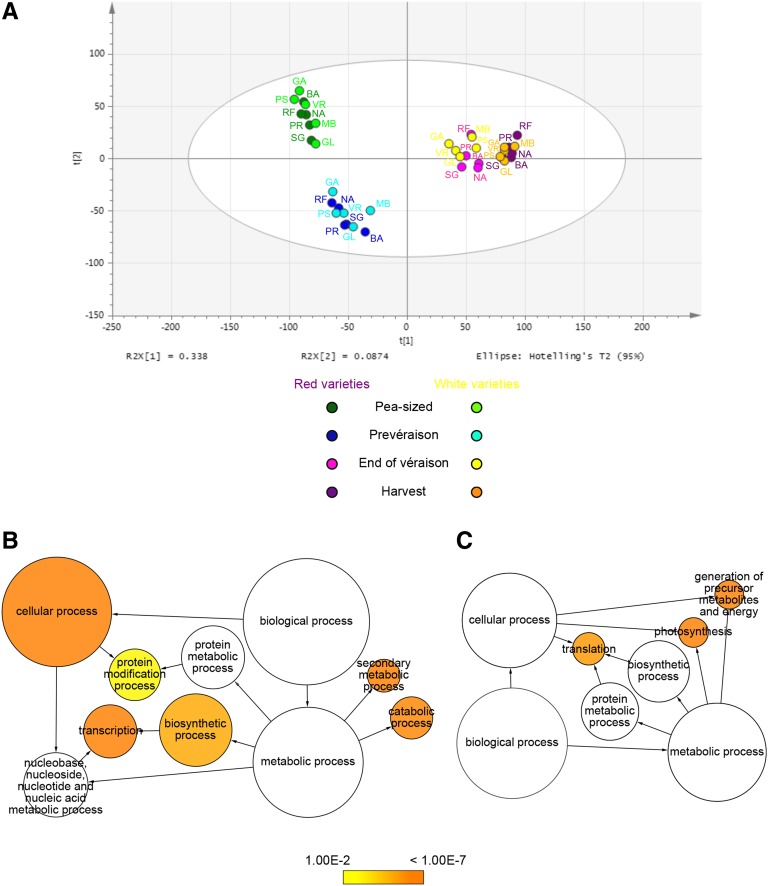
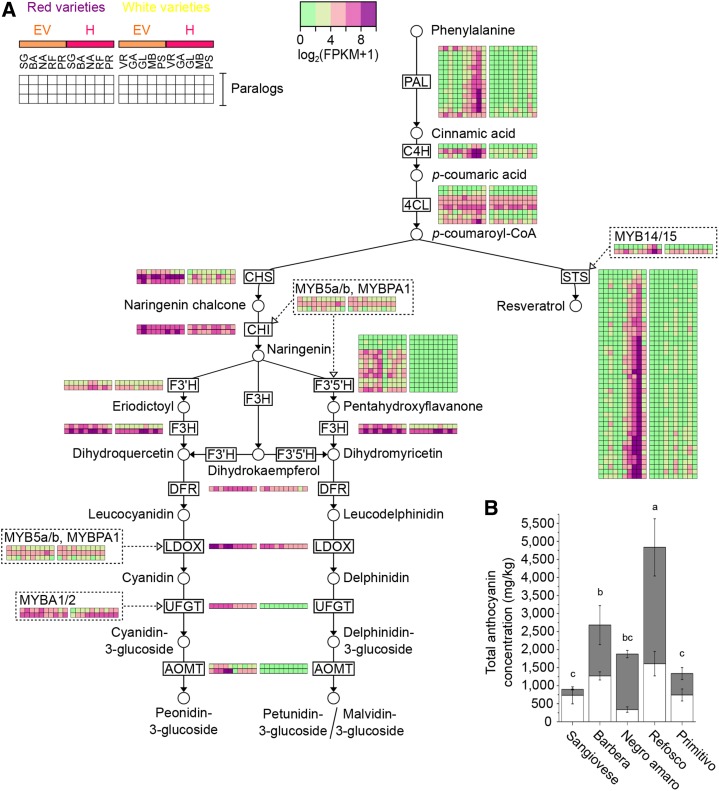
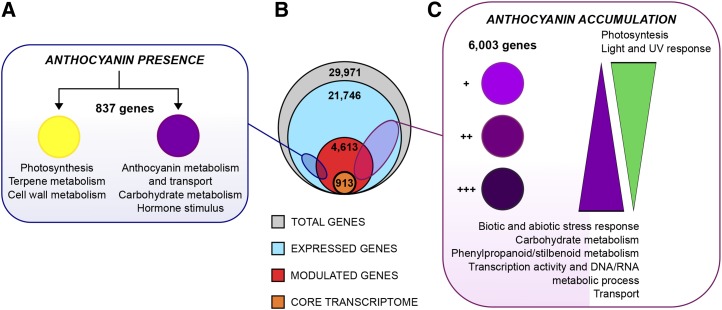
Grapevine (Vitis vinifera) berry development involves a succession of physiological and biochemical changes reflecting the transcriptional modulation of thousands of genes. Although recent studies have investigated the dynamic transcriptome during berry development, most have focused on a single grapevine variety, so there is a lack of comparative data representing different cultivars. Here, we report, to our knowledge, the first genome-wide transcriptional analysis of 120 RNA samples corresponding to 10 Italian grapevine varieties collected at four growth stages. The 10 varieties, representing five red-skinned and five white-skinned berries, were all cultivated in the same experimental vineyard to reduce environmental variability. The comparison of transcriptional changes during berry formation and ripening allowed us to determine the transcriptomic traits common to all varieties, thus defining the core transcriptome of berry development, as well as the transcriptional dynamics underlying differences between red and white berry varieties. A greater variation among the red cultivars than between red and white cultivars at the transcriptome level was revealed, suggesting that anthocyanin accumulation during berry maturation has a direct impact on the transcriptomic regulation of multiple biological processes. The expression of genes related to phenylpropanoid/flavonoid biosynthesis clearly distinguished the behavior of red and white berry genotypes during ripening but also reflected the differential accumulation of anthocyanins in the red berries, indicating some form of cross talk between the activation of stilbene biosynthesis and the accumulation of anthocyanins in ripening berries.


Figures

Figure 1.
Figure 1.
Experimental design. Genome-wide gene expression analysis was carried out on berries representing 10 Italian grapevine varieties (A) sampled at four developmental stages (B) in order to cover the entire process of berry development. Brix degrees and total anthocyanin concentrations were measured for each variety at the EV and H stages (C). Sampling time points are represented according to the Bbch scale for grapevine phenological growth stages as defined by Lorenz et al. (1994). Images of berry clusters were selected on the Italian register of grapevine varieties website (http://catalogoviti.politicheagricole.it).
Figure 2.
Figure 2.
Gene expression analysis of the 10 varieties during berry development. Genes considered to be expressed were counted for each variety at each growth stage. Transcripts were divided according to four FPKM intervals based on the average value of the biological triplicate normalized by Cuffmerge (Roberts et al., 2011). For each FPKM interval, the average number of expressed genes and the corresponding sd values are represented by the white boxes. Significant differences between each pair of consecutive stages are marked with asterisks (P < 0.01).
Figure 3.
Figure 3.
Comparison of transcriptomes from 10 varieties during four stages of berry development. A, Pearson correlation matrix of the 40-sample data set. The analysis was performed using the log2-transformed FPKM values of the 21,746 transcripts considered to be expressed during berry development, with Pearson correlation coefficient as the metric. B, Cluster dendrogram of the whole data set. The Pearson correlation coefficients were converted into distance coefficients to define the height of the dendrogram branches.
Figure 4.
Figure 4.
The core berry development transcriptome. A, Number of DEGs identified in each variety between each pair of consecutive developmental stages: P-PV, PV-EV, and EV-H. B, Genes considered to be differentially expressed between each pair of consecutive developmental stages in all 10 varieties. The histogram represents the number of commonly down-regulated (blue) and up-regulated (red) genes in all 10 varieties between each pair of consecutive developmental stages. Only transcripts with a gene expression value FPKM > 1 at least at one growth stage in all 10 varieties were selected. C, Gene expression profiles and GO category distribution of the genes in the six coexpression clusters composing the core berry development transcriptome. Clusters were derived by coupled clustering analysis of the 4,613 commonly modulated genes. Each single line represents the log2-transformed average of the mean FPKM values for an individual transcript at the four growth stages: P, PV, EV, and H. GO annotations were assigned to each gene according to the VitisNet functional annotation (Grimplet et al., 2009). Significantly overrepresented GO categories are represented by asterisks. GO category enrichment was computed using Fisher’s exact test (adjusted P ≤ 0.01).
Figure 5.
Figure 5.
Behavioral differences between the red and white berry transcriptomes during the maturation phase. A, PCA plot of the 40-sample data set showing the first two principal components t[1] = 34.7% and t[2] = 9.61%. B, PCA plot of 20 red berry transcriptomes showing the first two principal components t[1] = 38.8% and t[2] = 11.4%. C, PCA plot of 20 white berry transcriptomes showing the first two principal components t[1] = 38.6% and t[2] = 10.4%. D, Heat map of the genes considered to be differentially expressed between red and white berries at the EV and H stages (fold change > 4). E, PCA plot of the 40-sample data set after removing the 1,249 DEGs between red and white berries during the maturation phase. The plot shows the first two principal components t[1] = 34.8% and t[2] = 9.2%. Abbreviations for the 10 varieties are as follows: SG (Sangiovese), BA (Barbera), NA (Negro amaro), RF (Refosco), and PR (Primitivo) for the red-skinned varieties and VR (Vermentino), GA (Garganega), GL (Glera), MB (Moscato bianco), and PS (Passerina) for the white-skinned varieties.
Figure 6.
Figure 6.
Overlapping behavior of the red and white berry transcriptomes during ripening shown by removing 6,003 genes. A, PCA plot of the 40-sample data set after removing genes with harvest loadings > 0.65 and < –0.65. The plot shows the first two principal components t[1] = 33.8% and t[2] = 8.74%. The data set used for this analysis was composed of 15,228 genes corresponding to the genes remaining after removing those with harvest loadings > 0.65 and < –0.65. Abbreviations for the 10 varieties are as in Figure 5. B, Enriched GO terms among the genes with loading values > 0.65 at harvest. C, Enriched GO terms among genes with loading values < –0.65 at harvest. Network graphs show BiNGO visualizations of the overrepresented GO terms among the 3,450 transcripts with loading values > 0.65 (B) and the 2,553 transcripts with loading values < –0.65 (C). Node size is positively correlated with the number of genes belonging to the category. Noncolored nodes are not overrepresented, but they may be the parents of overrepresented terms. Colored nodes show GO terms that are significantly overrepresented (Benjamini and Hochberg corrected P < 0.01), with the shade indicating significance as shown in the color bar.
Figure 7.
Figure 7.
Phenylpropanoid metabolism in red-skinned berries during ripening. A, Transcriptional modulation of genes associated with phenylpropanoid metabolism during berry maturation. The central phenylpropanoid, anthocyanin, and stilbene pathways are based on the Kyoto Encyclopedia of Genes and Genomes (www.genome.jp/kegg/pathway.html). Dashed lines indicate the related MYB transcription factors. Heat maps depict the normalized gene expression values (log2 [FPKM + 1]) in the 10 varieties at EV and H stages. Abbreviations for the 10 varieties are as in Figure 5. B, Total anthocyanin concentrations in the five red berry varieties at the EV (white bars) and H (gray bars) stages. Values represent means ± sd of three biological replicates. ANOVA with Tukey’s posthoc test was used to compare the anthocyanin concentrations at stage H between the five red varieties. Adjusted P < 0.05 was considered statistically significant. Samples with the same letter are not significantly different.
Figure 8.
Figure 8.
Schematic representation of the relationship between anthocyanin presence/accumulation and berry transcriptome rearrangement during ripening. A, Transcriptional modulation associated with the presence of anthocyanins in the comparison between white and red berry varieties at the H stage. The identified 837 genes are assigned to either varietal color group showing the specific functional categories. B, Schematic highlighting grapevine transcriptome organization over berry development in terms of the number of expressed genes (21,746) and modulated genes (4,613), of which 913 represent the berry development core transcriptome. C, Transcriptional modulation associated with the extent of anthocyanin accumulation among red berry varieties at the H stage. The functional categories of the 6,003 modulated genes are shown in association with the extent of color accumulation.

References

    1. Anesi A, Stocchero M, Dal Santo S, Commisso M, Zenoni S, Ceoldo S, Tornielli GB, Siebert TE, Herderich M, Pezzotti M, et al. (2015) Towards a scientific interpretation of the terroir concept: plasticity of the grape berry metabolome. BMC Plant Biol 15: 191. - PMC - PubMed
    1. Bindon K, Holt H, Williamson PO, Varela C, Herderich M, Francis IL (2014) Relationships between harvest time and wine composition in Vitis vinifera L. cv. Cabernet Sauvignon. 2. Wine sensory properties and consumer preference. Food Chem 154: 90–101 - PubMed
    1. Boss PK, Davies C, Robinson SP (1996a) Analysis of the expression of anthocyanin pathway genes in developing Vitis vinifera L cv Shiraz grape berries and the implications for pathway regulation. Plant Physiol 111: 1059–1066 - PMC - PubMed
    1. Boss PK, Davies C, Robinson SP (1996b) Expression of anthocyanin biosynthesis pathway genes in red and white grapes. Plant Mol Biol 32: 565–569 - PubMed
    1. Böttcher C, Burbidge CA, Boss PK, Davies C (2013) Interactions between ethylene and auxin are crucial to the control of grape (Vitis vinifera L.) berry ripening. BMC Plant Biol 13: 222. - PMC - PubMed