. 2017 Jul 11;114(28):7450-7455.
doi: 10.1073/pnas.1702275114. Epub 2017 Jun 26.

Neighbor detection at the leaf tip adaptively regulates upward leaf movement through spatial auxin dynamics

Affiliations

Neighbor detection at the leaf tip adaptively regulates upward leaf movement through spatial auxin dynamics

Chrysoula K Pantazopoulou et al. Proc Natl Acad Sci U S A. .

Abstract

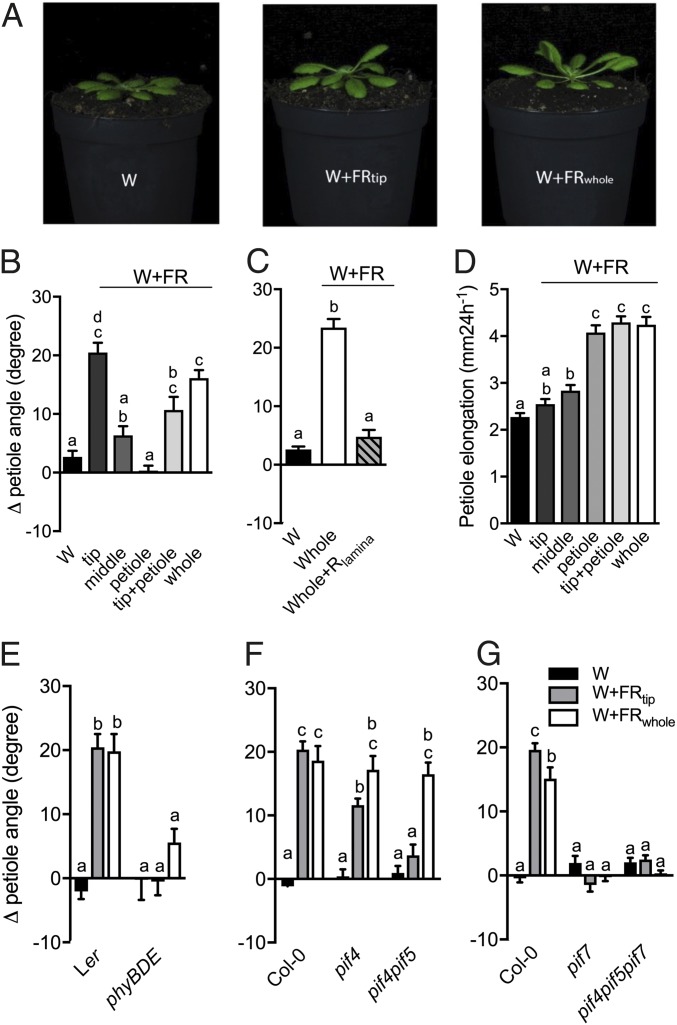
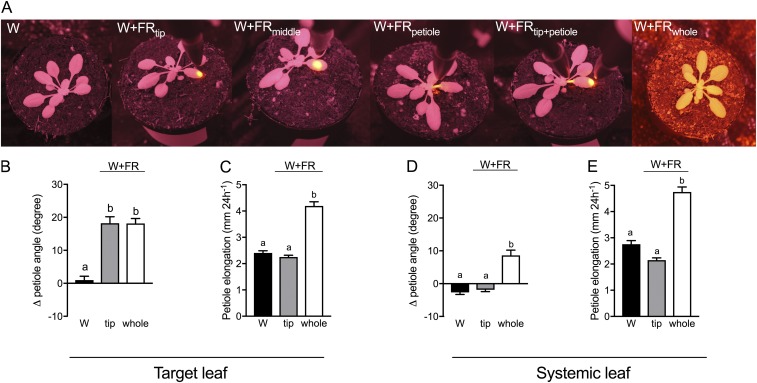
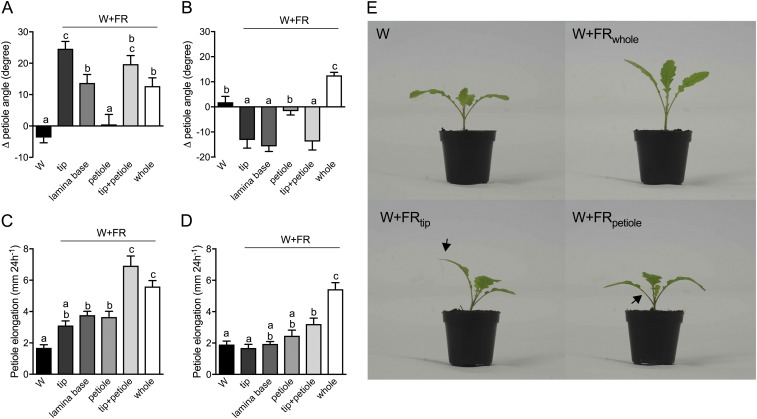
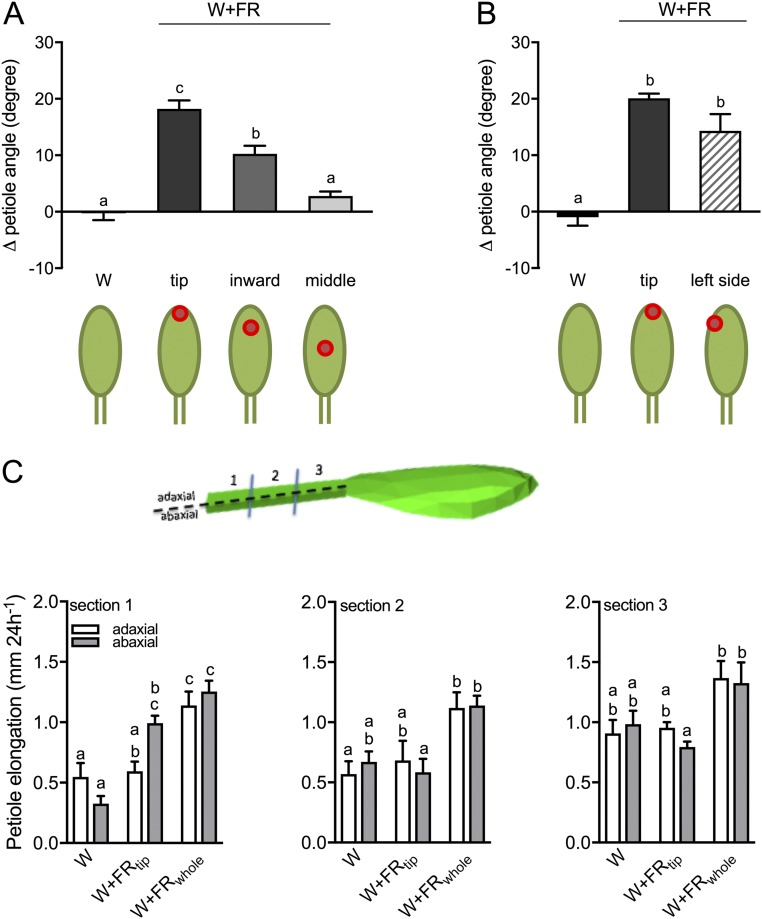
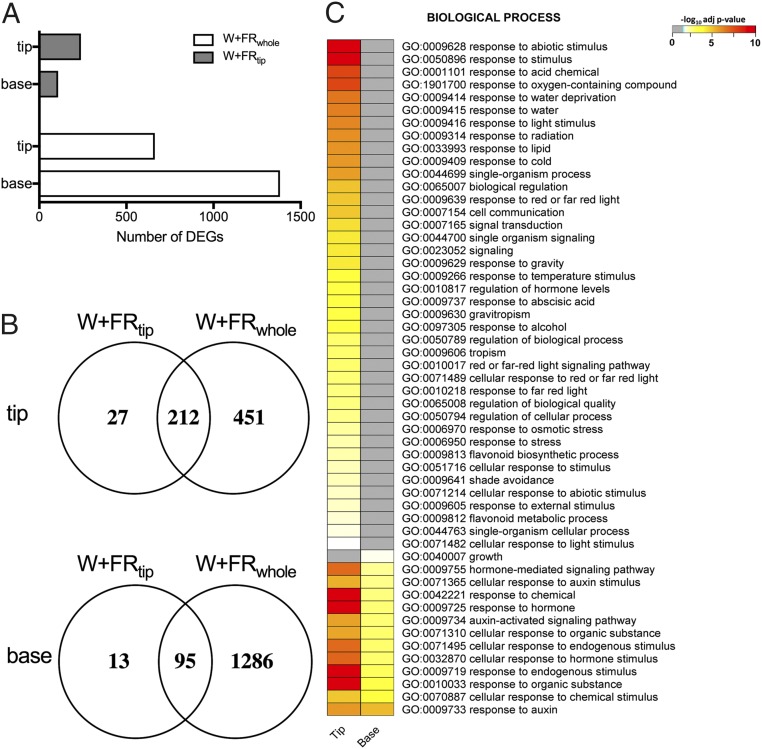
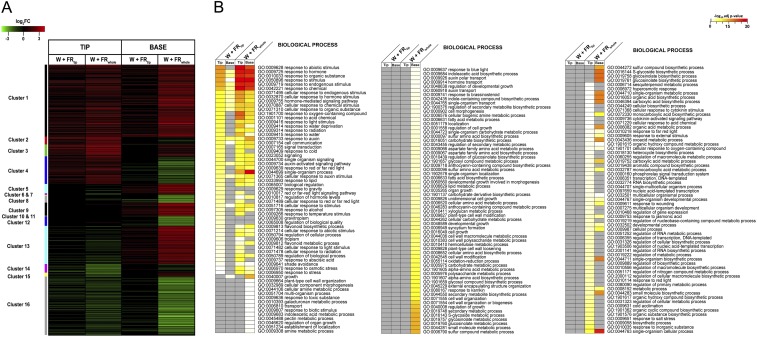
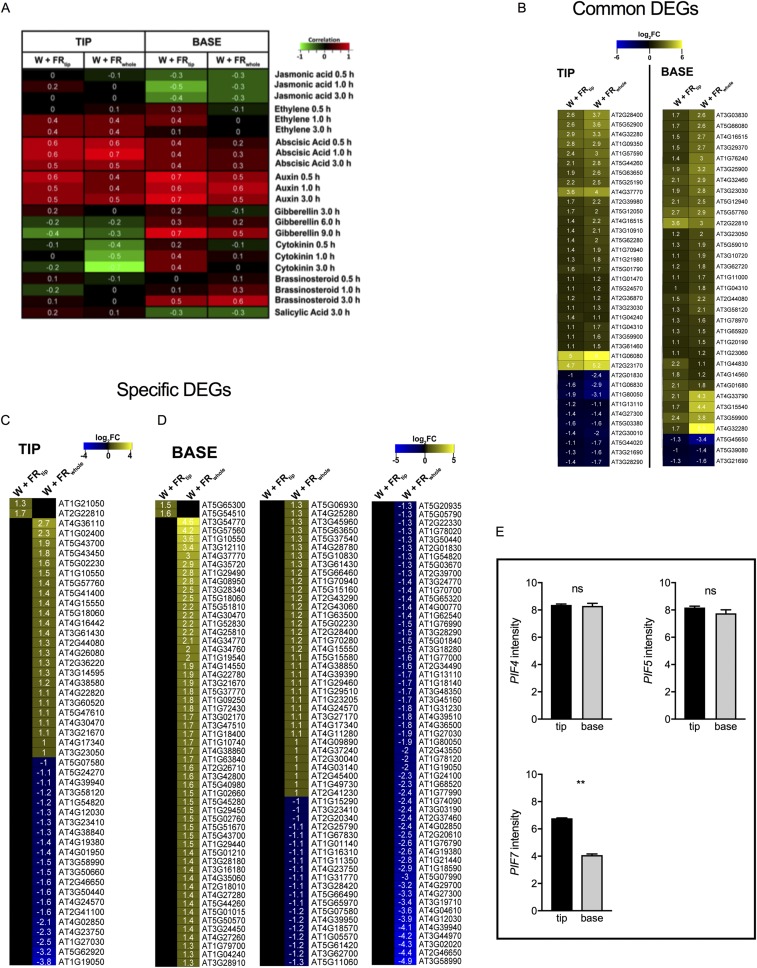
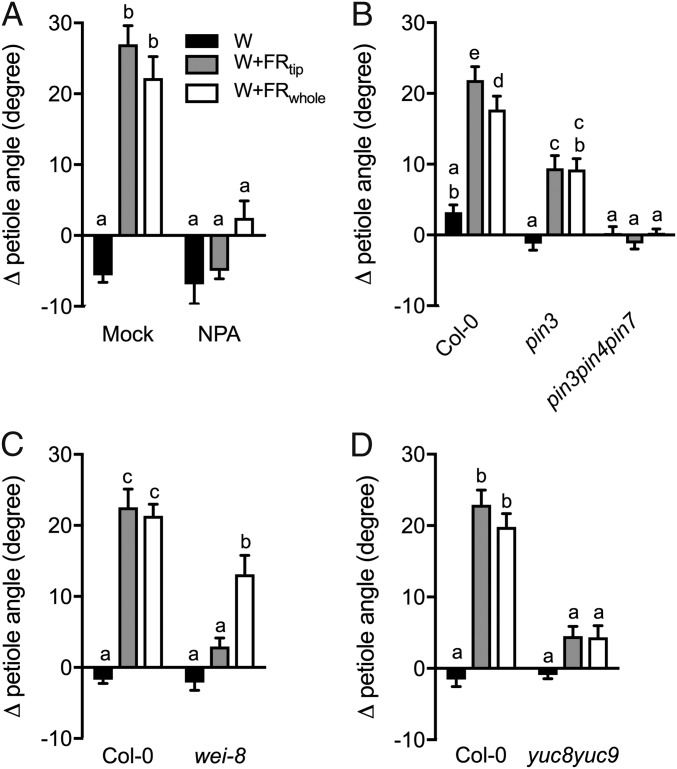
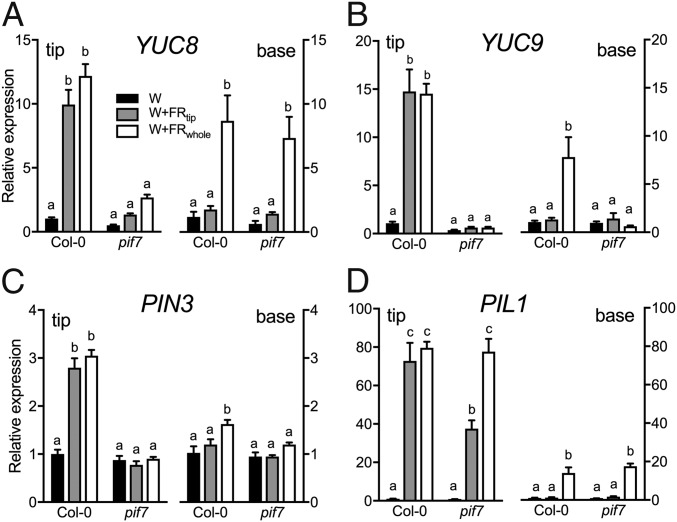
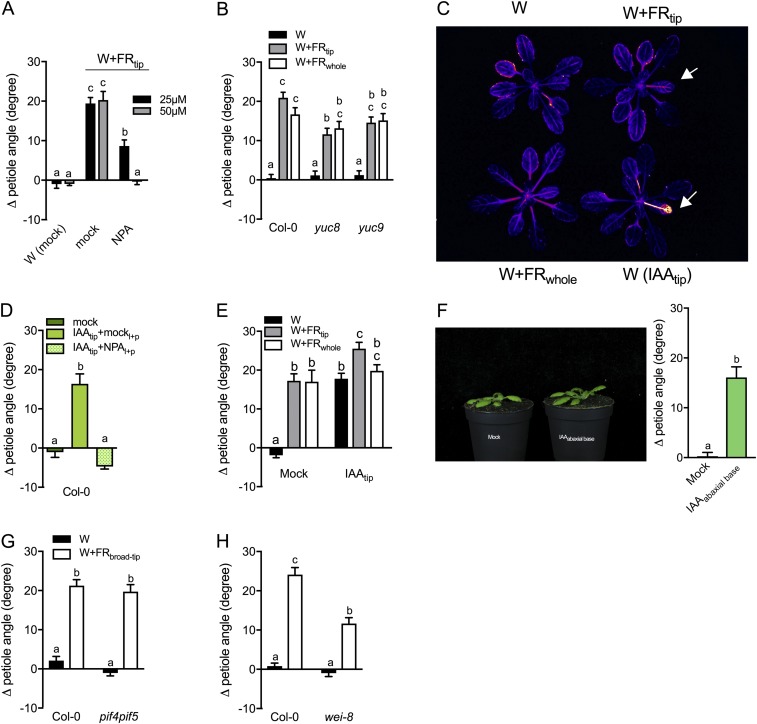
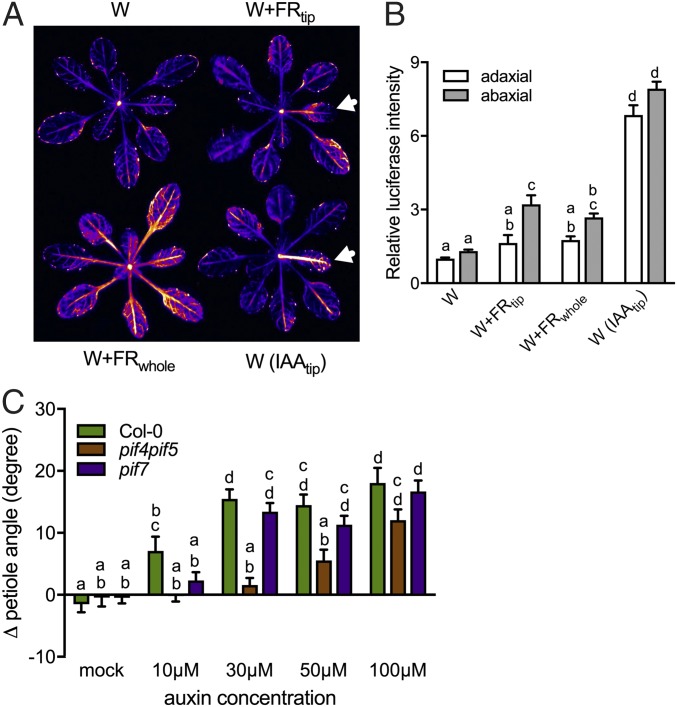
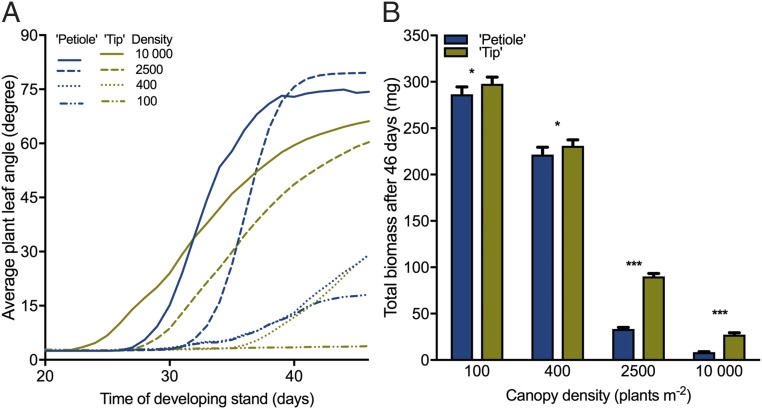
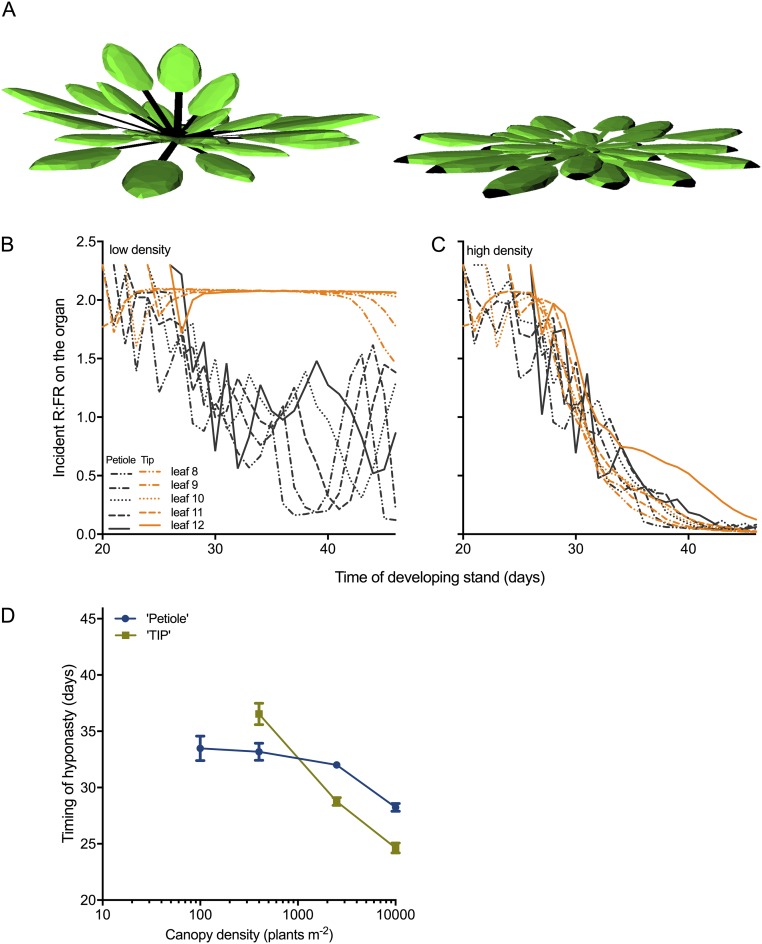
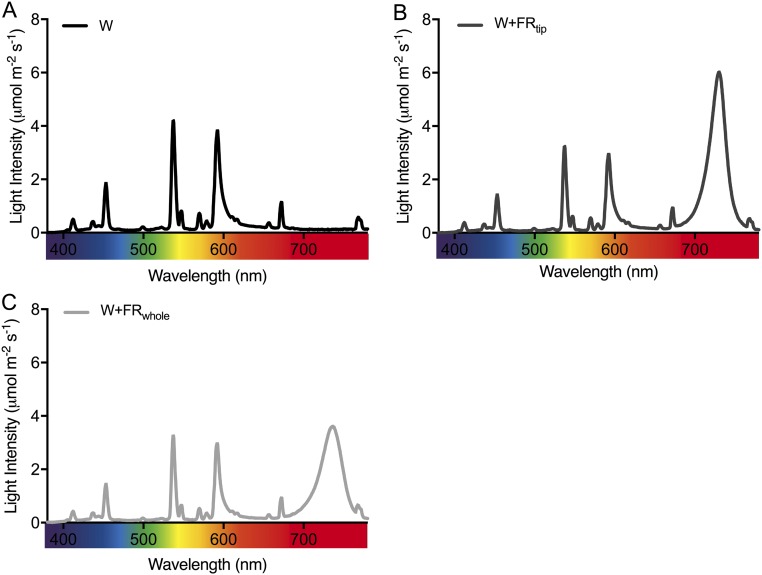
Vegetation stands have a heterogeneous distribution of light quality, including the red/far-red light ratio (R/FR) that informs plants about proximity of neighbors. Adequate responses to changes in R/FR are important for competitive success. How the detection and response to R/FR are spatially linked and how this spatial coordination between detection and response affects plant performance remains unresolved. We show in Arabidopsis thaliana and Brassica nigra that localized FR enrichment at the lamina tip induces upward leaf movement (hyponasty) from the petiole base. Using a combination of organ-level transcriptome analysis, molecular reporters, and physiology, we show that PIF-dependent spatial auxin dynamics are key to this remote response to localized FR enrichment. Using computational 3D modeling, we show that remote signaling of R/FR for hyponasty has an adaptive advantage over local signaling in the petiole, because it optimizes the timing of leaf movement in response to neighbors and prevents hyponasty caused by self-shading.

Keywords: auxin; functional-structural plant model; leaf movement; phytochrome; shade avoidance.


Conflict of interest statement

The authors declare no conflict of interest.

Figures

Fig. 1.
Fig. 1.
Local FR treatment can induce different shade-avoidance responses in a PIF-dependent manner. (A) Representative photographs of Col-0 plants treated with white light (W), white light with supplemented FR light to the lamina tip (W+FRtip), or white light with supplemented FR to the whole plant (W+FRwhole). (B) Differential petiole angle for plants exposed to 24-h white light control conditions (W) and to supplemented FR light to the lamina tip (tip), the middle of the lamina (middle), the entire petiole (petiole), the lamina tip plus the petiole (tip+petiole), and the whole plant (whole). (C) Differential petiole angles after 24-h exposure to W, W+FRwhole, and W+FRwhole with supplemented R light at the lamina (W+FRwhole+Rlamina). (D) Petiole elongation response to 24-h exposure to the light treatments in B. (EG) Differential petiole angle of Ler and phyBphyDphyE (E), Col-0, pif4, and pif4pif5 (F), and Col-0, pif7, and pif4pif5pif7 (G) after 24 h of growth in white light (W) or in white light with supplemented FR to the lamina tip (W+FRtip) or to the whole plant (W+FRwhole). Data represent mean ± SE; n = 10 in B, C, F, and G; n = 18 or 19 in E and F. Different letters indicate statistically significant differences (one-way ANOVA in BD and two-way ANOVA in EG with Tukey’s post hoc test; P < 0.05).
Fig. S1.
Fig. S1.
Supplemental FR treatment does not induce hyponasty or petiole elongation in systemic leaves. (A) IR photographs illustrating plants in the different light treatments: white light (W), white light with supplemental FR through a 3.5-mm spot (observed as bright yellow spot) on the lamina tip (W+FRtip), the middle of the lamina (W+FRmiddle), the petiole (W+FRpetiole), the lamina tip and petiole (W+FRtip+petiole), and whole-plant FR (W+FRwhole). (B and C) The differential petiole angle (B) and petiole elongation (C) of the target leaf in W, W+FRtip, and W+FRwhole conditions. (D and E) The differential petiole angle (D) and petiole elongation (E) of the systemic leaf under the same light conditions. Data represent the mean ± SE (n = 10). Different letters indicate statistically significant differences (one-way ANOVA with Tukey’s post hoc test, P < 0.05).
Fig. S2.
Fig. S2.
Tissue-specific FR perception in B. nigra induces hyponastic and elongation responses. B. nigra seedlings were grown in a 16/8-h light/dark cycle with 110–150 μmol⋅m−2⋅s−1 PAR, R/FR 2.3, 20 °C and 70% relative humidity. The petiole angle and petiole elongation of the first two leaves of 14-d-old Brassica seedlings were measured during 24 h of exposure to different light treatments (cotyledons were removed 2 d before the treatment). Plants were grown in white light (W) or one leaf (referred to as the “target leaf”) was treated with supplemental FR light applied to the lamina tip (tip), lamina base, petiole, lamina tip plus petiole (tip+petiole), or whole plant (whole). (AD) Data show the change in the petiole angle of the target leaf (A) and systemic leaf (B) and the petiole elongation of the target leaf (C) and the systemic leaf (D). Data represent the mean ± SE (n = 10). Different letters represent statistically significant differences (one-way ANOVA with Tukey’s post hoc test; P < 0.05). (E) Representative photographs of the B. nigra plants in white light (W), in white light with supplemental FR for the whole plant (W+FRwhole), and in white light with supplemental FR light at the lamina tip (W+FRtip) or at the petiole (W+FRpetiole) of the left leaf. Black arrows indicate the area (lamina tip and petiole, respectively) treated with supplemental FR.
Fig. S3.
Fig. S3.
FR perception in the lamina tip induces the maximal hyponastic response through differential cell growth in the abaxial side of the petiole base. (A and B) The differential petiole angle of Col-0 WT plants in white light (W) (A and B) and in white light with supplemental FR at different spots on the lamina tip, including the very tip (tip) (A and B), between the lamina tip and the middle of the lamina (inward) (A), in the middle of the lamina (middle) (A), and on the left side of the lamina tip (B). Cartoons bellow the graphs illustrate the areas irradiated; supplemental FR light is indicated as a red spot. (C) Elongation of the adaxial (white bars) and abaxial (gray bars) side in three sections of the petiole (see leaf drawing) in the W, W+FRtip, and W+FRwhole conditions. Data represent mean ± SE; n = 14 in A and n = 7 in B and C. Different letters represent statistically significant differences (one-way ANOVA in A and B or two-way ANOVA in C with Tukey’s post hoc test; P < 0.05).
Fig. 2.
Fig. 2.
Comparative analysis of W+FRtip- and W+FRwhole-induced transcriptome responses in the lamina tip and the petiole base. (A) Number of DEGs in the lamina tip and the petiole base. (B) Venn diagrams illustrate the DEGs common to the two FR treatments in the lamina tip and the petiole base. (C) GO enrichment analysis for the genes common to the W+FRtip and W+FRwhole conditions for each of the two tissues.
Fig. S4.
Fig. S4.
Transcriptome analysis of the lamina tip and petiole base in the W+FRtip and W+FRwhole conditions. (A) DEGs in the lamina tip and petiole base in response to W+FRtip and W+FRwhole light treatment (adjusted P value ≤ 0.01 and log2FC >1 or <1), clustered based on fold change and direction (up/down) of regulation. (B) GO enrichment analysis for the lamina tip and petiole based on W+FRtip and W+FRwhole conditions. The yellow–red color scale denotes the significance of the GO terms; gray indicates the GO term is not significantly enriched in that specific treatment × tissue combination.
Fig. S5.
Fig. S5.
Hormone-associated transcript patterns in the microarray data of the petiole base and lamina tip under W+FRtip and W+FRwhole treatments. (A) Hormonometer analysis of the lamina tip and petiole base transcriptome (27). (B) Heatmap representation of the expression levels of DEGs that are associated with auxin and are shared (common) in the two tissue types W+FRtip and W+FRwhole conditions. (C and D) Heatmaps showing differentially expressed auxin-related genes in the lamina tip (C) and petiole base (D) that are exclusive to either the W+FRtip or the W+FRwhole condition. The heatmaps in B, C, and D are based on IAA-induced transcripts in ref. . (E) The intensity of PIF4, PIF5, and PIF7 in the microarray data of the lamina tip and petiole base in W light. ns, not significant. Data are means ± SE, n = 3. ns, no significant difference. **P < 0.01, paired Student's t test.
Fig. 3.
Fig. 3.
Auxin biosynthesis and transport are required for hyponasty. (A) Differential petiole angles in response to different light conditions with exogenous application of one droplet of 50-μM NPA or a mock solution to the lamina tip. (BD) Differential petiole angles of auxin transport mutants (pin3 and pin3pin4pin7) (B) and biosynthesis mutants (wei-8 in C and yuc8yuc9 in D) in three different light conditions. Data were collected after 24 h of exposure to W, W+FRtip, or W+FRwhole conditions. Data represent mean ± SE; n = 7–10. Different letters indicate statistically significant differences (two-way ANOVA with Tukey’s post hoc test; P < 0.05).
Fig. 4.
Fig. 4.
Relative expression of three auxin-related genes and a shade-avoidance marker in two tissues. Relative expression of the auxin biosynthesis genes YUC8 (A) and YUC9 (B), the auxin efflux carrier PIN3 (C), and the shade-avoidance marker PIL1 (D) in the lamina tip and petiole base tissue of Col-0 WT and pif7 mutant plants after 5 h in W, W+FRtip, or W+FRwhole conditions. Data represent the mean ± SE; n = 4. Different letters indicate organ-specific statistically significant differences (two-way ANOVA with Tukey’s post hoc test; P < 0.05).
Fig. S6.
Fig. S6.
The importance of auxin in the induction of hyponasty. (A) Differential petiole angle response after exogenous application of different NPA concentrations to the lamina tip under W and W+FRtip conditions. (B) Differential petiole angle of auxin biosynthesis gene mutants (yuc8 and yuc9) under W, W+FRtip, and W+FRwhole conditions. (C) Luciferase luminescence of the auxin reporter line DR5:LUC on the adaxial side under W (Upper Left), W+FRtip (Upper Right), W+FRwhole (Lower Left), and W with exogenous application of 30 μM IAA to the lamina tip [W (IAAtip)] (Lower Right). White arrows indicate the treated leaf. (D) Differential petiole angle of Col-0 WT plants upon the application of IAA (30 μM) at the lamina tip in the presence (IAAtip + NPAl+p) or in the absence (IAAtip + mockl+p) of 50 μM of NPA in the petiole–lamina junction in W light. (E) Differential petiole angle of Col-0 WT plants under W, W+FRtip, and W+FRwhole conditions after the application of 30 μM IAA or mock to the lamina tip. (F) Hyponastic response in Col-0 WT plants to the application of exogenous auxin to the abaxial side of the petiole base in W light (IAAabaxial base) versus mock control. (G and H) Differential petiole angle of pif4pif5 (G) and wei8-1 (H) mutants under W light (black bars) and supplemental FR light (white bars) in a broad (7.5-mm) spot (rather than the regular 3.5-mm spot) on the lamina tip (W+FRbroad tip). Data represent the mean ± SE; n = 6 in A; n = 10 in BE; n = 18 in F; and n = 14 in G and H. Different letters indicate statistically significant differences (one-way ANOVA in D or two-way ANOVA in A, B, E, G, and H) with Tukey’s post hoc test or with a paired Student’s t test in F; P < 0.05.
Fig. 5.
Fig. 5.
Supplemental FR and localized IAA control auxin dynamics for leaf hyponasty. (A) Luciferase luminescence of the DR5:LUC auxin reporter on the abaxial side in W (Upper Left), W+FRtip (Upper Right), W+FRwhole (Lower Left), and W with the exogenous application of one droplet of 30-μΜ IAA in the lamina tip [W(IAAtip), Lower Right]. White arrows indicate the treated leaf in localized treatments. (B) Quantification of relative luciferase intensity on the adaxial (white bars) and abaxial (gray bars) side of the petiole after exposure to W, W+FRtip, W+FRwhole, or W(IAAtip). Intensity values were expressed relative to those measured for the adaxial sides of control W petioles. (C) Differential petiole angle of Col-0 WT and the pif4pif5 and pif7 mutants 23 h after exogenous application of different IAA concentrations in the lamina tip. Data represent mean ± SE; n = 5 in B; n = 14 in C. Different letters indicate significant differences (two-way ANOVA with Tukey’s post hoc test; P < 0.05).
Fig. 6.
Fig. 6.
Tissue-specific R/FR perception affects the performance of plants growing in stands with different densities, as found through FSP modeling. (A) Mean leaf angle for plant types using the petiole (blue traces) or the lamina tip (yellow traces) as the R/FR-detecting organ for inducing hyponasty in four stands with mixtures of the two plant types and with different plant densities. (B) Simulated total accumulated biomass per individual for both plant types after 46 d of growth in stands with mixtures of the two plant types and with four different densities. Data represent the mean ± SD; n = 10. Statistically significant differences are indicated as *P < 0.05 and ***P < 0.001, paired Student’s t test.
Fig. S7.
Fig. S7.
Tissue-specific incident R/FR and the timing of hyponasty in different plant densities simulated through FSP modeling. (A) Virtual representation of two simulated Arabidopsis plants growing at low density (100 plants/m2). Two plant types were simulated that used the R/FR at the petiole (Left) or at the lamina tip (Right) to induce hyponasty, as identified by black coloring of the organ part. The simulated plant that used the petiole R/FR as input for hyponasty shows that leaves become hyponastic through self-shading by younger leaves. (B and C) Incident R/FR at petiole (gray traces) and tip (orange traces) of leaves 8–12 during plant development at low density (B) or at high density (2,500 plants/m2) (C). In these simulations, plants did not become hyponastic. (D) Timing of hyponasty in relation to canopy density for two plant types that use the petiole (blue trace) or the lamina tip (yellow trace) as a R/FR-detection organ to induce hyponasty. Data represent the mean ± SD; n = 10.
Fig. S8.
Fig. S8.
The spectral composition of light in the three major light conditions. (A) Control white light (W). (B) White light with a supplemental FR spotlight at the lamina tip (W+FRtip). (C) White light with supplemental FR at the whole-plant level (W+FRwhole).

Similar articles

Cited by

References

    1. Monsi M, Saeki T. On the factor light in plant communities and its importance for matter production. 1953. Ann Bot (Lond) 2005;95:549–567. - PMC - PubMed
    1. Boonman A, Prinsen E, Voesenek LACJ, Pons TL. Redundant roles of photoreceptors and cytokinins in regulating photosynthetic acclimation to canopy density. J Exp Bot. 2009;60:1179–1190. - PMC - PubMed
    1. Crepy MA, Casal JJ. Photoreceptor-mediated kin recognition in plants. New Phytol. 2015;205:329–338. - PubMed
    1. Chelle M, et al. Simulation of the three-dimensional distribution of the red:far-red ratio within crop canopies. New Phytol. 2007;176:223–234. - PubMed
    1. Ballaré CL, Sanchez RA, Scopel AL, Casal JJ, Ghersa CM. Early detection of neighbour plants by phytochrome perception of spectral changes in reflected sunlight. Plant Cell Environ. 1987;10:551–557.

Publication types