. 2017 Jul 11;114(28):E5655-E5663.
doi: 10.1073/pnas.1703151114. Epub 2017 Jun 26.

Targeting cancer cell integrins using gold nanorods in photothermal therapy inhibits migration through affecting cytoskeletal proteins

Affiliations

Targeting cancer cell integrins using gold nanorods in photothermal therapy inhibits migration through affecting cytoskeletal proteins

Moustafa R K Ali et al. Proc Natl Acad Sci U S A. .

Abstract

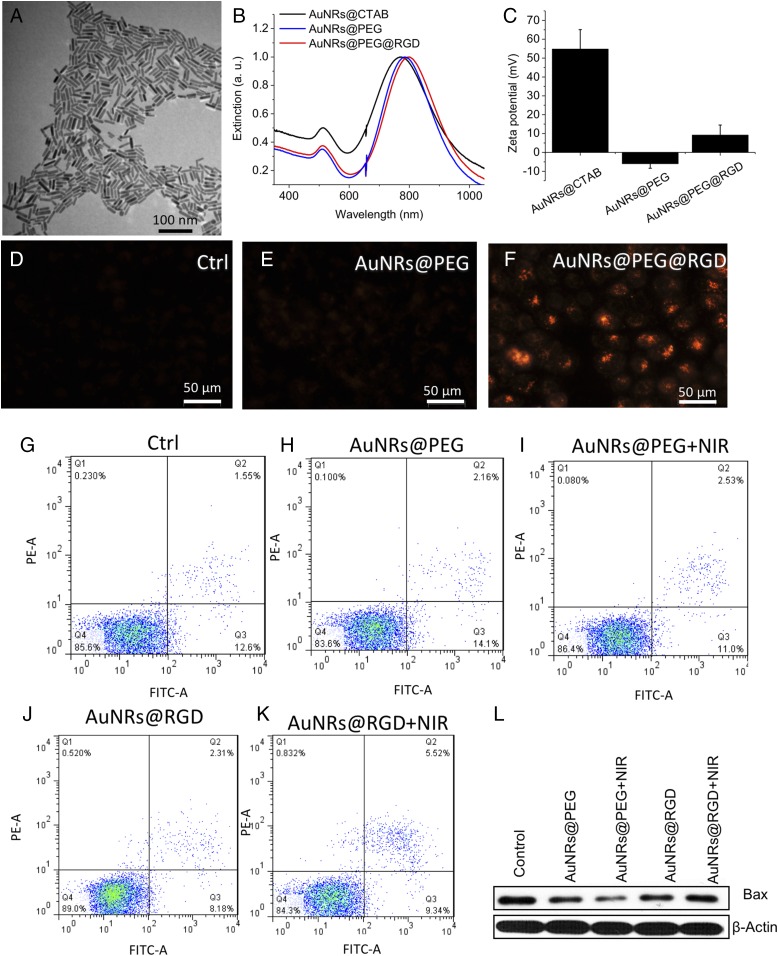
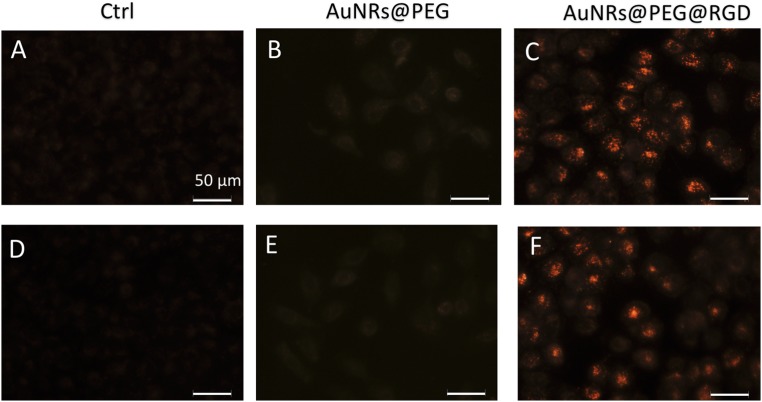
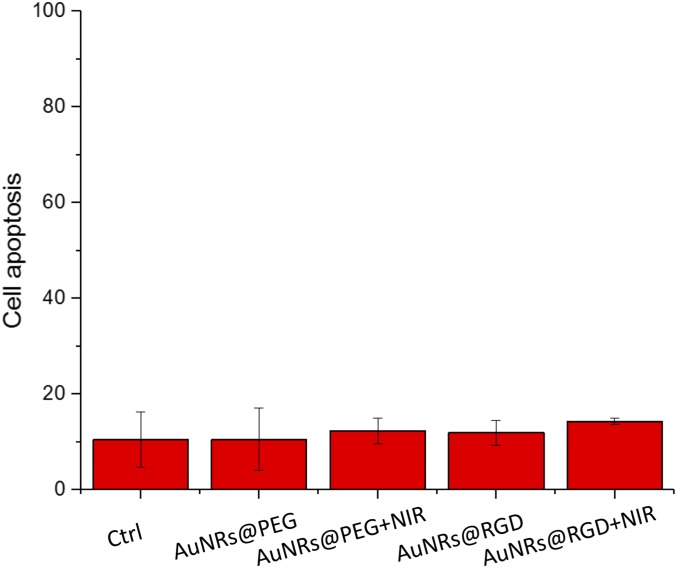
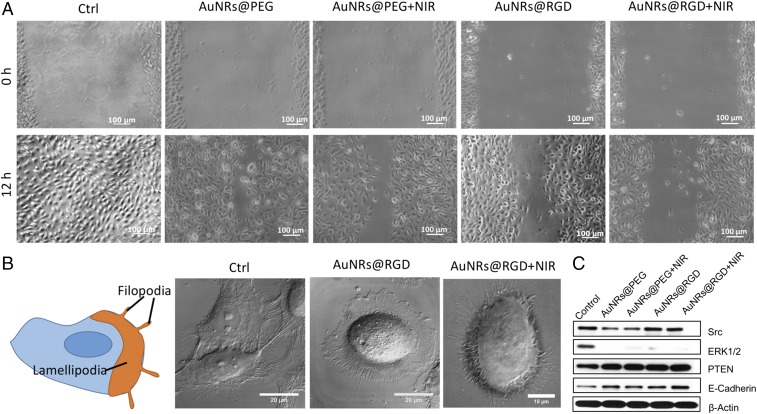
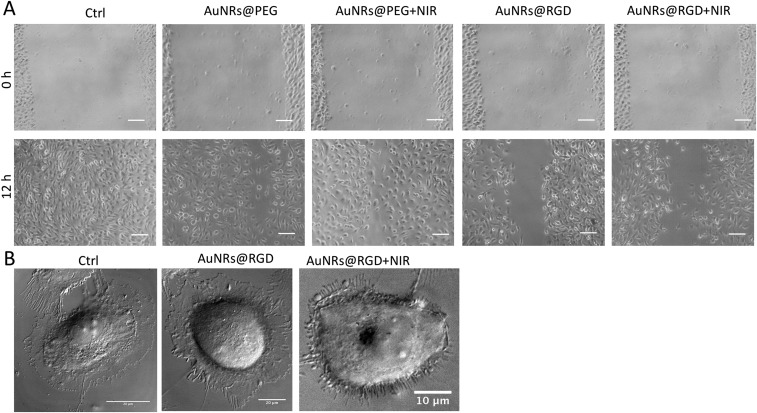
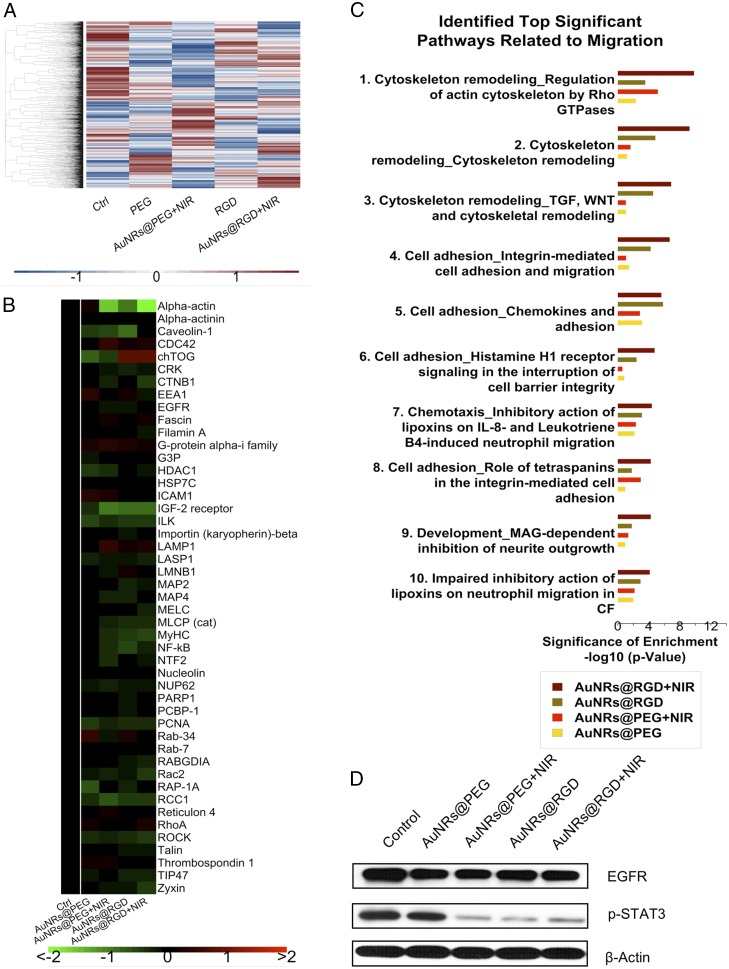
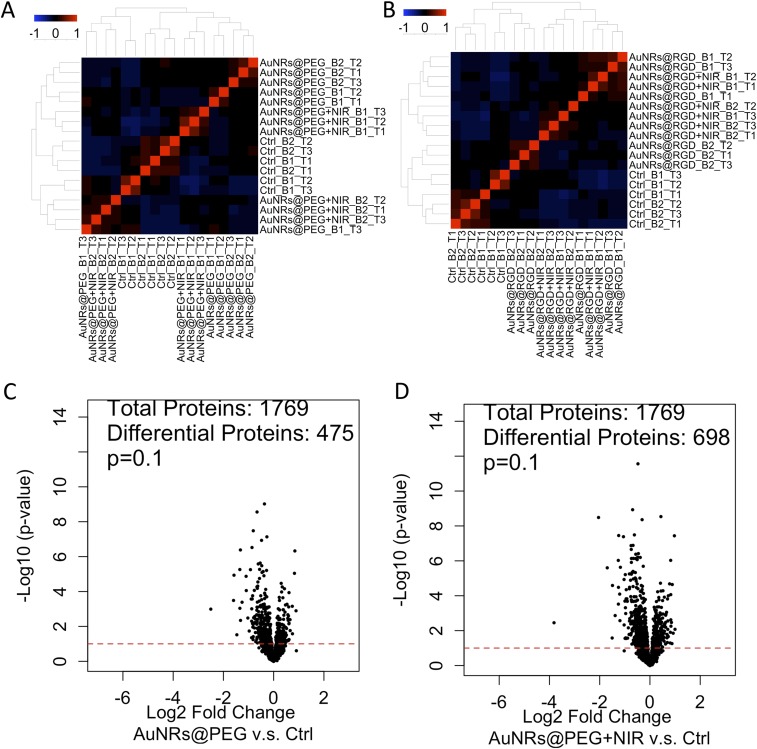
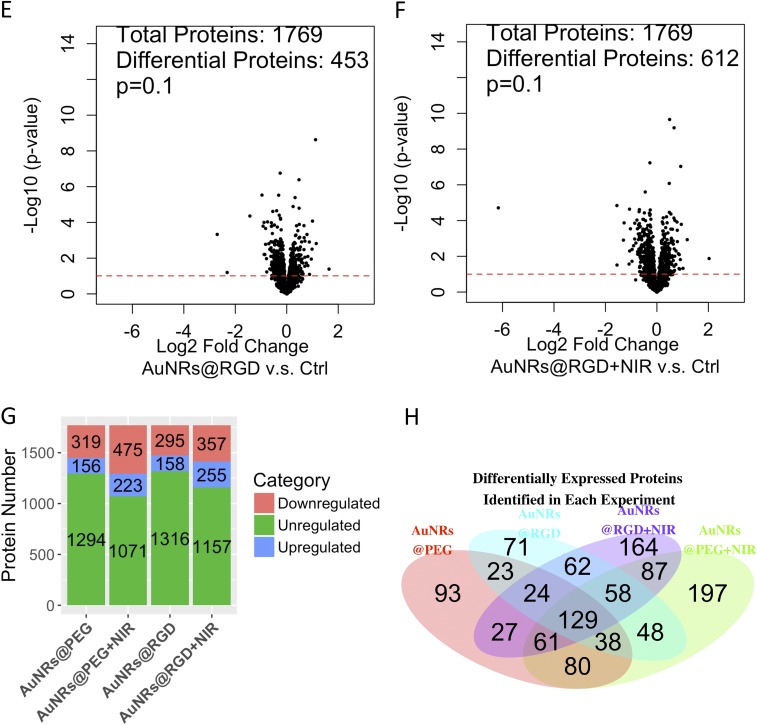
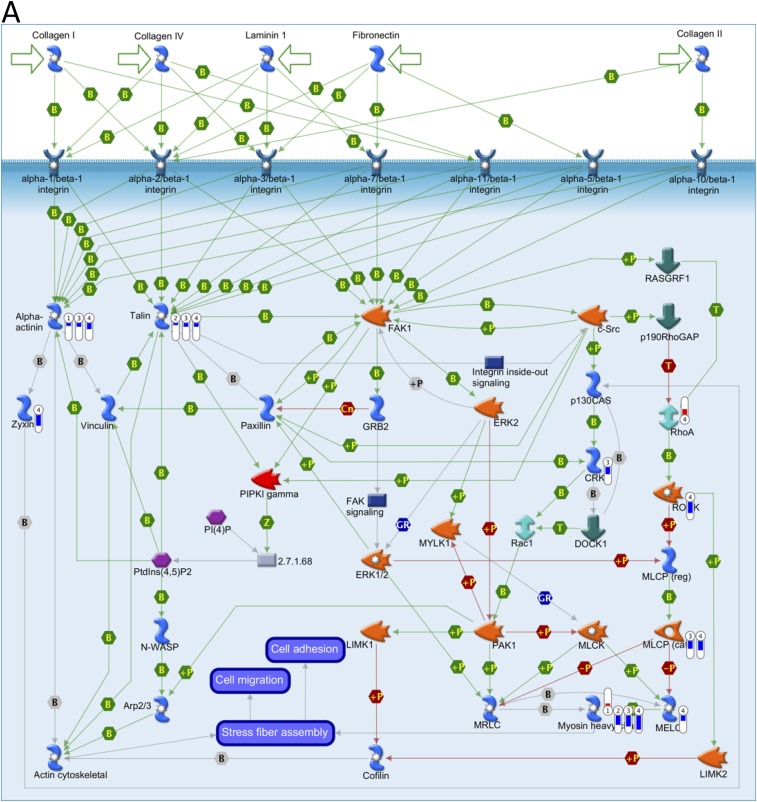
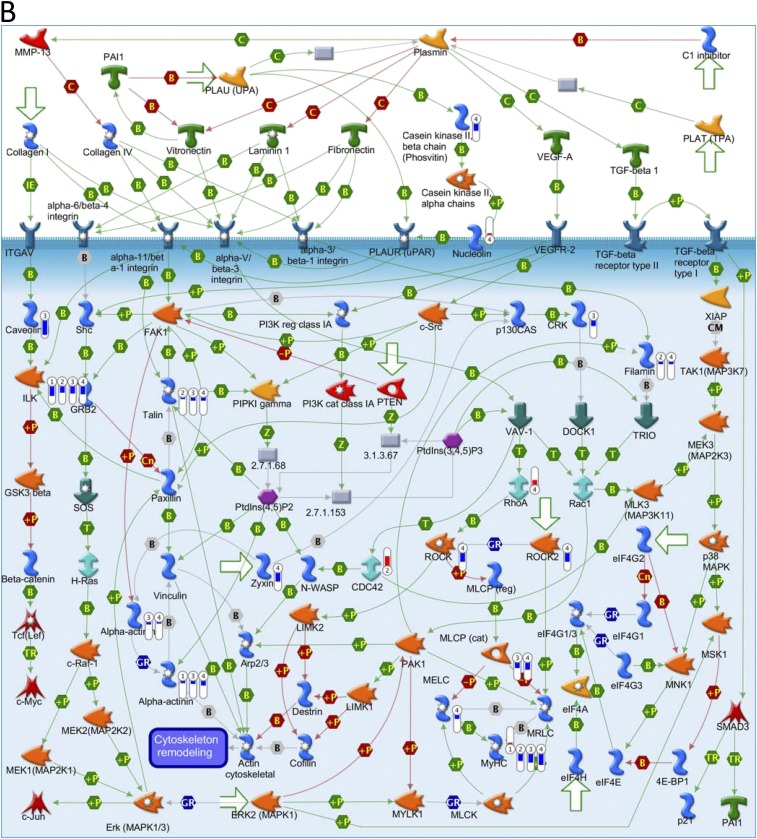
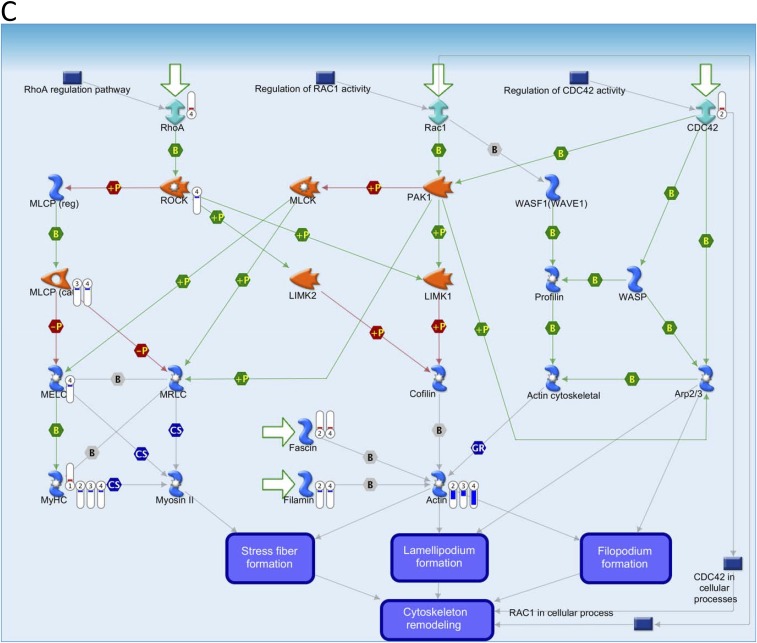
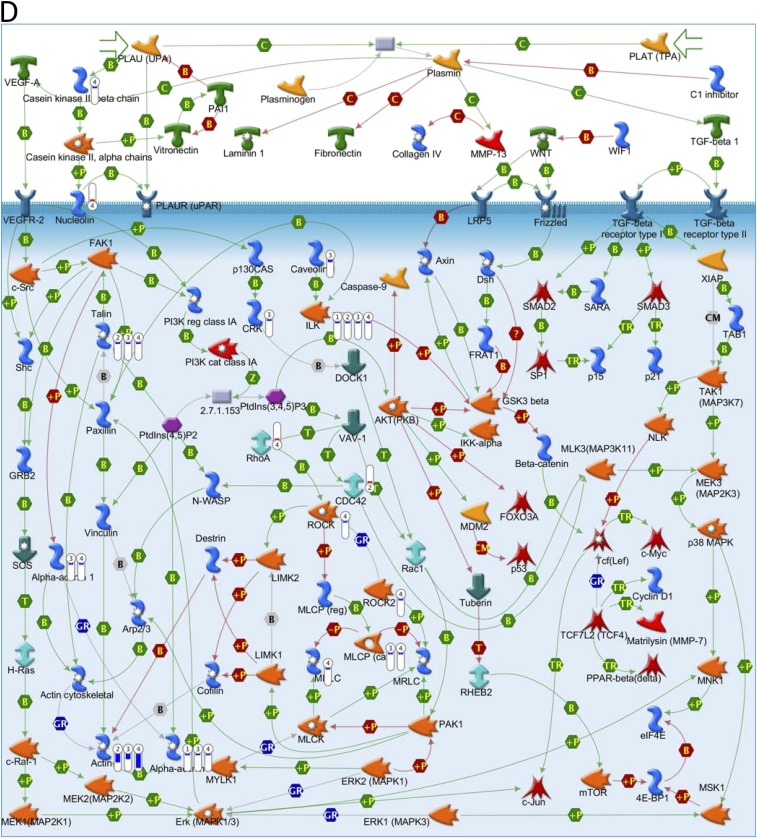
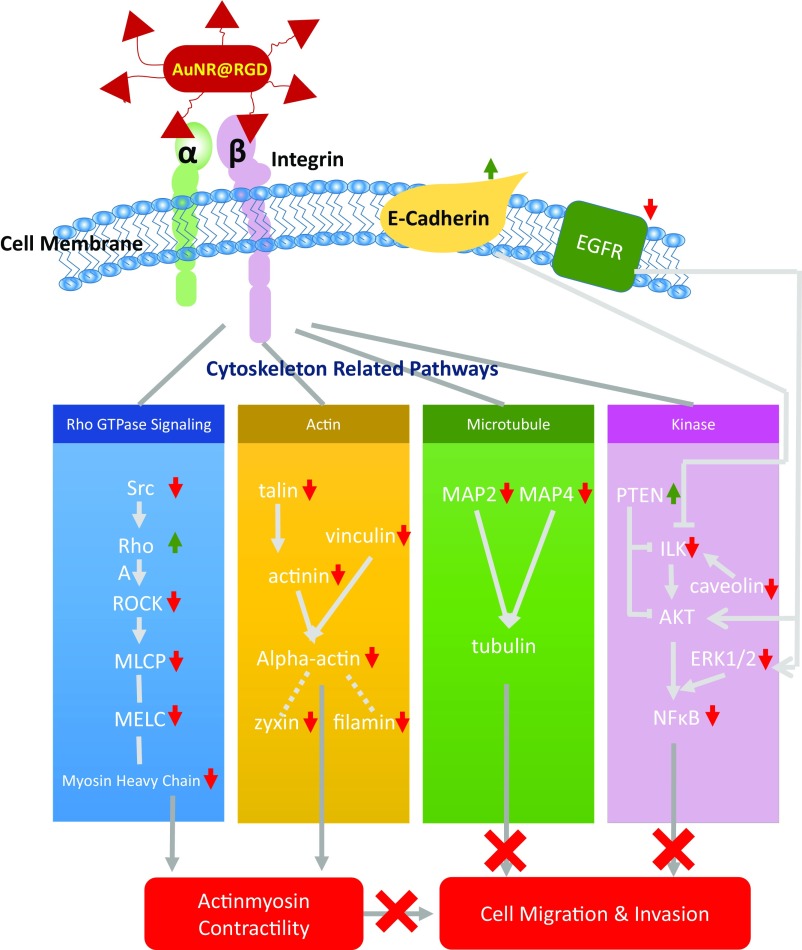
Metastasis is responsible for most cancer-related deaths, but the current clinical treatments are not effective. Recently, gold nanoparticles (AuNPs) were discovered to inhibit cancer cell migration and prevent metastasis. Rationally designed AuNPs could greatly benefit their antimigration property, but the molecular mechanisms need to be explored. Cytoskeletons are cell structural proteins that closely relate to migration, and surface receptor integrins play critical roles in controlling the organization of cytoskeletons. Herein, we developed a strategy to inhibit cancer cell migration by targeting integrins, using Arg-Gly-Asp (RGD) peptide-functionalized gold nanorods. To enhance the effect, AuNRs were further activated with 808-nm near-infrared (NIR) light to generate heat for photothermal therapy (PPTT), where the temperature was adjusted not to affect the cell viability/proliferation. Our results demonstrate changes in cell morphology, observed as cytoskeleton protrusions-i.e., lamellipodia and filopodia-were reduced after treatment. The Western blot analysis indicates the downstream effectors of integrin were attracted toward the antimigration direction. Proteomics results indicated broad perturbations in four signaling pathways, Rho GTPases, actin, microtubule, and kinases-related pathways, which are the downstream regulators of integrins. Due to the dominant role of integrins in controlling cytoskeleton, focal adhesion, actomyosin contraction, and actin and microtubule assembly have been disrupted by targeting integrins. PPTT further enhanced the remodeling of cytoskeletal proteins and decreased migration. In summary, the ability of targeting AuNRs to cancer cell integrins and the introduction of PPTT stimulated broad regulation on the cytoskeleton, which provides the evidence for a potential medical application for controlling cancer metastasis.

Keywords: cytoskeleton; gold nanorods; integrin; metastasis; plasmonic photothermal therapy.


Conflict of interest statement

The authors declare no conflict of interest.

Figures

Fig. 1.
Fig. 1.
AuNR synthesis, characterization, HSC-3 cellular uptake, and cytotoxicity study. (A) TEM image of AuNRs. (B) UV-Vis spectrum of AuNRs with different surface ligands. Black, the as-synthesized AuNRs with CTAB on the surface; blue, PEGylated AuNRs; red, AuNRs conjugated with PEG and RGD. (C) Zeta potential shows the surface charge before/after conjugations. (D–F) DF image of cells without AuNRs, incubated with AuNRs@PEG or AuNRs@RGD, respectively (representative of replicated experiments, another two sets of results in Fig. S1). (G–K) Cell viability/apoptosis/necrosis assay of cells under different treatments, using flow cytometry. Q1, necrotic cells; Q2, late apoptotic cells; Q3, early apoptotic cells; Q4, viable cells (representative of replicated experiments, statistical results in Fig. S3). (L) Western blotting for the BAX protein after four groups of treatments.
Fig. S1.
Fig. S1.
DF image of cells without AuNRs (A and D), incubated with AuNRs@PEG (B and E), or AuNRs@PEG@RGD (C and F), respectively (replicated experiments of Fig. 1 DF). (Scale bar, 50 μm.)
Fig. S2.
Fig. S2.
HSC cell uptake of AuNRs. (A) UV-Vis spectra of AuNRs before and after incubation with cells. (B–D) DIC microscopy images of cells without nanoparticle incubation (B), incubated with AuNRs@PEG (C), and incubated with AuNRs@RGD (D). (Scale bar, 20 μm.)
Fig. S3.
Fig. S3.
Apoptosis populations of HSC cells under different treatments, using flow cytometry.
Fig. 2.
Fig. 2.
Changes of cell migration rate and shapes upon AuNRs treatments. (A) Images of HSC cell movement using scratch assay (representative of replicated experiments, another set of results in Fig. S4A). (B) Changes in the cell shape using DIC images before and after AuNR or NIR treatments (representative of replicated experiments, another set of results in Fig. S4B). (C) Western-blot analysis of integrin- and migration-related proteins in AuNRs@PEG and AuNRs@RGD (with or without NIR light).
Fig. S4.
Fig. S4.
(A) Images of HSC cell movement under different conditions using scratch assay (replicated experiment). (B) Changes in the cell shape using DIC images before and after gold AuNRs or NIR treatments (replicated experiments).
Fig. 3.
Fig. 3.
Experimental results of proteomics in the four treatment groups (AuNRs@PEG, AuNRs@PEG+NIR, AuNRs@RGD, and AuNRs@RGD+NIR). (A) Heatmap showing the expression levels of all of the quantified proteins. (B) Heatmap showing identified proteins contributing to migration inhibition. (C) Bar graph showing identified significant pathways related to migration. (D) Western-blot analysis of some integrin- and migration-related proteins.
Fig. S5.
Fig. S5.
Experimental results of proteomics and data analysis. (A) Clustering analysis of samples: AuNRs@PEG, AuNRs@PEG+NIR, and control. (B) Clustering analysis of samples: AuNRs@RGD, AuNRs@RGD+NIR, and control. (C–F) Volcano plots of proteins under perturbation by (C) AuNRs@PEG, (D) AuNRs@PEG+NIR, (E) AuNRs@RGD, and (F) AuNRs@RGD+NIR. (G) Numbers of regulated/unregulated proteins identified in each experiment. (H) Venn diagram showing the comparison of differentially expressed proteins identified in each experiment.
Fig. S5.
Fig. S5.
Experimental results of proteomics and data analysis. (A) Clustering analysis of samples: AuNRs@PEG, AuNRs@PEG+NIR, and control. (B) Clustering analysis of samples: AuNRs@RGD, AuNRs@RGD+NIR, and control. (C–F) Volcano plots of proteins under perturbation by (C) AuNRs@PEG, (D) AuNRs@PEG+NIR, (E) AuNRs@RGD, and (F) AuNRs@RGD+NIR. (G) Numbers of regulated/unregulated proteins identified in each experiment. (H) Venn diagram showing the comparison of differentially expressed proteins identified in each experiment.
Fig. S6.
Fig. S6.
Key pathways perturbed by AuNRs related to cytoskeleton identified with MetaCore from Thomson Reuters. (Red) Mean up-regulation compared with control; (blue) mean down-regulation compared with control. In the thermometer sign, 1 refers to AuNRs@PEG, 2 refers to AuNRs@PEG+NIR, 3 refers to AuNRs@RGD, and 4 refers to AuNRs@RGD+NIR. The thermometers are filled to various degrees, corresponding to the amount by which the markers were up-regulated or down-regulated. (A) Pathway map of “Cell adhesion_Integrin-mediated cell adhesion and migration.” (B) Pathway map of “Cytoskeleton remodeling_Cytoskeleton remodeling.” (C) Pathway map of “Cytoskeleton remodeling_Regulation of actin cytoskeleton by Rho GTPases.” (D) Pathway map of “Cytoskeleton remodeling_TGF, WNT and cytoskeletal remodeling.”
Fig. S6.
Fig. S6.
Key pathways perturbed by AuNRs related to cytoskeleton identified with MetaCore from Thomson Reuters. (Red) Mean up-regulation compared with control; (blue) mean down-regulation compared with control. In the thermometer sign, 1 refers to AuNRs@PEG, 2 refers to AuNRs@PEG+NIR, 3 refers to AuNRs@RGD, and 4 refers to AuNRs@RGD+NIR. The thermometers are filled to various degrees, corresponding to the amount by which the markers were up-regulated or down-regulated. (A) Pathway map of “Cell adhesion_Integrin-mediated cell adhesion and migration.” (B) Pathway map of “Cytoskeleton remodeling_Cytoskeleton remodeling.” (C) Pathway map of “Cytoskeleton remodeling_Regulation of actin cytoskeleton by Rho GTPases.” (D) Pathway map of “Cytoskeleton remodeling_TGF, WNT and cytoskeletal remodeling.”
Fig. 4.
Fig. 4.
Scheme representing the mechanisms involved in inhibiting cell migration upon AuNR treatments. When the AuNRs@RGD (in red) target the alpha/beta integrins, four different cytoskeletal proteins pathways are regulated, Rho (blue), Actin (yellow), Microtubule (green), and Kinase (pink), all of which affect the cell contractility and thus inhibit cell migration (shown in red at the bottom of the figure).

References

    1. Talmadge JE, Fidler IJ. AACR centennial series: The biology of cancer metastasis: Historical perspective. Cancer Res. 2010;70:5649–5669. - PMC - PubMed
    1. Fidler IJ. The pathogenesis of cancer metastasis: The ‘seed and soil’ hypothesis revisited. Nat Rev Cancer. 2003;3:453–458. - PubMed
    1. Chaffer CL, Weinberg RA. A perspective on cancer cell metastasis. Science. 2011;331:1559–1564. - PubMed
    1. Fife CM, McCarroll JA, Kavallaris M. Movers and shakers: Cell cytoskeleton in cancer metastasis. Br J Pharmacol. 2014;171:5507–5523. - PMC - PubMed
    1. Hanahan D, Weinberg RA. Hallmarks of cancer: The next generation. Cell. 2011;144:646–674. - PubMed

Publication types

MeSH terms

LinkOut - more resources