. 2017 Jul 11;114(28):E5579-E5588.
doi: 10.1073/pnas.1700331114. Epub 2017 Jun 26.

Muscarinic receptor regulates extracellular signal regulated kinase by two modes of arrestin binding

Affiliations

Muscarinic receptor regulates extracellular signal regulated kinase by two modes of arrestin binding

Seung-Ryoung Jung et al. Proc Natl Acad Sci U S A. .

Abstract

Binding of agonists to G-protein-coupled receptors (GPCRs) activates heterotrimeric G proteins and downstream signaling. Agonist-bound GPCRs are then phosphorylated by protein kinases and bound by arrestin to trigger desensitization and endocytosis. Arrestin plays another important signaling function. It recruits and regulates activity of an extracellular signal-regulated kinase (ERK) cascade. However, molecular details and timing of ERK activation remain fundamental unanswered questions that limit understanding of how arrestin-dependent GPCR signaling controls cell functions. Here we validate and model a system that tracks the dynamics of interactions of arrestin with receptors and of ERK activation using optical reporters. Our intermolecular FRET measurements in living cells are consistent with β-arrestin binding to M1 muscarinic acetylcholine receptors (M1Rs) in two different binding modes, transient and stable. The stable mode persists for minutes after agonist removal. The choice of mode is governed by phosphorylation on key residues in the third intracellular loop of the receptor. We detect a similar intramolecular conformational change in arrestin in either binding mode. It develops within seconds of arrestin binding to the M1 receptor, and it reverses within seconds of arrestin unbinding from the transient binding mode. Furthermore, we observed that, when stably bound to phosphorylated M1R, β-arrestin scaffolds and activates MEK-dependent ERK. In contrast, when transiently bound, β-arrestin reduces ERK activity via recruitment of a protein phosphatase. All this ERK signaling develops at the plasma membrane. In this scaffolding hypothesis, a shifting balance between the two arrestin binding modes determines the degree of ERK activation at the membrane.

Keywords: ERK; GPCR; arrestin; muscarinic receptor; receptor kinase.


Conflict of interest statement

The authors declare no conflict of interest.

Figures
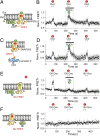
Fig. 1.
Fig. 1.
FRET reveals agonist-induced interactions of SNAP-tagged WT M1R with Gq-CFP and β-arrestin 2–CFP. Cell-permeable SNAP505 dye labeled the SNAP tag on the intracellular C terminus of M1R. P, L, and A denote the following: M1R potentiator (BQCA), Oxo, and antagonist (telenzepine), respectively. (A) Schematic for measuring FRET between Gq-CFP and M1R-SNAP505. PM indicates the plasma membrane. (B) Time course of FRETr. M1R agonist, Oxo (1 µM), increases FRET ratio (FRETr = SNAP505/CFP), and the allosteric modulator BQCA (30 µM) potentiates the response. FRETr was normalized to the value before the first agonist treatment. We conducted an average of five experiments (n = 5). Cells were pretreated with BQCA before the second application of oxotremorine as indicated by the bar. (C) Schematic for measuring the interaction between β-arrestin 2 CFP and M1R-SNAP505. (D) BQCA potentiates agonist-induced M1R and β-arrestin 2 interaction. n = 5. (E) M1R-specific antagonist telenzepine (TEL, 10 µM) inhibits the agonist-induced interaction between Gq-CFP and M1R-SNAP505. n = 5. (F) Absence of FRETr change between LDR-CFP and M1R-SNAP505. n = 3. In E and F, 100 µM Oxo was used.
Fig. 2.
Fig. 2.
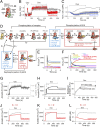
Distinguishing transient and stable binding modes of β-arrestin to WT M1R. (A) Schematic for FRET between β-arrestin 2-CFP and M1R-SNAP505 and conversion of binding modes. (B) FRETr during a two-pulse protocol reveals two binding modes [transient (T) and stable (S)] of β-arrestin 2 to WT M1R (n = 4). The fraction of stable binding of arrestin was calculated as S/(T+S). (C) Distribution histogram of FRETr discriminates two binding modes of β-arrestin to M1R. The histograms were obtained from B. The colors match with the color in B for the individual states [gray, control; green, total binding (T+S); red, stable binding (S)]. (D) Fluorescence images at the plasma membrane measured with multicolor TIRF microscopy (TIRFM). Intensities of β-arrestin 2-YFP (green) and WT M1R-SNAP647 (red) were measured along the dashed scan lines and plotted below in arbitrary units (a.u.). Asterisks mark colocalization between M1R and β-arrestin 2 after 8 min in the presence of 100 µM Oxo. (Scale bar: 2 µm.) The basal YFP fluorescence was from near the plasma membrane in our TIRF mode. The contrast of the presented images was adjusted to promote visual comparison of two colors, whereas, for the line-scan analysis, the original images without contrast changes or background subtraction were used. (E) Intermolecular FRET between β-arrestin 2–CFP and M1R-SNAP505 (n = 5). (F) Intramolecular FRET (FlAsH/CFP) in β-arrestin 2 (n = 5). The red dashed horizontal lines indicate the portion of stabilized (S) β-arrestin 2 for intermolecular FRET (E) or for intramolecular FRET (F). Dashed vertical lines mark solution exchanges. The schematic reaction diagram is our interpretation of the conformational change and stabilization of β-arrestin 2 to M1R. (G) Average association time constant estimated from intermolecular FRET shown in E (black bar, Inter) or from intramolecular FRET shown in F (blue bar, Intra) upon agonist application. (H) Average delay time before the beginning of dissociation of β-arrestin from M1R begins (black bar, Inter) or the conformational change of β-arrestin (blue bar, Intra) after removal of agonist. All experiments in this figure used 100 µM Oxo.
Fig. 3.
Fig. 3.
Stable binding of β-arrestin and its contribution to ERK activity. (A) Development of stable binding monitored with intermolecular FRET (R123L M1R-SNAP505/β-arrestin 2–CFP). n = 8. (B) The stabilized fraction of β-arrestin 2 with R123L M1R (biased M1R) or WT M1R measured as a ratio of stabilized to total (transient+stable) FRETr change. Red and black symbols compare the values estimated with R123L M1R and WT M1R, respectively (n = 3–7 for each point). Error bars are the SEM. (C) Real-time monitoring of activity of ERK (pERK) using the ERK KTR probe. Blue and red symbols denote MEK-dependent ERK activity (SI Appendix, Fig. S3A) and stabilized β-arrestin 2 (B) on the R123L M1R, respectively. MEK-dependent pERK was evaluated from the net change of the ERK KTR ratio with or without U0126 (MEK1/2 blocker, see SI Appendix, Fig. S3A). (DF) Preincubation (3 min) with GRK2/3 inhibitor, cmpd101, destabilized the β-arrestin 2 bound to R123L M1R (D, n = 7) and reduced ERK activity (E, n = 3 and n = 19). The two average traces are superimposed for comparison (F). (G and H) CK2 inhibitor, TTP22, destabilizes β-arrestin 2 WT/M1R interaction (G, n = 3) and decreased ERK activity (H, n = 4 and n = 37) compared with the control (n = 3 and n = 10; **P = 0.003). (I) Comparison of the time course of stabilization of β-arrestin to WT M1R (red) and ERK activity (blue). All experiments in this figure used 100 µM Oxo.
Fig. 4.
Fig. 4.
Role of phosphorylation on the third intracellular loop of the biased M1R for stable β-arrestin binding and ERK activation. (A) Nonphosphorylatable alanines replaced two serines (S228 and S273) in the biased M1R (R123L M1R). (B) Normalized FRETr between β-arrestin 2–CFP and R123L M1R-SNAP505 (red, n = 4). FRETr for biased M1R from Fig. 3A (gray) is presented for comparison. (C) Reduction of activated ERK in the phosphorylation-deficient biased M1R (n = 4, n = 52). The gray line indicates average pERK (SI Appendix, Fig. S3A, control) measured with the normal biased M1R. (D) Summary diagram of β-arrestin–dependent ERK activation for modeling the biased M1R. Arrestin binding to phosphorylated and nonphosphorylated receptor is indicated in the Upper and Lower rows, respectively. To describe the steady-state FRETr in control and mutant biased receptors after their activation (B), we assumed that GRK binds to the ligand-bound receptor in a manner competitive with arrestin. The relatively small pool of GRK (0.5 µM) competes with a high concentration of arrestin (15 µM). Formation of the stably bound complex with cRaf and MEK scaffold is >100 times slower than for forming the transiently and intermediately bound states. Therefore, this step, scaffolding cRaf/MEK to the arrestin-receptor complex, is a rate-limiting step for ERK activation. Abbreviations for the different states of the muscarinic receptor (R) are the following: ligand-bound receptor (RL), RL after phosphorylation at the key residues (RLpp), arrestin-bound phosphorylated receptor (RLppA), and RLppA complexed with cRaf/MEK (RLppAM). When ERK binds to RLppAM (RLppAME), MEK phosphorylates ERK (RLppAMpE). The arrestin also binds transiently to RL that lacks phosphorylation at the key residues to form RLA. Then PP produces a small pool of stably bound β-arrestin–M1R complex (RLAPP). Our simulation is able to describe time-dependent changes of each state. Change of percentile indicates the portion of the individual states before and after 8 min agonist treatment. The initial transient binding (87%) becomes significantly reduced to 13% after 8 min of agonist treatment because it gradually gives way to the stable binding mode. The final portions of stable binding to phosphorylated and nonphosphorylated receptor were 76% and 5%, respectively; i.e., the majority of stable binding of arrestin occurs with the phosphorylated receptor. (E and F) Simulated time courses of individual states from the model shown on two timescales. Ligand is added at 0 s and removed at 480 s. (GL) Fitting experimental data with our mathematical model. (G) The FRET data for arrestin binding to the biased receptor (gray symbols in B) was simulated as the total number of arrestin-bound receptors (Arrestin-R, solid line). (H) Development of stable arrestin binding by different agonist treatments (Fig. 3A and SI Appendix, Fig. S2). (I) Time course of stable arrestin binding to the biased receptor compared with the experimental FRETr data (Fig. 3B). The error bars in the experimental data are SDs. (JK) Simulated effect of the GRK blocker and mutations at the key phosphorylation sites on arrestin binding to the receptor. (J) The forward rate constant of phosphorylation (k4) was set to zero to mimic the effect of blocking GRK (Fig. 3D). (K) Mutation of phosphorylation sites changes the binding affinity of GRK to the ligand-bound receptor. The forward rate constant for binding of GRK (k3) was set to zero. The mutations accelerated arrestin binding to the receptor as measured with FRETr (red symbols in B) and as simulated (red line, K). (L) Simulated ERK phosphorylation in control or mutated (S228A/S273A) biased receptor when k3 equals to zero. **P = 0.01 and *P = 0.03 for B and C, respectively.
Fig. 5.
Fig. 5.
Simulation of WT M1R-arrestin signaling. (A) The model structure was the same as for the biased receptor, except that the receptor kinase is CK2 instead of GRK. The number of dissociated Gβγ (<50 molecules/µm2) from the activated WT M1R is estimated to be ∼100-fold lower than hydrolyzed PIs (PIP2 and PIP) and much lower than cytosolic arrestin. We did not include possible contributions of G proteins for competing with arrestin at active receptors. Rate constants for some of steps were different from those for the biased receptor (SI Appendix, Table S1), including a faster dephosphorylation of pERK by protein phosphatase complexed with RLA (RLAPP) to recapitulate the initial decreasing of pERK. (B and C) Simulated time courses of individual states from the model shown on two time scales. Some states that were too small to illustrate in the same scale were not included. (DF) Simulation of arrestin-WT M1R interaction and ERK activity. (D) Simulation of the total number of arrestin-bound receptors (black line) compared with FRETr between WT M1R and arrestin (red). (E) Development of stable binding of arrestin to WT M1R. (F) Summary of stabilized arrestin (solid circles) and ERK phosphorylation (line).

Similar articles

Cited by

References

    1. Doan T, Mendez A, Detwiler PB, Chen J, Rieke F. Multiple phosphorylation sites confer reproducibility of the rod’s single-photon responses. Science. 2006;313:530–533. - PubMed
    1. Doan T, Azevedo AW, Hurley JB, Rieke F. Arrestin competition influences the kinetics and variability of the single-photon responses of mammalian rod photoreceptors. J Neurosci. 2009;29:11867–11879. - PMC - PubMed
    1. Shukla AK, et al. Visualization of arrestin recruitment by a G-protein-coupled receptor. Nature. 2014;512:218–222. - PMC - PubMed
    1. Kang Y, et al. Crystal structure of rhodopsin bound to arrestin by femtosecond X-ray laser. Nature. 2015;523:561–567. - PMC - PubMed
    1. Jung SR, et al. Contributions of protein kinases and β-arrestin to termination of protease-activated receptor 2 signaling. J Gen Physiol. 2016;147:255–271. - PMC - PubMed

Publication types