. 2017 Oct;7(10):1098-1115.
doi: 10.1158/2159-8290.CD-17-0222. Epub 2017 Jun 26.

Immune Escape in Breast Cancer During In Situ to Invasive Carcinoma Transition

Affiliations

Immune Escape in Breast Cancer During In Situ to Invasive Carcinoma Transition

Carlos R Gil Del Alcazar et al. Cancer Discov. 2017 Oct.

Abstract

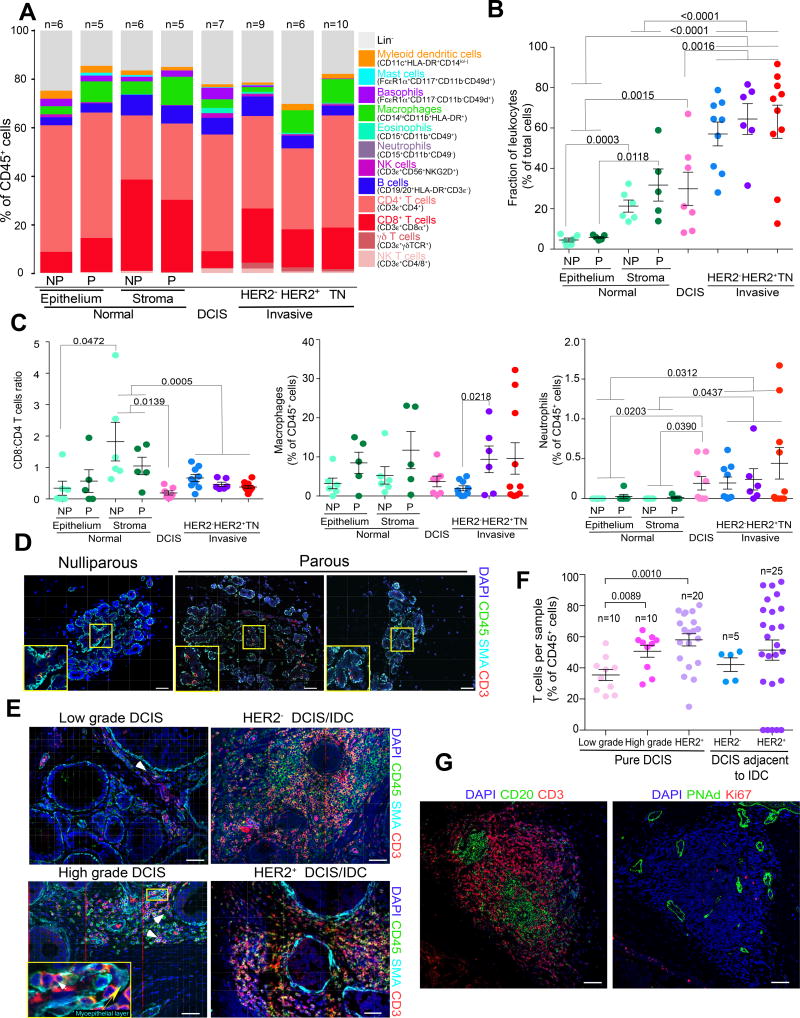
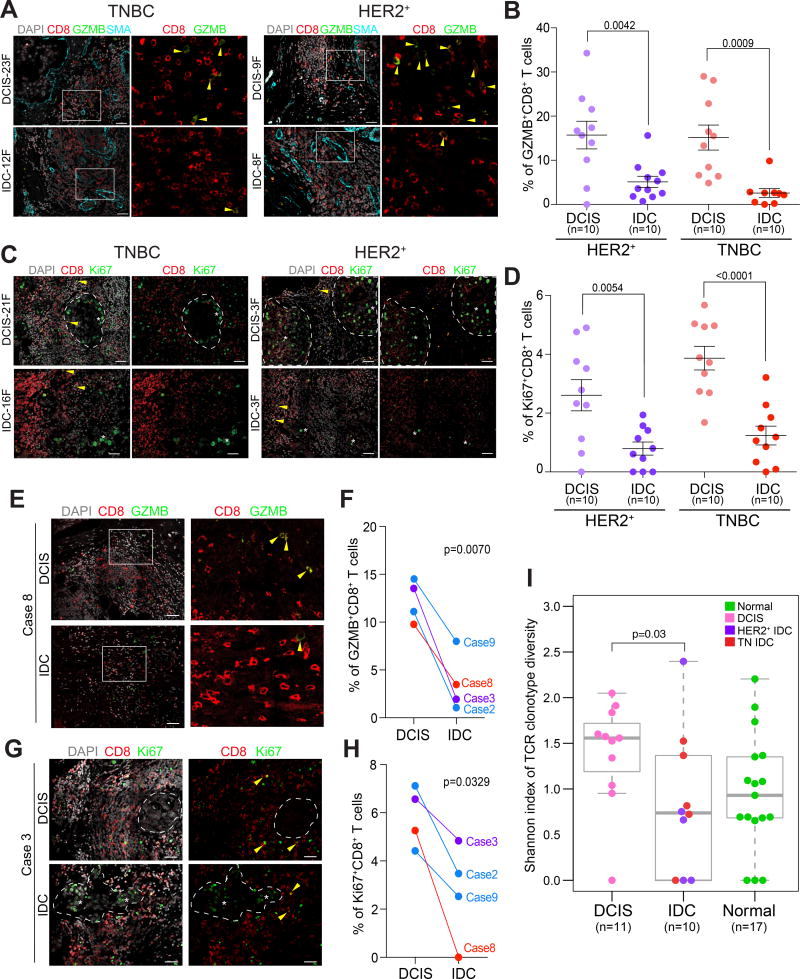
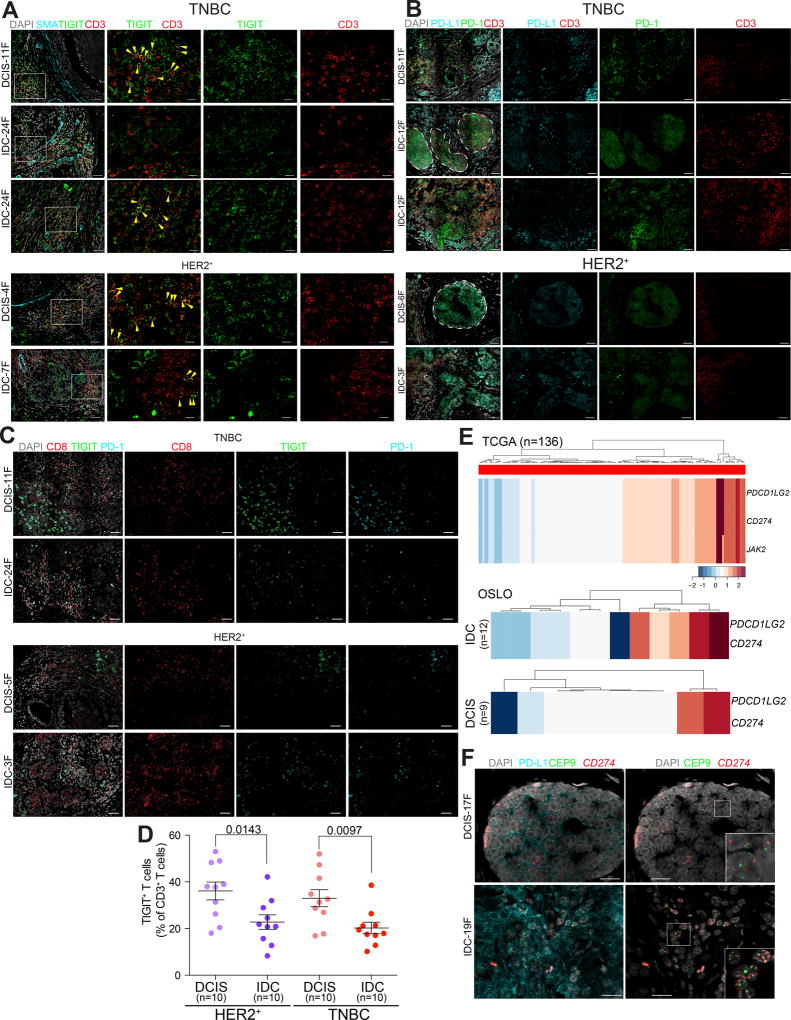
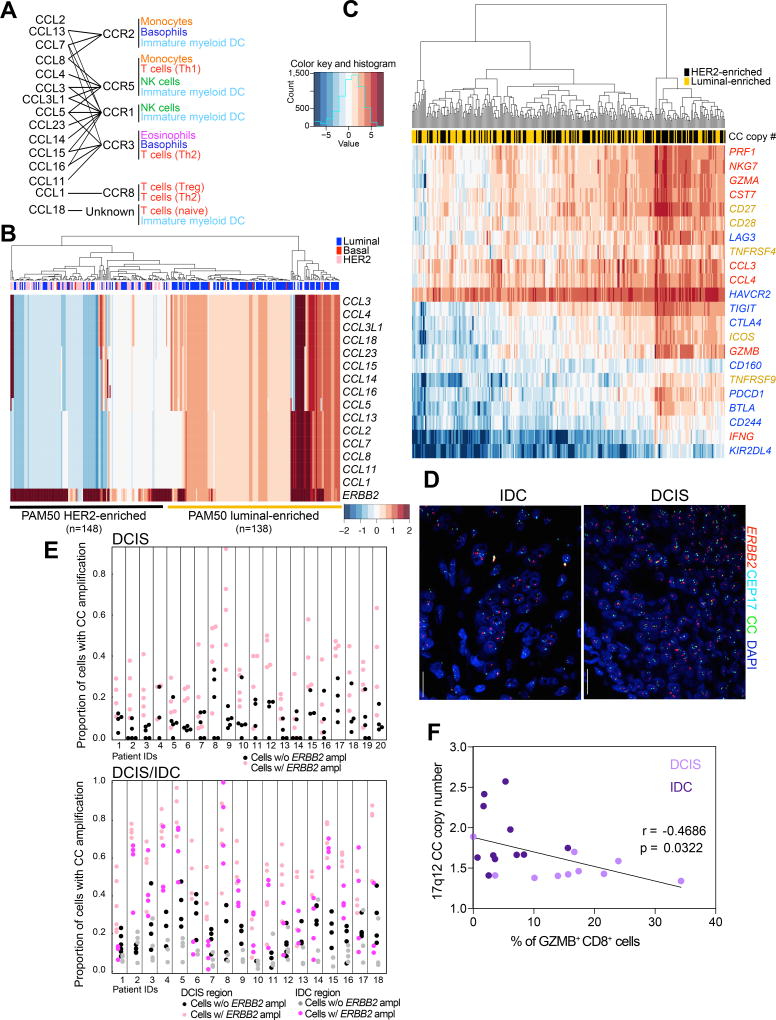
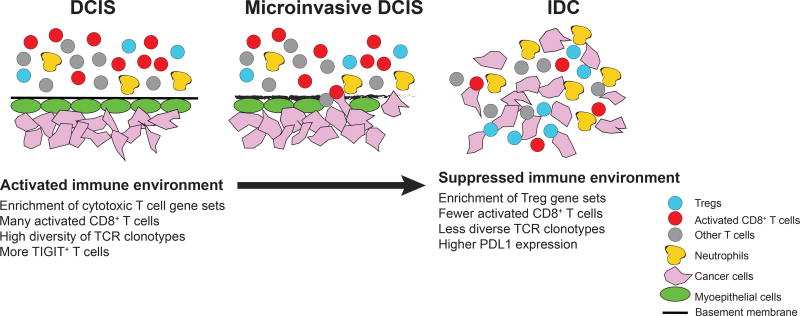
To investigate immune escape during breast tumor progression, we analyzed the composition of leukocytes in normal breast tissues, ductal carcinoma in situ (DCIS), and invasive ductal carcinomas (IDC). We found significant tissue and tumor subtype-specific differences in multiple cell types including T cells and neutrophils. Gene expression profiling of CD45+CD3+ T cells demonstrated a decrease in CD8+ signatures in IDCs. Immunofluorescence analysis showed fewer activated GZMB+CD8+ T cells in IDC than in DCIS, including in matched DCIS and recurrent IDC. T-cell receptor clonotype diversity was significantly higher in DCIS than in IDCs. Immune checkpoint protein TIGIT-expressing T cells were more frequent in DCIS, whereas high PD-L1 expression and amplification of CD274 (encoding PD-L1) was only detected in triple-negative IDCs. Coamplification of a 17q12 chemokine cluster with ERBB2 subdivided HER2+ breast tumors into immunologically and clinically distinct subtypes. Our results show coevolution of cancer cells and the immune microenvironment during tumor progression.Significance: The design of effective cancer immunotherapies requires the understanding of mechanisms underlying immune escape during tumor progression. Here we demonstrate a switch to a less active tumor immune environment during the in situ to invasive breast carcinoma transition, and identify immune regulators and genomic alterations that shape tumor evolution. Cancer Discov; 7(10); 1098-115. ©2017 AACR.See related commentary by Speiser and Verdeil, p. 1062This article is highlighted in the In This Issue feature, p. 1047.


Conflict of interest statement

Disclosure of Potential Conflicts of Interest: The authors declare no competing financial interests.

Figures

Figure 1
Figure 1
Leukocyte populations in normal and neoplastic breast tissues. In all panels: NP and P indicates normal breast of nulliparous and parous women, respectively, TN – triple negative, data are represented as mean ± S.E.M., and p-values are calculated using paired two-tailed T test. A, Summary of polychromatic FACS analyses of leukocyte populations in normal breast tissues and breast tumors. Results are shown as a percent of total CD45+ cells. B, Percentage of leukocytes in normal breast tissues and breast tumors relative to all cells. C, Ratio of CD8+/CD4+ T cells, and relative fraction of macrophages and neutrophils shown as percentage of total CD45+ cells. D–E, Immunofluorescence staining for CD45 pan-leukocyte, CD3 T cell, and smooth muscle actin (SMA) myoepithelial cell markers, and DAPI to denote nuclei of normal breast tissues (D) and DCIS and IDC (E). Images are a montage of nine fields captured from one area of the tissue. Yellow boxes on montage image magnify regions where leukocytes are located in the myoepithelium. White and yellow arrows indicate CD3+ cells and myoepithelial cell layer, respectively. Scale bar, 50 µm. F, Frequencies of T cell populations in pure DCIS and in DCIS regions of invasive cancers quantified based on immunofluorescence images. G, Examples of potential tertiary lymphoid structures in DCIS. Scale bar, 150 µm.
Figure 2
Figure 2
Gene expression profiles of T cells. In all panels: TN-triple negative, IDC – invasive ductal carcinoma, NP and P indicates normal breast of nulliparous and parous women, respectively. A, 3-D Principal Component Analysis plots of RNA-seq data. B, Heatmap depicting clustering of samples based on the expression of top differentially expressed immune-related genes with highest variance defined by both edgeR and DESeq2. C, Frequency of enrichment of a particular cell type following GSEA using the Immune c7 compendium. Significance was determined using proportionality test with multiple testing correction. D, Network of enriched immune c7 cell-type specific gene sets. Node size is reflective of number of times a T cell type appears as significantly enriched and arrow thickness is reflective of number of significant gene sets involved in a particular comparison. E, Frequency of T cell populations calculated using CIBERSORT based on RNA-seq expression data from bulk T cell samples, with difference in populations computed using ANOVA.
Figure 3
Figure 3
Activation status of CD8+ T cells. Dotted lines indicate clusters of tumor epithelial cells, yellow arrows mark double positive T cells, whereas white stars mark epithelial cells positive for the marker. A–D Immunofluorescence analysis of granzymeB (A) and Ki67 (C) expression in CD8+ T cells. SMA staining was used to mark the myoepithelial cell layer in DCIS. Images are a montage of nine fields captured from one area of the tissue. Graphs depict the frequencies of granzymeB+ (B) and Ki67+ (D) CD8+ T cells in multiple regions of ten samples per group. Error bars, S.E.M. Scale bar 50 µm. P-values are calculated using two-tailed T test. E–H, Immunofluorescence analysis of granzymeB (E) and Ki67 (G) expression in CD8+ T cells in matched DCIS and locally recurrent IDC samples. Graphs depict the frequencies of granzymeB+ (F) and Ki67+ (H) CD8+ T cells in multiple regions. Error bars, S.E.M. Scale bar 50 µm. P-values are calculated using paired two-tailed T test. I, Boxplot depicting Shannon index of TCR clonotype diversity in normal breast tissues, DCIS, and IDC. Significance of the difference between tissue types was calculated using Wilcoxon rank sum test.
Figure 4
Figure 4
Expression patterns of immune checkpoint proteins in breast tumors. A–C, Immunofluorescence analysis of the expression of TIGIT, CD3, and SMA (A), PD-L1, CD3, and PD-1 (B), and TIGIT, PD-1, and CD8 combined (C). White rectangles indicate selected areas enlarged in the adjacent panels. Yellow arrows mark T cells positive for both TIGIT and CD3. Dotted lines demarcate clusters of tumor epithelial cells. Scale bar, 50 µm. D, Quantification of TIGIT+CD3+ T cells. Multiple regions of ten samples per group were quantified. Error bars, S.E.M. P-values are calculated using two-tailed T test. E, Copy number gain for 9p24 amplicon genes in basal-like breast tumors in the TCGA and Oslo cohorts. F, Immuno-FISH analysis of PD-L1 protein levels and CD274 (encoding PD-L1) copy number in triple negative DCIS and IDC. CEP9 probe was used as control and nuclei were stained with DAPI. Scale bar 20 µm. Insets are approximately 20×20 µm. Throughout, images are a montage of nine fields captured from one area of the tissue.
Figure 5
Figure 5
Leukocytes and tumor cell heterogeneity. A, Chemokine cluster (CC) on 17q12. Genes within amplicon encoding chemokines and their receptors and responsive cell populations. B, Copy number gain for 17q12 genes and ERBB2 in HER2+ breast tumors. C, Expression of immune activation (yellow), cytotoxic (red), inhibitory and exhaustion (blue) related genes in HER2+ breast tumors with CC copy number gain (yellow) or loss (black). D, Multicolor FISH for ERBB2, Cep17, and 17q12 CC in DCIS and IDC. E, Proportion of cells with chemokine cluster amplification stratified by HER2 status (+/−) in each region of each patient from DCIS (upper panel) and DCIS/IDC (lower panel) cohorts. Cells with HER2 amplification have overall significantly higher proportion of chemokine cluster amplification (Supplementary Table S7). The magnitudes of elevation of probability of chemokine cluster amplification in HER2+ cells vary from patient to patient. F, Plot depicting correlation between 17q12 CC copy number gain and frequency of GZMB+CD8+ T cells.
Figure 6
Figure 6
Schematic model. Major changes in cell types and their activity during DCIS to IDC progression.

Comment in

References

    1. Savas P, Salgado R, Denkert C, Sotiriou C, Darcy PK, Smyth MJ, et al. Clinical relevance of host immunity in breast cancer: from TILs to the clinic. Nat Rev Clin Oncol. 2016;13:228–41. - PubMed
    1. de Visser KE, Eichten A, Coussens LM. Paradoxical roles of the immune system during cancer development. Nat Rev Cancer. 2006;6:24–37. - PubMed
    1. Schedin P, O'Brien J, Rudolph M, Stein T, Borges V. Microenvironment of the involuting mammary gland mediates mammary cancer progression. J Mammary Gland Biol Neoplasia. 2007;12:71–82. - PubMed
    1. DeNardo DG, Barreto JB, Andreu P, Vasquez L, Tawfik D, Kolhatkar N, et al. CD4(+) T cells regulate pulmonary metastasis of mammary carcinomas by enhancing protumor properties of macrophages. Cancer Cell. 2009;16:91–102. - PMC - PubMed
    1. Man YG, Sang QX. The significance of focal myoepithelial cell layer disruptions in human breast tumor invasion: a paradigm shift from the “protease-centered” hypothesis. Exp Cell Res. 2004;301:103–18. - PubMed

MeSH terms