. 2017 Jun 26;8(1):33.
doi: 10.1038/s41467-017-00044-2.

Discovery of long-range inhibitory signaling to ensure single axon formation

Affiliations

Discovery of long-range inhibitory signaling to ensure single axon formation

Tetsuya Takano et al. Nat Commun. .

Abstract

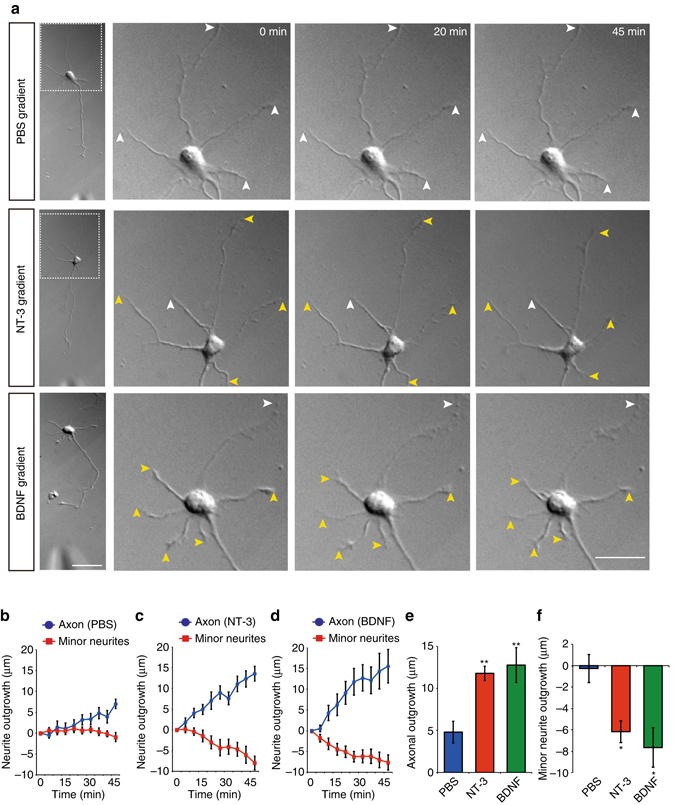
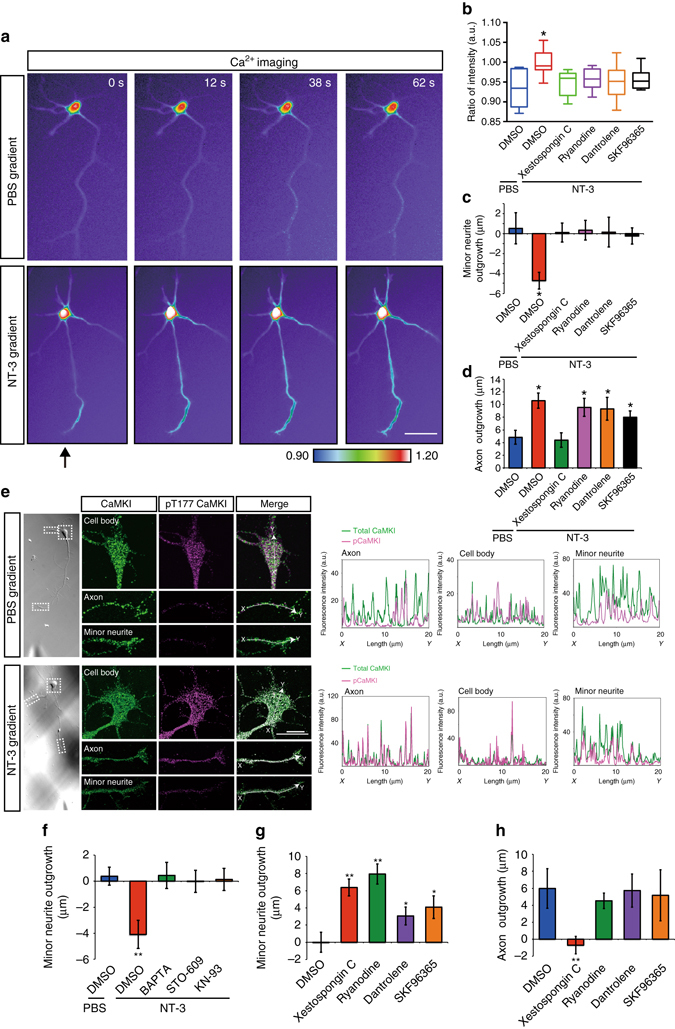
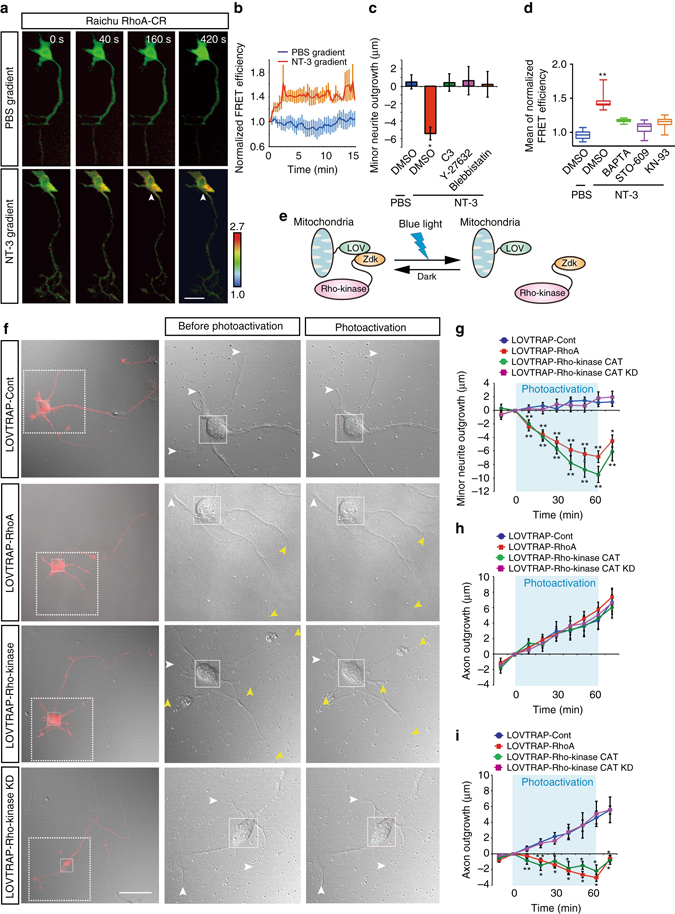
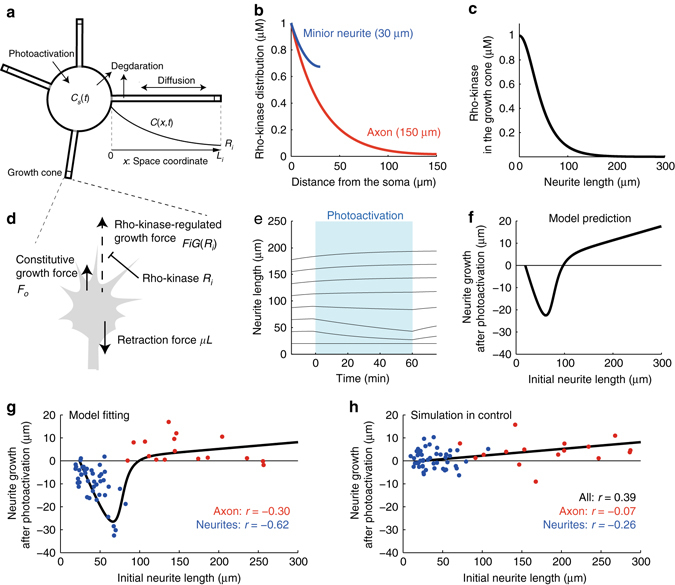
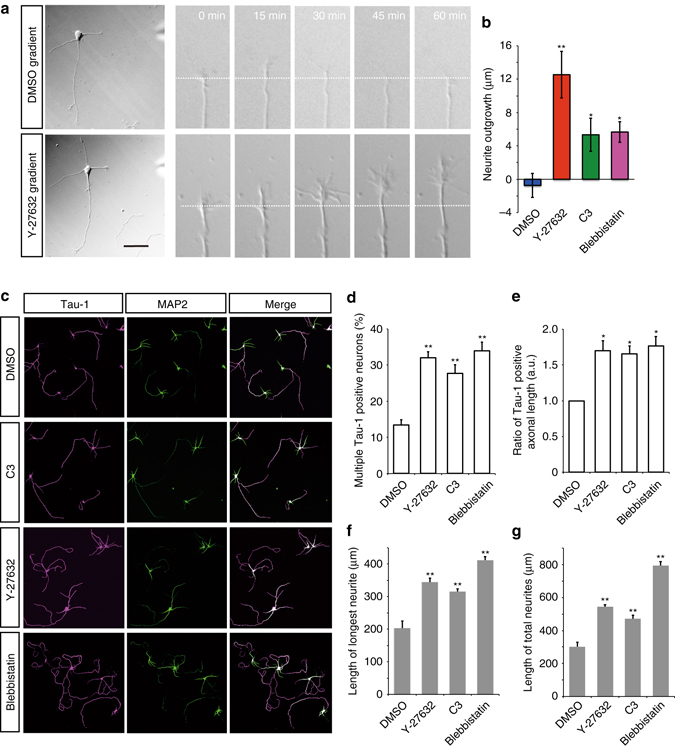
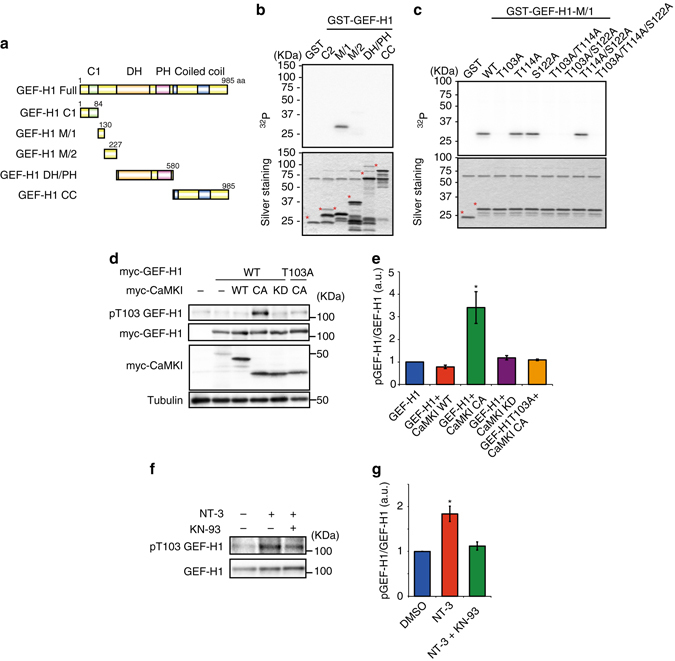
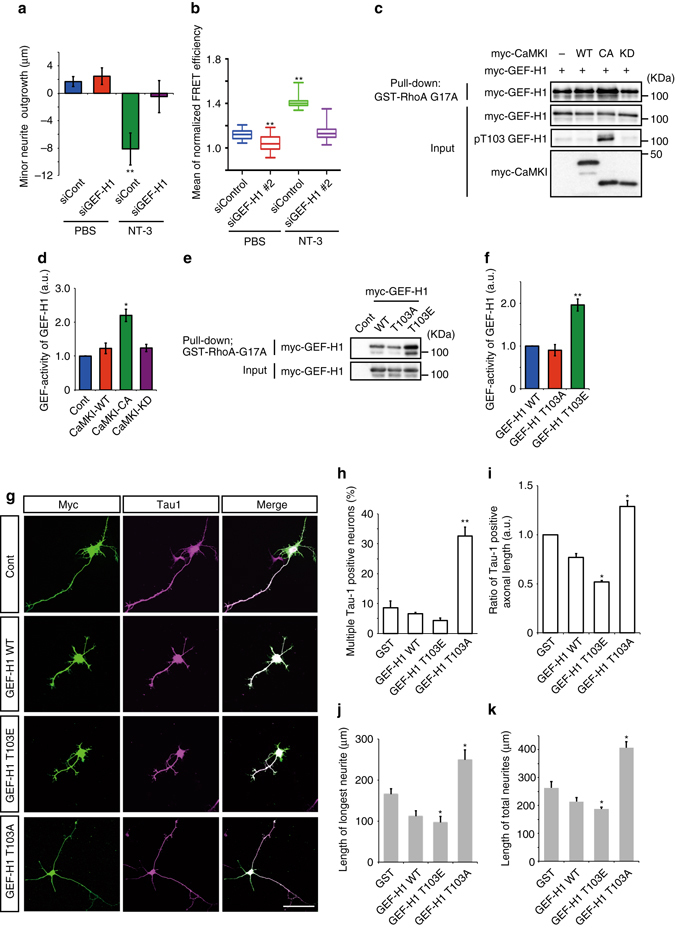
A long-standing question in neurodevelopment is how neurons develop a single axon and multiple dendrites from common immature neurites. Long-range inhibitory signaling from the growing axon is hypothesized to prevent outgrowth of other immature neurites and to differentiate them into dendrites, but the existence and nature of this inhibitory signaling remains unknown. Here, we demonstrate that axonal growth triggered by neurotrophin-3 remotely inhibits neurite outgrowth through long-range Ca2+ waves, which are delivered from the growing axon to the cell body. These Ca2+ waves increase RhoA activity in the cell body through calcium/calmodulin-dependent protein kinase I. Optogenetic control of Rho-kinase combined with computational modeling reveals that active Rho-kinase diffuses to growing other immature neurites and inhibits their outgrowth. Mechanistically, calmodulin-dependent protein kinase I phosphorylates a RhoA-specific GEF, GEF-H1, whose phosphorylation enhances its GEF activity. Thus, our results reveal that long-range inhibitory signaling mediated by Ca2+ wave is responsible for neuronal polarization.Emerging evidence suggests that gut microbiota influences immune function in the brain and may play a role in neurological diseases. Here, the authors offer in vivo evidence from a Drosophila model that supports a role for gut microbiota in modulating the progression of Alzheimer's disease.


Conflict of interest statement

The authors declare no competing financial interests.

Figures

Fig. 1
Fig. 1
Local application of neurotrophins to an axon terminal induced remote minor neurite retraction. a Local application of neurotrophins induced remote minor neurite retraction. PBS, NT-3, or BDNF was locally applied to the axon terminal of a stage 3 hippocampal neuron, and the images following this application are presented. Yellow and white arrowheads indicate the retracting and resting minor neurites, respectively. Scale bar, 50 μm. bd Time course of changes in the lengths of the axon (blue) and minor neurites (red) from a single neuron. e, f Axonal outgrowth (PBS = 14, NT-3 = 15, BDNF = 16 neurons from three independent experiments) and minor neurite outgrowth (PBS = 45, NT-3 = 39, BDNF = 31 neurites from three independent experiments) were measured. Error bars represent SEM. *P < 0.05 and **P < 0.01
Fig. 2
Fig. 2
NT-3 generated long-range Ca2+ signaling from the axon to the cell body. a Long-range Ca2+ wave. The relative change in the Cal-520 emission ratio (defined as R) was used as a measure of changes in Ca2+ concentration. The pseudocolored images represent R after local application of PBS (top) or NT-3 (bottom) to the axon (arrow). Scale bars, 50 μm. b The mean amplitude of R treat/R 0 for 90 s during local application of NT-3 in the presence of the indicated inhibitors (PBS = 10, NT-3 = 16, xestospongin C = 9, ryanodine = 15, dantrolene = 18, SKF96365 = 12 neurons from three independent experiments). c, d The axon was exposed to NT-3 in the presence of the indicated inhibitors, and then minor neurite outgrowth (PBS = 21, NT-3 = 21, xestospongin C = 26, ryanodine = 25, dantrolene = 25, SKF96365 = 24 neurites from three independent experiments) c and axonal outgrowth (PBS = 7, NT-3 = 9, xestospongin C = 9, ryanodine = 9, dantrolene = 8, SKF96365 = 8 neurons from three independent experiments) d were measured. e Local application of NT-3 increased the quantity of phospho-CaMKI in the cell body. After local application of PBS (top) or NT-3 (bottom), hippocampal neurons were immunostained with antibodies against CaMKI (green) and phospho-Thr177 of CaMKI (magenta). The merged images (right panels) are shown. The graph plots the fluorescence intensities of total CaMKI (green) and CaMKI phosphorylated at Thr177 (magenta) and in the line. Scale bars, 20 μm. f NT-3-induced minor neurite retraction was abolished by Ca2+ signaling inhibitors. The axon was exposed to NT-3 in the presence of the indicated inhibitors, and minor neurite outgrowth was measured (PBS = 27, NT-3 = 31, BAPTA = 47, STO-609 = 45, KN-93 = 40 neurites from three independent experiments). g, h Local application of indicated inhibitors to the axon. Minor neurite outgrowth (DMSO = 42, xestospongin C = 32, ryanodine = 37, dantrolene = 35, SKF96365 = 32 neurons from three independent experiments) g and axonal outgrowth (DMSO = 14, xestospongin C = 11, ryanodine = 13, dantrolene = 13, SKF96365 = 12 neurons from three independent experiments) h were measured. Error bars represent SEM. *P < 0.05 and **P < 0.01
Fig. 3
Fig. 3
Polarized activation of RhoA/Rho-kinase in the cell body was required for minor neurite retraction. a Spatio-temporal activation of RhoA in neurons. PBS (top) or NT-3 (bottom) was locally applied to the axon terminal (arrow) of a neuron expressing Raichu-RhoA-CR. The pseudocolored images represent the Raichu-RhoA-CR emission ratio. Arrowhead indicates the activation of RhoA at the cell body. Scale bar, 20 μm. b Time course of changes in FRET efficiency in the cell body. c NT-3-induced minor neurite retraction was abolished by RhoA/Rho-kinase signaling inhibitors. The axon was exposed to NT-3 in the presence of the indicated inhibitors, and minor neurite outgrowth was measured (DMSO (PBS) = 16, DMSO (NT-3) = 22, C3 = 23,Y-27632 = 28, Blebbistatin = 22 neurites from three independent experiments). d The mean amplitude of increases in FRET efficiency for 2 min during local application were measured. The FRET efficiency in the cell body was analyzed after treatment with vehicle (control) or the indicated inhibitors in the presence of NT-3 (DMSO (PBS) = 37, DMSO (NT-3) = 37, BAPTA = 37, STO-609 = 37, KN-93 = 37 neurons from three independent experiments). e Cartoon representation of the photoactivatable Rho-kinase (LOVTRAP-Rho-kinase). f Photoactivation of RhoA or Rho-kinase in the cell body induced minor neurite retraction. The cell body of a neuron coexpressing NTOM20-LOV2 with mCherry-Zdk1 (LOVTRAP-Cont), mCherry-Zdk1-RhoA Q63L (LOVTRAP-RhoA), mCherry-Rho-kinase CAT-Zdk1 (LOVTRAP-Rho-kinase), or mCherry-Rho-kinase CAT KD-Zdk1 (LOVTRAP-Rho-kinase KD) is illuminated in the 20-μm square. Representative images of neurons by photoactivation for 60 min are shown. Yellow and white arrowheads indicate the retracting and resting minor neurites, respectively. g, h Time course of changes in the lengths of minor neurites g and the axon h from a single neuron expressing LOVTRAP-Cont, LOVTRAP-RhoA, LOVTRAP-Rho-kinase, or LOVTRAP-Rho-kinase KD (LOVTRAP-Cont = 40, LOVTRAP-RhoA = 23, LOVTRAP-Rho-kinase CAT = 44, LOVTRAP-Rho-kinase CAT KD = 36 neurites from five independent experiments). i Photoactivation of RhoA or Rho-kinase in the axon induced axonal retraction. The distal part of the axon of a neuron expressing LOVTRAP-Cont, LOVTRAP-RhoA, LOVTRAP-Rho-kinase or LOVTRAP-Rho-kinase KD is illuminated (LOVTRAP-Cont = 8, LOVTRAP-RhoA = 9,LOVTRAP-Rho-kinase CAT = 9, LOVTRAP-Rho-kinase CAT KD = 9 neurons from three independent experiments). Error bars represent SEM. *P < 0.05 and **P < 0.01
Fig. 4
Fig. 4
Mathematical model for neurite outgrowth regulated by LOVTRAP-Rho-kinase. a The model neurite was modeled based on one-dimensional reaction-diffusion of LOVTRAP-Rho-kinase, which was activated in the cell body by illumination, diffused along the neurite, and was then inactivated or degraded. C s (t), C i (x,t) and R i indicate the concentrations of LOVTRAP-Rho-kinase in the cell body at time t, along the neurite at x μm from the neck of neurite i at time t, and in the growth cone, respectively. b The steady state distribution of LOVTRAP-Rho-kinase along the long axon (red line) or the short minor neurites (blue line) during photoactivation. Equation (4) was plotted. c The concentration of LOVTRAP-Rho-kinase at the tip of the neurite depended on its length, which was mathematically described by Equation (1). d Migration of the model growth cone driven by constitutive growth force, Rho-kinase-regulated growth force and retraction force. e The simulation dynamics of neurites of various lengths in response to photoactivation of LOVTRAP-Rho-kinase. Red and blue lines represent typical behaviors of the long axon and short minor neurites, respectively. f Model prediction of the relationship between initial neurite length and LOVTRAP-Rho-kinase-dependent neurite retraction. The black line was plotted by varying F i, which controls initial neurite length. g, h The neurite retraction caused by a 1-h photoactivation of LOVTRAP-Rho-kinase g and LOVTRAP-Control h was plotted against the initial length of each axon (red dots) and minor neurite (blue dots). The black lines indicate the relationship generated by a simulation in which the parameters (F o, K/C o, h, c) were adjusted for the best fit to the red and blue dots. The parameter values used are listed in Methods
Fig. 5
Fig. 5
RhoA/Rho-kinase was required for the maintenance of neuronal polarity. a Local inhibition of Rho-kinase induced minor neurite elongation. DMSO (top) or Rho-kinase inhibitor (Y-27632) (bottom) was locally applied to a minor neurite of a polarized hippocampal neuron. b Local application of Y-27632, C3 or Blebbistatin to a minor neurite. Minor neurite outgrowth was measured (Cont = 17, Y-27632 = 14, C3 = 13, Blebbistatin = 7 neurons from three independent experiments). c The effect of the RhoA/Rho-kinase signaling pathway on neuronal polarization. Hippocampal neurons at 3 DIV were treated with Y-27632, C3 or lebbistatin for 48 h. Neurons were co-immunostained at 5 DIV with anti–Tau-1 (magenta) and anti–MAP2 (green) antibodies. Representative images of neurons are shown. Scale bar, 100 μm. d The percentages of neurons with multiple Tau-1-positive axons. e Bar graphs indicate the ratio of multiple axonal lengths. f, g The lengths of the longest neurite f and the total neurites g were determined (Cont = 91, Y-27632 = 90, C3 = 90, Blebbistatin = 91 neurons from three independent experiments). Error bars represent SEM. *P < 0.05 and **P < 0.01
Fig. 6
Fig. 6
GEF-H1 is identified as a new substrate of CaMKI in the brain. a The domain structures of GEF-H1 and its various fragments are represented. b Direct phosphorylation of GEF-H1 by CaMKI. Each purified fragment of GEF-H1 was incubated with recombinant CaMKI–cat in the presence of [γ-32P]ATP in vitro. Asterisks indicate intact GST-fusion proteins. c Phosphorylation of GEF-H1 at Thr103 by CaMKI. Each purified Ala mutant of GEF-H1 was incubated with recombinant CaMKI–cat in the presence of [γ-32P]ATP in vitro. Asterisks indicate intact GST-fusion proteins. d, e Phosphorylation of GEF-H1 in COS-7 cells. GEF-H1 was co-transfected with myc-CaMKI-WT, -constitutive active form (CA) or -kinase-dead form (KD) into COS-7 cells. Cell lysates were analyzed by immunoblotting with anti-pT103, anti-myc, and anti-tubulin antibodies. f, g Phosphorylation of endogenous GEF-H1 in hippocampal neurons. Hippocampal neurons were treated with NT-3 with or without KN-93. Cell lysates were analyzed by immunoblotting with anti-pT103 and anti-GEF-H1 antibodies. Error bars represent SEM. *P < 0.05 and **P < 0.01
Fig. 7
Fig. 7
Phosphorylation of GEF-H1 by CaMKI increased its GEF activity. a NT-3-induced minor neurite retraction was abolished by knockdown of GEF-H1 (siCont/PBS = 29, siCont/NT-3 = 26, siGEF-H1#2/PBS = 23, siGEF-H1#2/NT-3 = 26 neurites from three independent experiments). b The increase in FRET efficiency in the cell body induced by NT-3 was abolished by knockdown of GEF-H1 (siCont/PBS = 5, siCont/NT-3 = 8, siGEF-H1#2/PBS = 6, siGEF-H1#2/NT-3 = 15 neurons from three independent experiments). c CaMKI increased the GEF activity of GEF-H1. GEF-H1 was co-transfected with myc-CaMKI-WT, -CA or –KD into COS-7 cells. The cell extracts were incubated with GST-RhoA-G17A-bound beads. Active GEF-H1 was pulled down and detected by immunoblotting with anti-myc (top). Total GEF-H1 and CaMKI were detected by immunoblotting with anti-myc (middle and bottom, respectively). d Bar graphs indicate the ratio of GEF-H1 activity. e The phospho-mimic mutant GEF-H1 exhibited an increment in GEF activity. Cell lysates expressing GEF-H1–WT, –T103A or –T103E were incubated with GST-RhoA-G17A-bound beads. Active (top) or total (bottom) GEF-H1 was detected by immunoblotting with an anti-myc antibody. f Bar graphs indicate the ratio of GEF-H1 activity. g myc-GST (Cont), myc-GEF-H1–WT, –T103A or –T103E was transfected into neurons at 3 DIV. Representative images of the neurons at 4 DIV are shown. Scale bars represent 100 μm. h The percentages of neurons with multiple Tau-1-positive axons. i Bar graphs indicate the ratio of multiple axonal lengths. j, k The length of the longest neurite i and the total neurite length j were determined (GST = 86, GEF-H1 WT = 90, GEF-H1 T103E = 88, GEF-H1 T103A = 90 neurons from three independent experiments). Error bars represent SEM. *P < 0.05 and **P < 0.01
Fig. 8
Fig. 8
The role of GEF-H1 in neuronal polarization in vivo a pTα-LPL-Lyn-EGFP was coelectroporated with Tα-Cre and pTα-LPL (control), pTα-LPL-GEF-H1–WT, –T103E, or –T103A into cerebral cortices at E13 followed by fixation at E16. Coronal sections were prepared and immunostained with an anti-EGFP antibody (green). Nuclei were stained with Hoechst 33342 (blue). The tracing images depict EGFP-labeled cells (bottom panels). Scale bars, 100 μm. b Quantification of the distributions of EGFP-positive cells in distinct regions of the cerebral cortex (CP and IZ). c Percentages of EGFP-positive cells with bipolar (BP) or multipolar (MP) morphologies in the cerebral cortex. d, e Percentages of trailing process-positive d or leading process-positive e neurons (pTα-LPL-EGFP = 6, pTα-LPL-GEF-H1-WT = 9, pTα-LPL-GEF-H1-T103E = 9, pTα-LPL-GEF-H1-T103A = 4 brains from three independent experiments). f pSico-mCherry-shGEF-H1 #1 or pSico-mCherry-shGEF-H1 #2 was coelectroporated with Tα-Cre and Tα-LPL-Lyn-EGFP or shRNA-resistant forms of GEF-H1 into cerebral cortices at E13 followed by fixation at E16. Coronal sections were prepared and immunostained with an anti-EGFP antibody (green). Nuclei were stained with Hoechst 33342 (blue). The tracing images showed the EGFP-labeled cells (bottom panels). Scale bars represent 100 μm. g Quantification of the distributions of EGFP-positive cells in distinct regions of the cerebral cortex (CP and IZ). h Percentages of EGFP-positive cells with bipolar (BP) or multipolar (MP) morphologies in the cerebral cortex. i, j Percentages of trailing process-positive i or leading process-positive j neurons (pSico-mCherry = 4, pSico-mCherry-shGEF-H1 #1 = 8, pSico-mCherry-shGEF-H1 #2 = 4, pTα-LPL-GEF-H1-WT Res = 5, pTα-LPL-GEF-H1-T103E Res = 13, pTα-LPL-GEF-H1-T103A Res = 10 brains from three independent experiments). Error bars represent SEM. *P < 0.05 and **P < 0.01

Similar articles

Cited by

References

    1. Arimura N, Kaibuchi K. Neuronal polarity: from extracellular signals to intracellular mechanisms. Nat. Rev. Neurosci. 2007;8:194–205. doi: 10.1038/nrn2056. - DOI - PubMed
    1. Namba T, et al. Extracellular and intracellular signaling for neuronal polarity. Physiol. Rev. 2015;95:995–1024. doi: 10.1152/physrev.00025.2014. - DOI - PubMed
    1. Takano T, Xu C, Funahashi Y, Namba T, Kaibuchi K. Neuronal polarization. Development. 2015;142:2088–2093. doi: 10.1242/dev.114454. - DOI - PubMed
    1. Craig AM, Banker G. Neuronal polarity. Annu. Rev. Neurosci. 1994;17:267–310. doi: 10.1146/annurev.ne.17.030194.001411. - DOI - PubMed
    1. Witte H, Bradke F. The role of the cytoskeleton during neuronal polarization. Curr. Opin. Neurobiol. 2008;18:479–487. doi: 10.1016/j.conb.2008.09.019. - DOI - PubMed

Publication types

MeSH terms