. 2017 Jun 26;7(1):4237.
doi: 10.1038/s41598-017-04109-6.

Identification of Jak-STAT signaling involvement in sarcoidosis severity via a novel microRNA-regulated peripheral blood mononuclear cell gene signature

Affiliations

Identification of Jak-STAT signaling involvement in sarcoidosis severity via a novel microRNA-regulated peripheral blood mononuclear cell gene signature

Tong Zhou et al. Sci Rep. .

Abstract

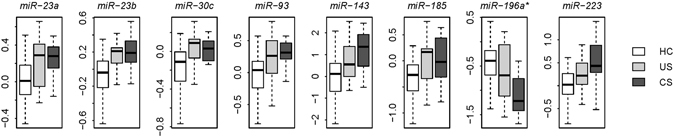
Sarcoidosis is a granulomatous lung disorder of unknown cause. The majority of individuals with sarcoidosis spontaneously achieve full remission (uncomplicated sarcoidosis), however, ~20% of sarcoidosis-affected individuals experience progressive lung disease or cardiac and nervous system involvement (complicated sarcoidosis). We investigated peripheral blood mononuclear cell (PBMC) microRNA and protein-coding gene expression data from healthy controls and patients with uncomplicated or complicated sarcoidosis. We identified 46 microRNAs and 1,559 genes that were differentially expressed across a continuum of sarcoidosis severity (healthy control → uncomplicated sarcoidosis → complicated sarcoidosis). A total of 19 microRNA-mRNA regulatory pairs were identified within these deregulated microRNAs and mRNAs, which consisted of 17 unique protein-coding genes yielding a 17-gene signature. Pathway analysis of the 17-gene signature revealed Jak-STAT signaling pathway as the most significantly represented pathway. A severity score was assigned to each patient based on the expression of the 17-gene signature and a significant increasing trend in the severity score was observed from healthy control, to uncomplicated sarcoidosis, and finally to complicated sarcoidosis. In addition, this microRNA-regulated gene signature differentiates sarcoidosis patients from healthy controls in independent validation cohorts. Our study suggests that PBMC gene expression is useful in diagnosis of sarcoidosis.


Conflict of interest statement

The authors declare that they have no competing interests.

Figures

Figure 1
Figure 1
8-miRNA signature in sarcoidosis. The eight miRNAs were differentially expressed with the severity of sarcoidosis. Y-axis indicates the miRNA expression level. HC: healthy controls; US: uncomplicated sarcoidosis; CS: complicated sarcoidosis.
Figure 2
Figure 2
17-gene signature in sarcoidosis. (A) The 17 protein-coding genes were differentially expressed with the severity of sarcoidosis. Y-axis indicates the gene expression level. HC: healthy controls; US: uncomplicated sarcoidosis; CS: complicated sarcoidosis. (B) The top five GO biological process terms associated with the 17-gene signature. The P-values were calculated by Fisher’s exact test. The dash line denotes the significance level of 0.05. (C) The top five KEGG pathway terms associated with the 17-gene signature. The P-values were calculated by Fisher’s exact test. The dash line denotes the significance level of 0.05.
Figure 3
Figure 3
The performance of the 8-miRNA signature in the sarcoidosis validation cohort. (A) The 8-miRNA signature based severity score differentiates the sarcoidosis patients from the healthy controls in the Berlin cohort. The violin plot indicates the distribution of the severity score in each category. (B) The ROC curve of the 8-miRNA signature in classifying the subjects in the Berlin cohort. The AUC is equal to one. (C) Principal component analysis on the expression of the 8-miRNA signature. X-axis: the first principal component with eigenvalue; Y-axis: the second principal component with eigenvalue.
Figure 4
Figure 4
The performance of the 17-gene signature in the validation cohorts. (A) The 17-gene signature based severity score differentiates the sarcoidosis patients from the healthy controls in the UCSF and Oregon cohorts. The violin plot indicates the distribution of the severity score in each category. (B) The ROC curves of the 17-gene signature in classifying the subjects in the UCSF and Oregon cohorts. (C) Superior predictive power of the 17-gene signature compared with random gene set. The dark grey area shows the distribution of the sum of AUC (both the validation cohorts) for the 1,000 resampled gene signatures (with the identical size as the 17-gene signature) randomly picked up from human genome. The light grey area shows the distribution of the sum of AUC for the 1,000 resampled gene signatures randomly selected from the pool of the sarcoidosis related genes. The black triangle stands for the sum of AUC of the 17-gene signature. Right-tailed P-values of the sampling distribution were calculated.

References

    1. Nunes H, Bouvry D, Soler P, Valeyre D. Sarcoidosis. Orphanet J Rare Dis. 2007;2:46. doi: 10.1186/1750-1172-2-46. - DOI - PMC - PubMed
    1. National Heart, L. A. B. I. What Is Sarcoidosis? https://www.nhlbi.nih.gov/health/health-topics/topics/sarc/.
    1. Iannuzzi, M. C., Rybicki, B. A. & Teirstein, A. S. Sarcoidosis. N Engl J Med357, 2153-2165, doi:357/21/2153 10.1056/NEJMra071714 (2007). - PubMed
    1. Newman LS, Rose CS, Maier LA. Sarcoidosis. N Engl J Med. 1997;336:1224–1234. doi: 10.1056/NEJM199704243361706. - DOI - PubMed
    1. Baudin B. [Angiotensin I-converting enzyme (ACE) for sarcoidosis diagnosis] Pathologie-biologie. 2005;53:183–188. doi: 10.1016/j.patbio.2004.09.003. - DOI - PubMed

Publication types

MeSH terms