

High-resolution 3D visualization of ductular proliferation of bile duct ligation-induced liver fibrosis in rats using x-ray phase contrast computed tomography
- PMID: 28652608
- PMCID: PMC5484700
- DOI: 10.1038/s41598-017-03993-2
High-resolution 3D visualization of ductular proliferation of bile duct ligation-induced liver fibrosis in rats using x-ray phase contrast computed tomography
Abstract
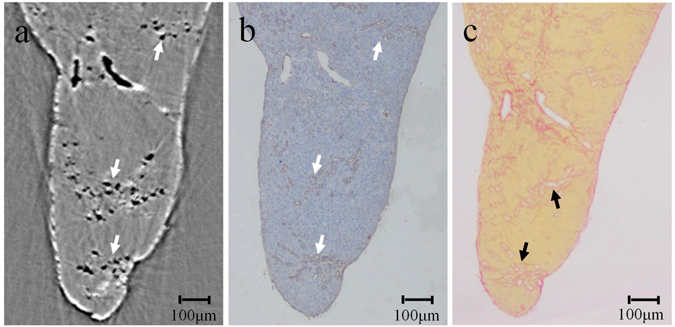
X-ray phase-contrast computed tomography (PCCT) can provide excellent image contrast for soft tissues with small density differences, and it is particularly appropriate for three-dimensional (3D) visualization of accurate microstructures inside biological samples. In this study, the morphological structures of proliferative bile ductules (BDs) were visualized without contrast agents via PCCT with liver fibrosis samples induced by bile duct ligation (BDL) in rats. Adult male Sprague-Dawley rats were randomly divided into three groups: sham operation group, 2-week and 6-week post-BDL groups. All livers were removed after euthanasia for a subsequent imaging. The verification of the ductular structures captured by PCCT was achieved by a careful head-to-head comparison with their corresponding histological images. Our experimental results demonstrated that PCCT images corresponded very well to the proliferative BDs shown by histological staining using cytokeratin 19 (CK19). Furthermore, the 3D density of proliferative BDs increased with the progression of liver fibrosis. In addition, PCCT accurately revealed the architecture of proliferative BDs in a 3D fashion, including the ductular ramification, the elongation and tortuosity of the branches, and the corrugations of the luminal duct surface. Thus, the high-resolution PCCT technique can improve our understanding of the characteristics of ductular proliferation from a new 3D perspective.
Conflict of interest statement
The authors declare that they have no competing interests.
Figures


Comment in
-
3D visualization of the biliary tree by X-ray phase-contrast computed tomography.Arch Toxicol. 2018 Dec;92(12):3601-3602. doi: 10.1007/s00204-018-2346-1. Epub 2018 Nov 20. Arch Toxicol. 2018. PMID: 30460423 No abstract available.
Similar articles
-
Three-dimensional visualization of the microvasculature of bile duct ligation-induced liver fibrosis in rats by x-ray phase-contrast imaging computed tomography.Sci Rep. 2015 Jul 27;5:11500. doi: 10.1038/srep11500. Sci Rep. 2015. PMID: 26212186 Free PMC article.
-
Insight into Bile Duct Reaction to Obstruction from a Three-dimensional Perspective Using ex Vivo Phase-Contrast CT.Radiology. 2021 Jun;299(3):597-610. doi: 10.1148/radiol.2021203967. Epub 2021 Apr 20. Radiology. 2021. PMID: 33876972
-
Phase-contrast computed tomography: A correlation study between portal pressure and three dimensional microvasculature of ex vivo liver samples from carbon tetrachloride-induced liver fibrosis in rats.Microvasc Res. 2019 Sep;125:103884. doi: 10.1016/j.mvr.2019.103884. Epub 2019 Jun 7. Microvasc Res. 2019. PMID: 31176686
-
A method of three-dimensional branching geometry to differentiate the intrahepatic vascular type in early-stage liver fibrosis using X-ray phase-contrast CT.Eur J Radiol. 2022 Mar;148:110178. doi: 10.1016/j.ejrad.2022.110178. Epub 2022 Jan 22. Eur J Radiol. 2022. PMID: 35091166
-
Three-dimensional visualization of fibrous tissues in cirrhotic rats via X-ray phase-contrast computed tomography with iodine staining.J Synchrotron Radiat. 2019 Jul 1;26(Pt 4):1354-1360. doi: 10.1107/S1600577519006064. Epub 2019 Jun 20. J Synchrotron Radiat. 2019. PMID: 31274464
Cited by
-
Multiscale reconstruction of various vessels in the intact murine liver lobe.Commun Biol. 2022 Mar 24;5(1):260. doi: 10.1038/s42003-022-03221-2. Commun Biol. 2022. PMID: 35332265 Free PMC article.
-
Use of the volume-averaged Murray's deviation method for the characterization of branching geometry in liver fibrosis: a preliminary study on vascular circulation.Quant Imaging Med Surg. 2022 Feb;12(2):979-991. doi: 10.21037/qims-21-47. Quant Imaging Med Surg. 2022. PMID: 35111599 Free PMC article.
-
Characterization of microvessels and parenchyma in in-line phase contrast imaging CT: healthy liver, cirrhosis and hepatocellular carcinoma.Quant Imaging Med Surg. 2019 Jun;9(6):1037-1046. doi: 10.21037/qims.2019.06.12. Quant Imaging Med Surg. 2019. PMID: 31367557 Free PMC article.
-
Vascular branching geometry relating to portal hypertension: a study of liver microvasculature in cirrhotic rats by X-ray phase-contrast computed tomography.Quant Imaging Med Surg. 2020 Jan;10(1):116-127. doi: 10.21037/qims.2019.11.04. Quant Imaging Med Surg. 2020. PMID: 31956535 Free PMC article.
-
Fine-scale visualizing the hierarchical structure of mouse biliary tree with fluorescence microscopy method.Biosci Rep. 2020 May 29;40(5):BSR20193757. doi: 10.1042/BSR20193757. Biosci Rep. 2020. PMID: 32364232 Free PMC article.
References
Publication types
MeSH terms
LinkOut - more resources
Full Text Sources
Other Literature Sources
Medical
