. 2017 May 28:15:541-558.
doi: 10.1016/j.nicl.2017.05.017. eCollection 2017.

Acute effects and after-effects of acoustic coordinated reset neuromodulation in patients with chronic subjective tinnitus

Affiliations

Acute effects and after-effects of acoustic coordinated reset neuromodulation in patients with chronic subjective tinnitus

Ilya Adamchic et al. Neuroimage Clin. .

Abstract

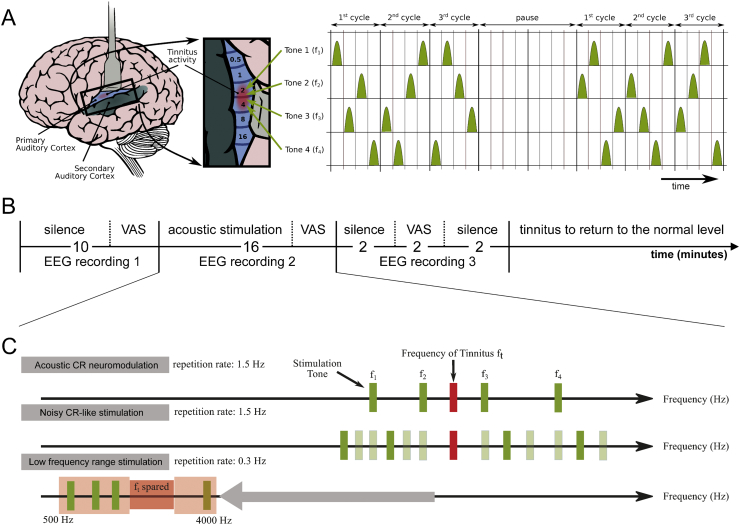
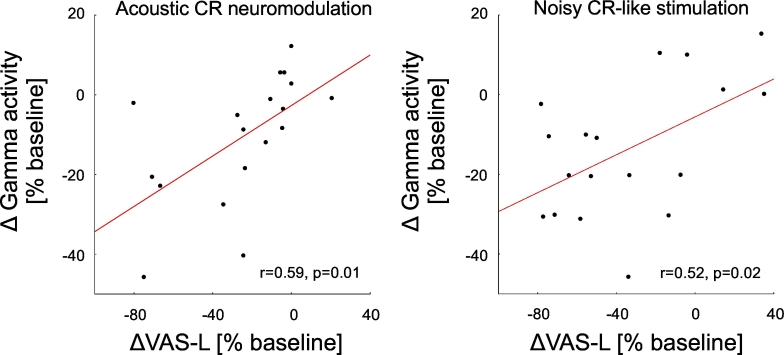
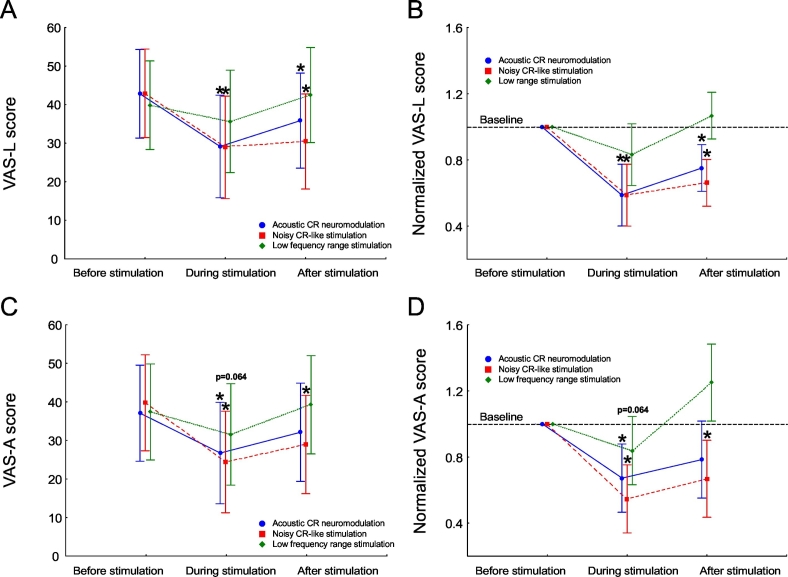
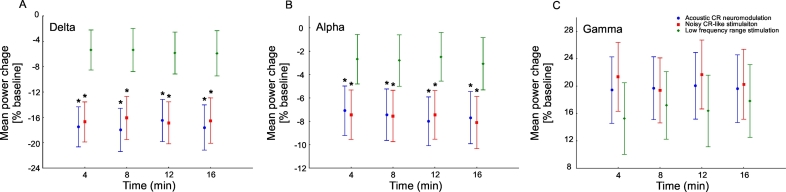
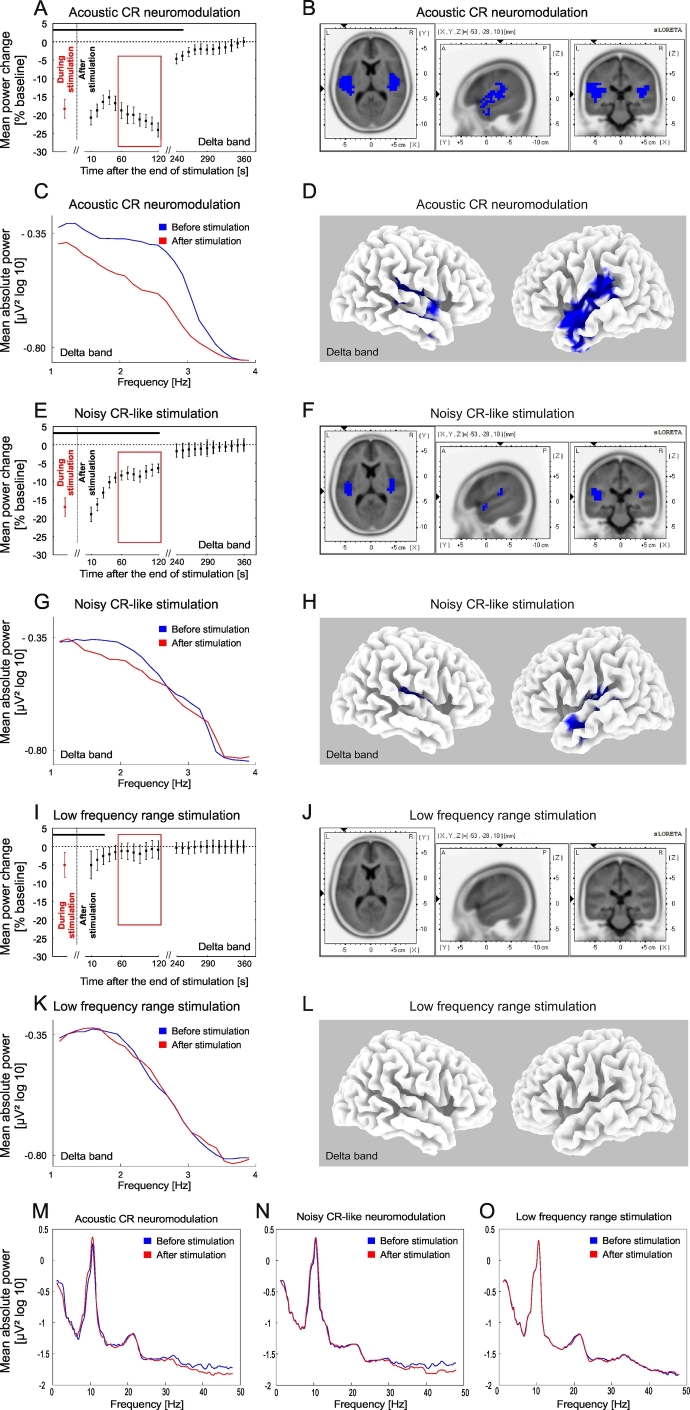
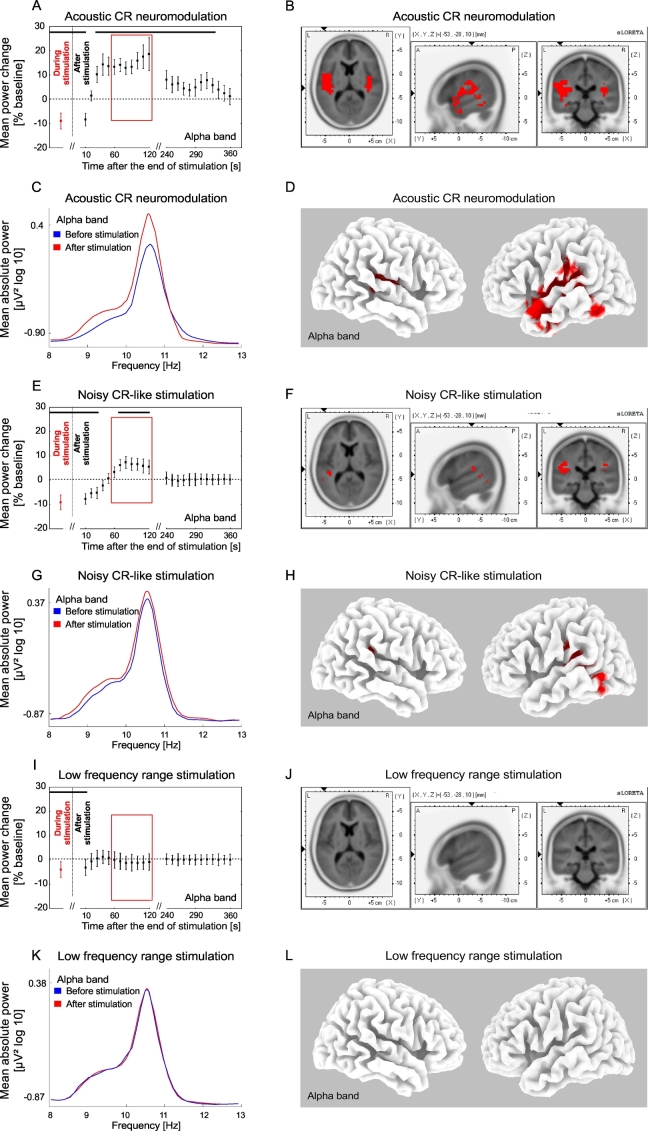
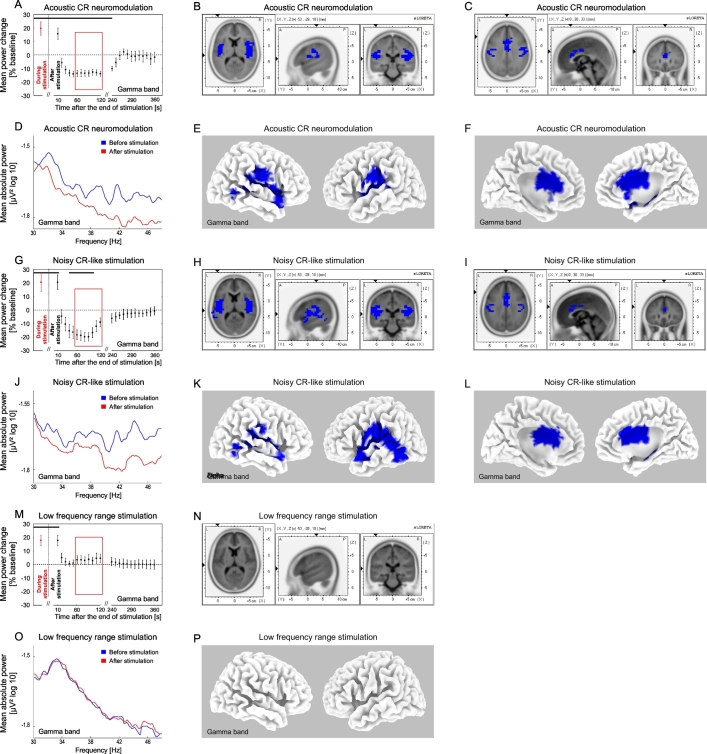
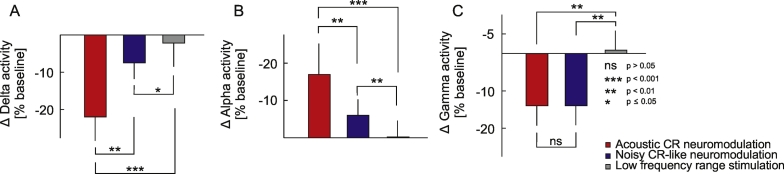
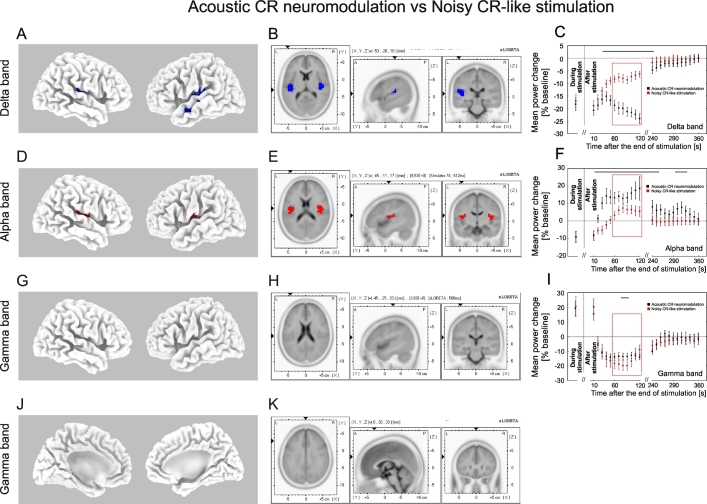
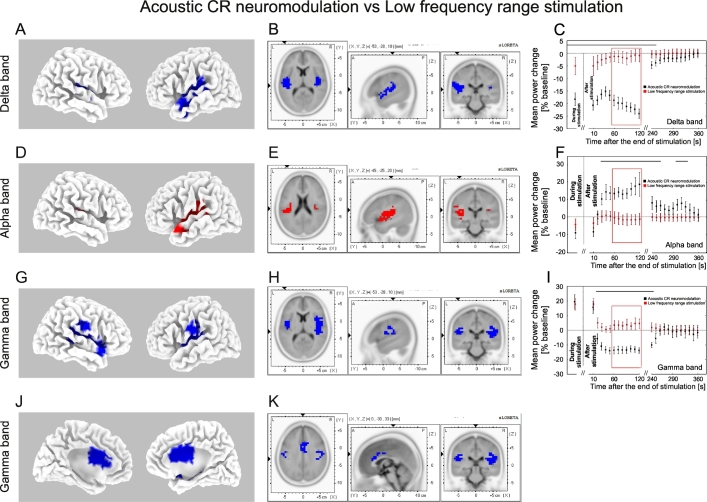
Chronic subjective tinnitus is an auditory phantom phenomenon characterized by abnormal neuronal synchrony in the central auditory system. As shown computationally, acoustic coordinated reset (CR) neuromodulation causes a long-lasting desynchronization of pathological synchrony by downregulating abnormal synaptic connectivity. In a previous proof of concept study acoustic CR neuromodulation, employing stimulation tone patterns tailored to the dominant tinnitus frequency, was compared to noisy CR-like stimulation, a CR version significantly detuned by sparing the tinnitus-related pitch range and including substantial random variability of the tone spacing on the frequency axis. Both stimulation protocols caused an acute relief as measured with visual analogue scale scores for tinnitus loudness (VAS-L) and annoyance (VAS-A) in the stimulation-ON condition (i.e. 15 min after stimulation onset), but only acoustic CR neuromodulation had sustained long-lasting therapeutic effects after 12 weeks of treatment as assessed with VAS-L, VAS-A scores and a tinnitus questionnaire (TQ) in the stimulation-OFF condition (i.e. with patients being off stimulation for at least 2.5 h). To understand the source of the long-lasting therapeutic effects, we here study whether acoustic CR neuromodulation has different electrophysiological effects on oscillatory brain activity as compared to noisy CR-like stimulation under stimulation-ON conditions and immediately after cessation of stimulation. To this end, we used a single-blind, single application, cross over design in 18 patients with chronic tonal subjective tinnitus and administered three different 16-minute stimulation protocols: acoustic CR neuromodulation, noisy CR-like stimulation and low frequency range (LFR) stimulation, a CR type stimulation with deliberately detuned pitch and repetition rate of stimulation tones, as control stimulation. We measured VAS-L and VAS-A scores together with spontaneous EEG activity pre-, during- and post-stimulation. Under stimulation-ON conditions acoustic CR neuromodulation and noisy CR-like stimulation had similar effects: a reduction of VAS-L and VAS-A scores together with a decrease of auditory delta power and an increase of auditory alpha and gamma power, without significant differences. In contrast, LFR stimulation had significantly weaker EEG effects and no significant clinical effects under stimulation-ON conditions. The distinguishing feature between acoustic CR neuromodulation and noisy CR-like stimulation were the electrophysiological after-effects. Acoustic CR neuromodulation caused the longest significant reduction of delta and gamma and increase of alpha power in the auditory cortex region. Noisy CR-like stimulation had weaker and LFR stimulation hardly any electrophysiological after-effects. This qualitative difference further supports the assertion that long-term effects of acoustic CR neuromodulation on tinnitus are mediated by a specific disruption of synchronous neural activity. Furthermore, our results indicate that acute electrophysiological after-effects might serve as a marker to further improve desynchronizing sound stimulation.

Keywords: Alpha band activity; Coordinated reset neuromodulation; Delta band activity; Electroencephalography; Gamma band activity.


Figures

Fig. 1
Fig. 1
Scheme of the experimental paradigm and the three types of acoustic stimulation. (A) CR stimulation pattern: for acoustic CR neuromodulation, we employ the tonotopic organization of the primary auditory cortex (left panel, brain adapted from (Chittka and Brockmann, 2005) with kind permission of the authors) and deliver brief sinusoidal tones of different frequencies (pitch) f1, …, f4 equidistantly in time at a cycle repetition rate of 1.5 Hz (Tass et al., 2012a). Three CR cycles, each comprising a randomized sequence of four tones (right panel), were followed by two silent cycles without stimuli (“pause”). The 3 cycles stim ON-2 cycles stim OFF pattern was repeated periodically (Tass and Majtanik, 2006, Tass, 2003a, Tass, 2003b, Lysyansky et al., 2011). Right panel from (Tass et al., 2012a) with kind permission by the authors. Copyright by Forschungszentrum Jülich GmbH. (B) Experimental session: during the first 10 min of silence, the baseline EEG was recorded and the baseline VAS-L and VAS-A scores were obtained. Thereafter one of the three stimulation paradigms, i.e. acoustic CR neuromodulation, noisy CR-like stimulation or LFR stimulation, was performed for 16 min. VAS-L and VAS-A were obtained during stimulation at the end of this stimulation period. During the next period of silence EEG recording was obtained for 2 min followed by the VAS-L and VAS-A evaluation (2 min) and another 2 min of rest EEG recording. After each session participants received a pause during which tinnitus returned to the normal level. Thereafter the next session was started. (C) Stimulus tones and repetition rates of acoustic CR neuromodulation, noisy CR-like stimulation and low frequency range stimulation (explanation see text). Panel partly redrawn from (Tass et al., 2012a) with kind permission by the authors.
Fig. 8
Fig. 8
Correlation between changes of the gamma current source density (CSD) after the end of acoustic stimulation and changes of the subjective tinnitus loudness. Significant negative correlation between relative changes of gamma power of current source density (CSD) in the auditory cortex ROI (BAs 41 and 42; sLORETA) (for the time period 60–120 s after the end of the stimulation as compared to baseline) and the relative change of the subjective tinnitus loudness after acoustic CR neuromodulation (r = 0.59, p = 0.01; A) and the noisy CR-like stimulation (r = 0.52, p = 0.02; B).
Fig. 2
Fig. 2
Tinnitus loudness and annoyance pre-, during- and post-stimulation. Mean intensity rating of tinnitus (0 = tinnitus is inaudible, 100 = tinnitus is extremely loud/annoying) for all 18 subjects. Significant changes of the tinnitus loudness and tinnitus annoyance as compared to baseline are marked with asterisk. Error bars indicate the 2 × SEM.
Fig. 3
Fig. 3
Changes of spectral power of auditory cortex source activity (BESA) during acoustic stimulation. Time course of the mean delta (1–4 Hz), alpha (8–12 Hz) and gamma (30–48 Hz) auditory cortex power during acoustic CR neuromodulation (blue), noisy CR-like stimulation (red) and low frequency range stimulation (green) expressed as a percentage change from baseline activity. There was a significant change in the auditory cortex power during all types of acoustic stimulation in all frequency bands. Significant changes of the auditory cortex power during acoustic CR neuromodulation and the noisy CR-like stimulation as compared to the auditory cortex power changes during LFR stimulation are marked with asterisk. Error bars indicate the 2 × SEM.
Fig. 4
Fig. 4
Changes of the delta power of auditory cortex source activity (BESA) and current source density (sLORETA) after the end of acoustic stimulation. Time course of the mean delta (1–4 Hz) power of the auditory source activity (determined with BESA) during (averaged over the whole stimulation period, red) and after the end (black) of acoustic CR neuromodulation (A), the noisy CR-like stimulation (E) and the LFR stimulation (I) expressed as a percentage change from the baseline activity. Significant changes with respect to baseline are marked with the horizontal black line (A, E, I). As there was no significant main effect for time during stimulation for any of the stimulation types and frequency bands (see Fig. 3), power spectra of the auditory source activity (BESA) during stimulation were averaged over the whole stimulation period (A, E, I). Error bars indicate the 2 × SEM. Power spectra for the delta frequency range of the auditory source activity (BESA) at baseline and for the time period 60–120 s (inside the red window in A, E, I) after cessation of the acoustic CR neuromodulation (C), the noisy CR-like stimulation (G) and the LFR stimulation (K). The effect of acoustic CR neuromodulation (B, D), the noisy CR-like stimulation (F, H) and the LFR stimulation (J, L) on the mean current source density were analyzed by sLORETA (results are presented for the time period 60–120 s after the end of the stimulation; inside the red window). The strongest decrease (indicated by blue voxels) compared to baseline was localized in the left transverse temporal gyrus after acoustic CR neuromodulation (xyz − 51, − 19, 11; BA 41). Power spectra of the auditory source activity (BESA) at baseline and for the time period 60–120 s for acoustic CR neuromodulation (M), the noisy CR-like stimulation (N) and the LFR stimulation (O).
Fig. 5
Fig. 5
Changes of the alpha power after the end of acoustic stimulation. Time course of the mean alpha (8–13 Hz) power of the auditory BESA source activity during (averaged over the whole stimulation period, red) and after the end (black) of acoustic CR neuromodulation (A), the noisy CR-like stimulation (E) and the LFR stimulation (I) expressed as a percentage change from the baseline activity. Significant changes are marked with the horizontal black line (A, E, I). Format as in Fig. 4. Power spectra for the alpha frequency range at baseline and for the time period 60–120 s (inside the red window in A, E, I) after end of the acoustic CR neuromodulation (C), the noisy CR-like stimulation (G) and the LFR stimulation (K). The effect of acoustic CR neuromodulation (B, D), the noisy CR-like stimulation (F, H) and the LFR stimulation (J, L) on the mean current source density analyzed by sLORETA (format as in Fig. 4). The strongest increase compared to baseline (indicated by red voxels) was localized in the left and right transverse temporal gyrus after acoustic CR neuromodulation (xyz − 40, − 29, 9; BA 41).
Fig. 6
Fig. 6
Changes of the gamma power after the end of acoustic stimulation. Time course of the mean gamma (30–48 Hz) power of the auditory BESA source activity during (averaged over the whole stimulation period, red) and after the end (black) of acoustic CR neuromodulation (A), the noisy CR-like stimulation (G) and the LFR stimulation (M) expressed as a percentage change from the baseline activity. Significant changes are marked with the horizontal black line (A, G, M). Format as in Fig. 4. Power spectra for the gamma frequency range at baseline and for the time period 60–120 s (inside the red window in A, G, M) after end of the acoustic CR neuromodulation (D), the noisy CR-like stimulation (J) and the LFR stimulation (O). The effect of acoustic CR neuromodulation (B, C, E, F), noisy CR-like stimulation (H, I, K, L) and the LFR stimulation (N, P) on the mean current source density analyzed by sLORETA (format as in Fig. 4). The strongest decrease compared to baseline (indicated by blue voxels) was localized in the left and right superior temporal gyrus after the noisy CR-like stimulation (xyz 37, − 28, 9; BA 41).
Fig. 7
Fig. 7
Effects of acoustic CR neuromodulation, the noisy CR-like stimulation and the LFR stimulation on the mean current source density in the auditory cortex region. The current source density (CSD) changes in the auditory cortex ROI (BAs 41 and 42; sLORETA) for the time period 60–120 s after the end of the stimulation as compared to baseline averaged over both hemispheres. Error bars indicate the 2 × SEM.
Fig. 9
Fig. 9
Differential changes of EEG power for the acoustic CR neuromodulation and noisy CR-like stimulation. The effect of acoustic CR neuromodulation on the time-averaged mean current source density analyzed by sLORETA as compared to the noisy CR-like stimulation (results are presented for the time window 60–120 s after the end of the stimulation; inside the red window (C, F, I)): Delta decrease (indicated by blue voxels) was significantly greater after acoustic CR neuromodulation as compared to the noisy CR-like stimulation (A, B). Alpha increase (indicated by red voxels) was significantly greater after acoustic CR neuromodulation as compared to the noisy CR-like stimulation (D, E). There was no significant differences in the gamma band power change between acoustic CR neuromodulation and the noisy CR-like stimulation (G, H, J, K). Time course of the mean delta (C), alpha (F) and gamma (I) power during (averaged over the whole stimulation period) and after the end of acoustic CR neuromodulation (black) and the noisy CR-like stimulation (red) expressed as a percentage change from the baseline activity. Significant differences in power between acoustic CR neuromodulation and the noisy CR-like stimulation are marked with the horizontal black line on the top of the plot (C, F, I).
Fig. 10
Fig. 10
Differential changes of EEG power for the acoustic CR neuromodulation and LFR-stimulation. The effect of acoustic CR neuromodulation on the sLORETA mean current source density as compared to the LFR-stimulation (format as in Fig. 9). Delta decrease (indicated by blue voxels) was significantly greater after acoustic CR neuromodulation as compared to the LFR-stimulation (A, B). Alpha increase (indicated by red voxels) was significantly greater after acoustic CR neuromodulation as compared to the LFR-stimulation (D, E). Gamma decrease (indicated by blue voxels) was significantly greater after acoustic CR neuromodulation as compared to the LFR-stimulation (G, H, J, K). Time course of the mean delta (C), alpha (F) and gamma (I) power during (averaged over the whole stimulation period) and after the end of acoustic CR neuromodulation (black) and the LFR-stimulation (red) expressed as a percentage change from the baseline activity. Significant differences in power between acoustic CR neuromodulation and the LFR-stimulation are marked with the horizontal black line on the top of the plot (C, F, I).
Supplementary Fig. 1
Supplementary Fig. 2

References

    1. Adamchic I., Langguth B., Hauptmann C., Tass P.A. Psychometric evaluation of visual analog scale for the assessment of chronic tinnitus. Am. J. Audiol. 2012;21(2):215–225. - PubMed
    1. Adamchic I., Toth T., Hauptmann C., Tass P.A. Reversing pathologically increased EEG power by acoustic coordinated reset neuromodulation. Hum. Brain Mapp. 2014;35:2099–2118. - PMC - PubMed
    1. Adamchic I., Hauptmann C., Barnikol U.B., Pawelcyk N., Popovych O.V., Barnikol T., Silchenko A.N., Volkmann J., Deuschl G., Meissner W., Maarouf M., Sturm V., Freund H.-J., Tass P.A. Coordinated reset has lasting aftereffects in patients with Parkinson's disease. Mov. Disord. 2014;29:1679. - PMC - PubMed
    1. Adjamian P., Sereda M., Zobay O., Hall D.A., Palmer A.R. Neuromagnetic indicators of tinnitus and tinnitus masking in patients with and without hearing loss. J. Assoc. Res. Otolaryngol. 2012;13(5):715–731. - PMC - PubMed
    1. Benjamini Y., Hochberg Y. Controlling the false discovery rate - a practical and powerful approach to multiple testing. J. R. Stat. Soc. Ser. B Stat Methodol. 1995;57(1):289–300.

Publication types