. 2017 Jun 27:6:e26030.
doi: 10.7554/eLife.26030.

Replication Study: The common feature of leukemia-associated IDH1 and IDH2 mutations is a neomorphic enzyme activity converting alpha-ketoglutarate to 2-hydroxyglutarate

Collaborators, Affiliations

Replication Study: The common feature of leukemia-associated IDH1 and IDH2 mutations is a neomorphic enzyme activity converting alpha-ketoglutarate to 2-hydroxyglutarate

Megan Reed Showalter et al. Elife. .

Abstract

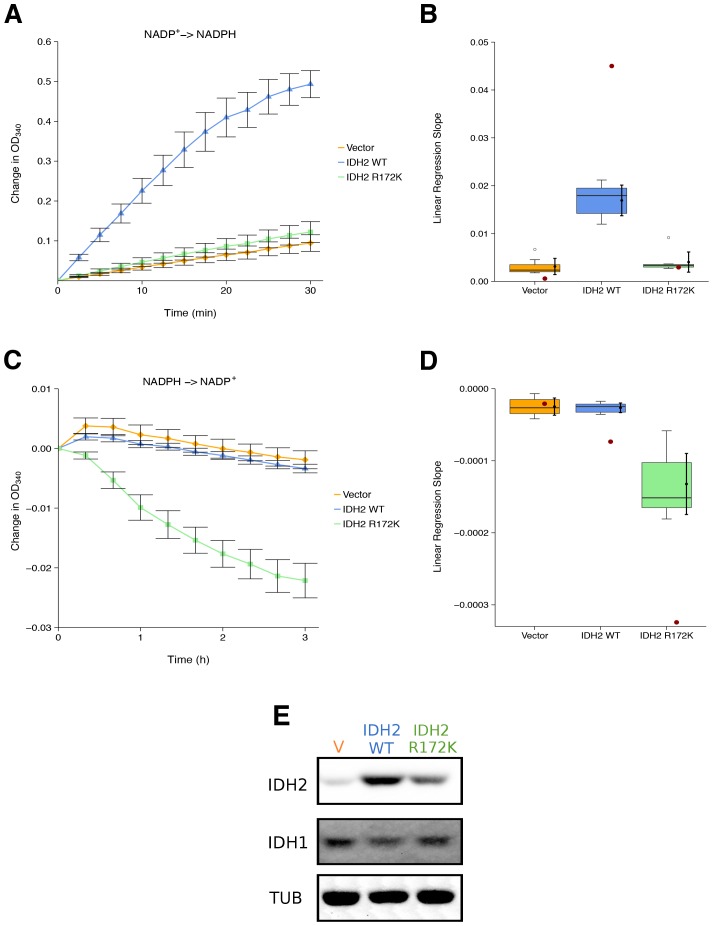
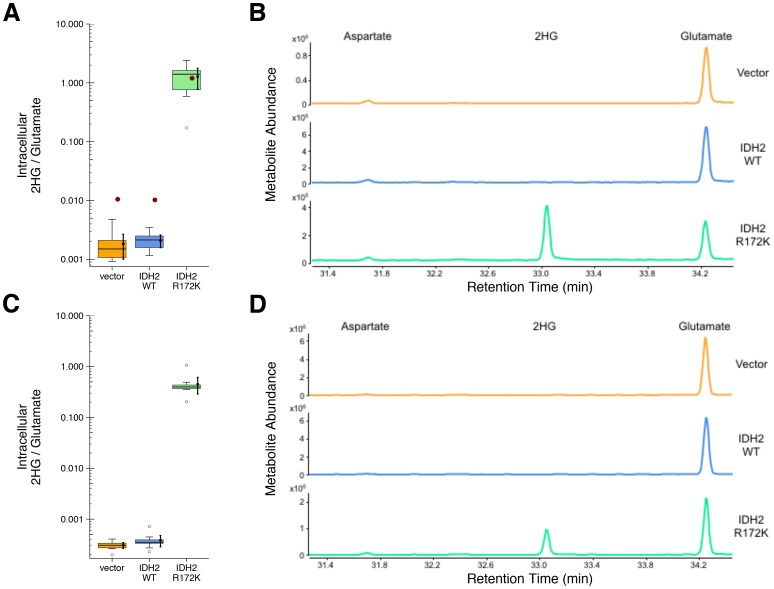
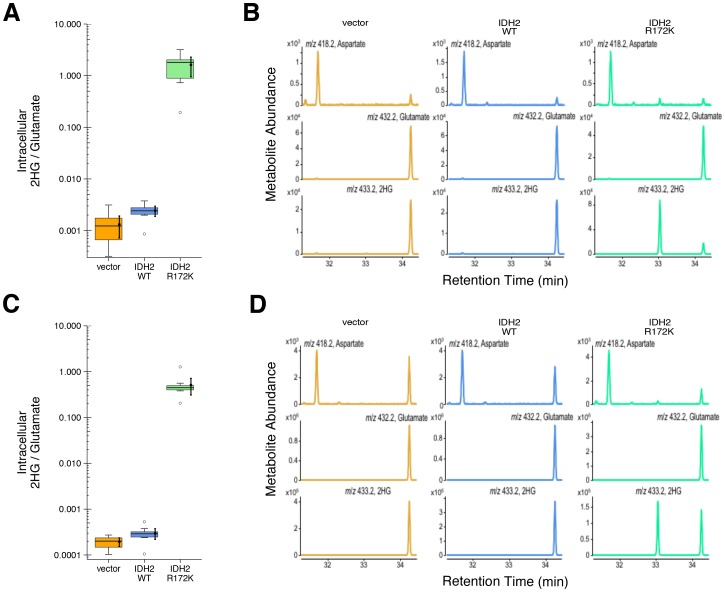
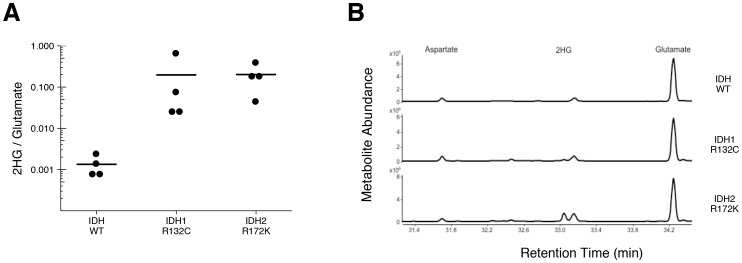
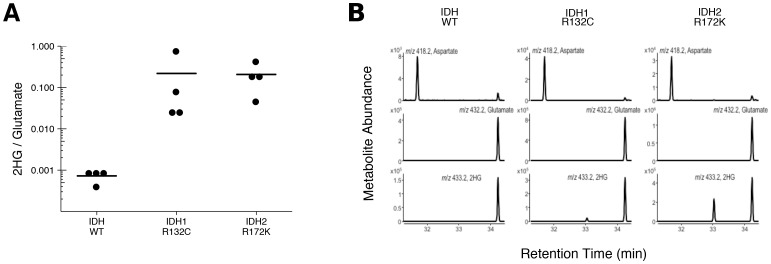
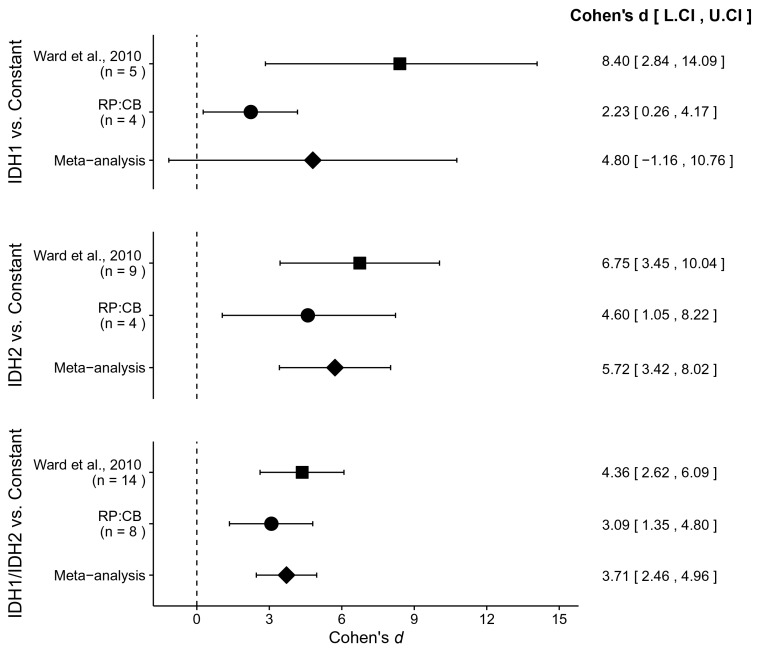
In 2016, as part of the Reproducibility Project: Cancer Biology, we published a Registered Report (Fiehn et al., 2016), that described how we intended to replicate selected experiments from the paper "The common feature of leukemia-associated IDH1 and IDH2 mutations is a neomorphic enzyme activity converting alpha-ketoglutarate to 2-hydroxyglutarate" (Ward et al., 2010). Here, we report the results of those experiments. We found that cells expressing R172K mutant IDH2 did not display isocitrate-dependent NADPH production above vector control levels, in contrast to the increased production observed with wild-type IDH2. Conversely, expression of R172K mutant IDH2 resulted in increased alpha-ketoglutarate-dependent consumption of NADPH compared to wild-type IDH2 or vector control. These results are similar to those reported in the original study (Figure 2; Ward et al., 2010). Further, expression of R172K mutant IDH2 resulted in increased 2HG levels within cells compared to the background levels observed in wild-type IDH2 and vector control, similar to the original study (Figure 3D; Ward et al., 2010). In primary human AML samples, the 2HG levels observed in samples with mutant IDH1 or IDH2 status were higher than those observed in samples without an IDH mutation, similar to what was observed in the original study (Figure 5C; Ward et al., 2010). Finally, we report meta-analyses for each result.

Keywords: 2-HG; Reproducibility Project: Cancer Biology; acute myeloid leukemia; biochemistry; cancer biology; human; metascience; replication; reproducibility.


Conflict of interest statement

MRS: West Coast Metabolomics Center, University of California, Davis is a Science Exchange associated lab.

TC: West Coast Metabolomics Center, University of California, Davis is a Science Exchange associated lab.

OF: West Coast Metabolomics Center, University of California, Davis is a Science Exchange associated lab.

RP:CB: EI, NP: Employed by and hold shares in Science Exchange Inc.

The other authors declare that no competing interests exist.

Figures

Figure 1.
Figure 1.. Isocitrate-dependent NADPH production and alpha-ketoglutarate-dependent NADPH consumption of wild-type or R172 mutant IDH2.
IDH oxidative and reductive activity assays were performed on lysates of HEK293T cells transfected with wild-type or R172K mutant IDH2, or empty vector. (A) Lysates were assessed for generation of NADPH from NADP+ in the presence of 0.4 mM isocitrate over the indicated time course. Mean change in OD340 from the beginning of each assay (time = 0) is reported for each biological repeat performed [n = 7] and error bars represent s.e.m. (B) Linear regression slopes were determined for each biological repeat of the isocitrate-dependent NADPH production assay. Box and whisker plot with median represented as the line through the box and whiskers representing values within 1.5 IQR of the first and third quartile. Means as black dot and bold error bars represent 95% CI. Linear regression slope determined from the data estimated from the representative experiment reported in Figure 2A of Ward et al. (2010) is displayed as a single point (red circle) for comparison. Statistical analysis was performed on data generated during this replication attempt. Wild-type IDH2 compared to vector control: Wilcoxon-Mann-Whitney test; Z = 3.13, uncorrected p=0.00058, Bonferroni corrected p=0.0023. R172K mutant IDH2 compared to vector control: Wilcoxon-Mann-Whitney test; Z = 1.60, uncorrected p=0.13, Bonferroni corrected p=0.51. (C) Lysates were assessed for consumption of NADPH in the presence of 1 mM alpha-ketoglutarate over the indicated time course. Mean change in OD340 from the beginning of each assay (time = 0) is reported for each biological repeat performed [n = 7] and error bars represent s.e.m. (D) Linear regression slopes were determined for each biological repeat of the alpha-ketoglutarate-dependent NADPH consumption assay. Box and whisker plot with median represented as the line through the box and whiskers representing values within 1.5 IQR of the first and third quartile. Means as black dot and bold error bars represent 95% CI. Linear regression slope determined from the data estimated from the representative experiment reported in Figure 2B of Ward et al. (2010) is displayed as a single point (red circle) for comparison. Statistical analysis was performed on data generated during this replication attempt. Wild-type IDH2 compared to vector control: Welch’s t-test; t(9.42) = 0.29, uncorrected p=0.78, Bonferroni corrected p>0.99. R172K mutant IDH2 compared to vector control: Welch’s t-test; t(6.95) = 5.97, uncorrected p=0.00058, Bonferroni corrected p=0.0023. (E) Representative Western blots probed with an anti-IDH1 antibody, an anti-IDH2 antibody, and an anti-alpha-Tubulin antibody. Additional details for this experiment can be found at https://osf.io/6ve4d/. DOI: http://dx.doi.org/10.7554/eLife.26030.002
Figure 2.
Figure 2.. 2HG levels within cells expressing wild-type or R172K mutant IDH2.
HEK293T cells transfected with wild-type or R172K mutant IDH2, or empty vector, were analyzed for intracellular metabolites. (A) Cells harvested 48 hr after transfection had organic acids extracted, purified, and derivatized with MTBSTFA before analysis by GC-MS. Quantitation of 2HG signal intensity relative to glutamate was determined using the TIC for each biological repeat [n = 10]. Box and whisker plot with median represented as the line through the box and whiskers representing values within 1.5 IQR of the first and third quartile. Means as black dot and bold error bars represent 95% CI. Data estimated from the representative experiment reported in Figure 3D of Ward et al. (2010) is displayed as a single point (red circle) for comparison. Statistical analysis was performed on log10 transformed data generated during this replication attempt. R172K mutant IDH2 values were compared to the largest value observed in cells expressing vector control or wild-type IDH2 (0.005). One-sample t-test; t(9) = 21.9, uncorrected p=4.14×10⁻⁹, Bonferroni corrected p=8.28×10⁻⁹. (B) Representative TIC from samples harvested at 48 hr after transfection for vector control (top panel), wild-type IDH2 (middle panel), and R172K mutant IDH2 (bottom panel). The derivatized organic acids eluting between 31.4 and 34.4 min are shown, including aspartate (31.7 min), 2HG (33.1 min), and glutamate (34.3 min) based on spectra of derivatized commercial standards. (C) Cells harvested 24 hr after transfection were processed and analyzed similar to the 48 hr samples with [n = 10] biological repeats. Box and whisker plot with median represented as the line through the box and whiskers representing values within 1.5 IQR of the first and third quartile. Means as black dot and bold error bars represent 95% CI. R172K mutant IDH2 values were compared to the largest value observed in cells expressing vector control or wild-type IDH2 (0.001). One-sample Wilcoxon signed-rank test on log10 transformed data; V = 55, uncorrected p=0.0020, Bonferroni corrected p=0.0039. (D) Representative TIC from samples harvested at 24 hr after transfection for vector control (top panel), wild-type IDH2 (middle panel), and R172K mutant IDH2 (bottom panel). Additional details for this experiment can be found at https://osf.io/9ge2a/. DOI: http://dx.doi.org/10.7554/eLife.26030.003
Figure 2—figure supplement 1.
Figure 2—figure supplement 1.. 2HG levels within cells based on EIC analysis.
This is the same experiment as in Figure 2, but with quantitation of 2HG signal intensity relative to glutamate determined using the EIC for each biological repeat. (A) Box and whisker plot with mean and 95% CI reported for each sample harvested 48 hr after transfection. R172K mutant IDH2 values were compared to the largest value observed in cells expressing vector control or wild-type IDH2 (0.004). One-sample t-test; t(9) = 22.4, uncorrected p=3.38×10⁻⁹, Bonferroni corrected p=6.77×10⁻⁹. (B) Representative EIC from samples harvested at 48 hr after transfection for vector control (left panels), wild-type IDH2 (middle panels), and R172K mutant IDH2 (right panels) with aspartate, glutamate, and 2HG shown. (C) Box and whisker plot with mean and 95% CI reported for each sample harvested 24 hr after transfection. R172K mutant IDH2 values were compared to the largest value observed in cells expressing vector control or wild-type IDH2 (0.001). One-sample Wilcoxon signed-rank test on log10 transformed data; V = 55, uncorrected p=0.0020, Bonferroni corrected p=0.0039. (D) Representative EIC from samples harvested at 24 hr after transfection for vector control (left panels), wild-type IDH2 (middle panels), and R172K mutant IDH2 (right panels) with aspartate, glutamate, and 2HG shown. Additional details for this experiment can be found at https://osf.io/9ge2a/. DOI: http://dx.doi.org/10.7554/eLife.26030.004
Figure 3.
Figure 3.. 2HG levels in AML patient samples.
AML patient peripheral blood or bone marrow samples were analyzed for intracellular metabolites. Cells had organic acids extracted, purified, and derivatized with MTBSTFA before analysis by GC-MS. Patient samples were prescreened for IDH genotypic status prior to metabolite analysis. (A) Quantitation of 2HG signal intensity relative to glutamate was determined using the TIC for each sample. Dot plot with means reported as crossbars. One-sample t-tests on log10 transformed data comparing 2HG/glutamate level of samples to a constant of 0.0024 (2HG/glutamate threshold between IDH mutant and wild-type IDH samples). Samples with an IDH1 mutation compared to the threshold constant: t(3) = 4.47, uncorrected p=0.021, Bonferroni corrected p=0.063. Samples with an IDH2 mutation compared to the threshold constant: t(3) = 9.19, uncorrected p=0.0027, Bonferroni corrected p=0.0082. Samples with an IDH1 or IDH2 mutation compared to the threshold constant: t(7) = 8.73, uncorrected p=5.20×10⁻⁵, Bonferroni corrected p=1.56×10⁻⁴. (B) Representative TIC from samples without an IDH mutation (top panel), samples with an IDH1 mutation (middle panel), and samples with an IDH2 mutation (bottom panel). The derivatized organic acids eluting between 31.4 and 34.4 min are shown, including aspartate (31.7 min), 2HG (33.1 min), and glutamate (34.3 min) based on spectra of derivatized commercial standards. Additional details for this experiment can be found at https://osf.io/smdfr/. DOI: http://dx.doi.org/10.7554/eLife.26030.005
Figure 3—figure supplement 1.
Figure 3—figure supplement 1.. 2HG levels in AML patient samples based on EIC analysis.
This is the same experiment as in Figure 3, but with quantitation of 2HG signal intensity relative to glutamate determined using the EIC for each AML patient sample. (A) Dot plot with means reported as crossbars. One-sample t-tests on log10 transformed data comparing 2HG/glutamate level of samples to a constant of 0.001 (2HG/glutamate threshold between IDH mutant and wild-type IDH samples). Samples with an IDH1 mutation compared to the threshold constant: t(3) = 5.40, uncorrected p=0.012, Bonferroni corrected p=0.037. Samples with an IDH2 mutation compared to the threshold constant: t(3) = 10.93, uncorrected p=0.0016, Bonferroni corrected p=0.0049. Samples with an IDH1 or IDH2 mutation compared to the threshold constant: t(7) = 10.44, uncorrected p=1.61×10⁻⁵, Bonferroni corrected p=4.84×10⁻⁵. (B) Representative EIC from samples without an IDH mutation (top panel), samples with an IDH1 mutation (middle panel), and samples with an IDH2 mutation (bottom panel) with aspartate, glutamate, and 2HG shown. Additional details for this experiment can be found at https://osf.io/smdfr/. DOI: http://dx.doi.org/10.7554/eLife.26030.006
Figure 4.
Figure 4.. Meta-analyses of each effect.
Effect size and 95% confidence interval are presented for Ward et al. (2010), this replication study (RP:CB), and a random effects meta-analysis of those two effects. Sample sizes used in Ward et al. (2010) and this replication attempt are reported under the study name. Random effects meta-analysis of AML patient samples with an IDH1 mutation compared to a constant representing the 2HG/glutamate threshold between IDH mutant and wild-type IDH samples detected in the study (original: 0.01; replication: 0.0024) (meta-analysis p=0.114), AML patient samples with an IDH2 mutation compared to the threshold constant (meta-analysis p=1.12×10⁻⁶), and AML patient samples with an IDH1 or IDH2 mutation compared to the threshold constant (meta-analysis p=5.73×10⁻⁹). Additional details for these meta-analyses can be found at https://osf.io/4m3n8/. DOI: http://dx.doi.org/10.7554/eLife.26030.007

References

    1. Allwood JW, Erban A, de Koning S, Dunn WB, Luedemann A, Lommen A, Kay L, Löscher R, Kopka J, Goodacre R. Inter-laboratory reproducibility of fast gas chromatography-electron impact-time of flight mass spectrometry (GC-EI-TOF/MS) based plant metabolomics. Metabolomics. 2009;5:479–496. doi: 10.1007/s11306-009-0169-z. - DOI - PMC - PubMed
    1. An Z, Ganji SK, Tiwari V, Pinho MC, Patel T, Barnett S, Pan E, Mickey BE, Maher EA, Choi C. Detection of 2-hydroxyglutarate in brain tumors by triple-refocusing MR spectroscopy at 3T in vivo. Magnetic Resonance in Medicine. 2016;14:1522–2594. doi: 10.1002/mrm.26347. - DOI - PMC - PubMed
    1. Andronesi OC, Rapalino O, Gerstner E, Chi A, Batchelor TT, Cahill DP, Sorensen AG, Rosen BR. Detection of oncogenic IDH1 mutations using magnetic resonance spectroscopy of 2-hydroxyglutarate. Journal of Clinical Investigation. 2013;123:3659–3663. doi: 10.1172/JCI67229. - DOI - PMC - PubMed
    1. Borger DR, Goyal L, Yau T, Poon RT, Ancukiewicz M, Deshpande V, Christiani DC, Liebman HM, Yang H, Kim H, Yen K, Faris JE, Iafrate AJ, Kwak EL, Clark JW, Allen JN, Blaszkowsky LS, Murphy JE, Saha SK, Hong TS, Wo JY, Ferrone CR, Tanabe KK, Bardeesy N, Straley KS, Agresta S, Schenkein DP, Ellisen LW, Ryan DP, Zhu AX. Circulating oncometabolite 2-hydroxyglutarate is a potential surrogate biomarker in patients with isocitrate dehydrogenase-mutant intrahepatic cholangiocarcinoma. Clinical Cancer Research. 2014;20:1884–1890. doi: 10.1158/1078-0432.CCR-13-2649. - DOI - PMC - PubMed
    1. Carbonneau M, M Gagné L, Lalonde ME, Germain MA, Motorina A, Guiot MC, Secco B, Vincent EE, Tumber A, Hulea L, Bergeman J, Oppermann U, Jones RG, Laplante M, Topisirovic I, Petrecca K, Huot MÉ, Mallette FA, Gagné M, Guiot A, Secco M-C, Tumber EE, Jones U, Huot K. The oncometabolite 2-hydroxyglutarate activates the mTOR signalling pathway. Nature Communications. 2016;7:12700. doi: 10.1038/ncomms12700. - DOI - PMC - PubMed