. 2017 Jun 27:8:15904.
doi: 10.1038/ncomms15904.

Caffeine inhibits hypothalamic A1R to excite oxytocin neuron and ameliorate dietary obesity in mice

Affiliations

Caffeine inhibits hypothalamic A1R to excite oxytocin neuron and ameliorate dietary obesity in mice

Liufeng Wu et al. Nat Commun. .

Abstract

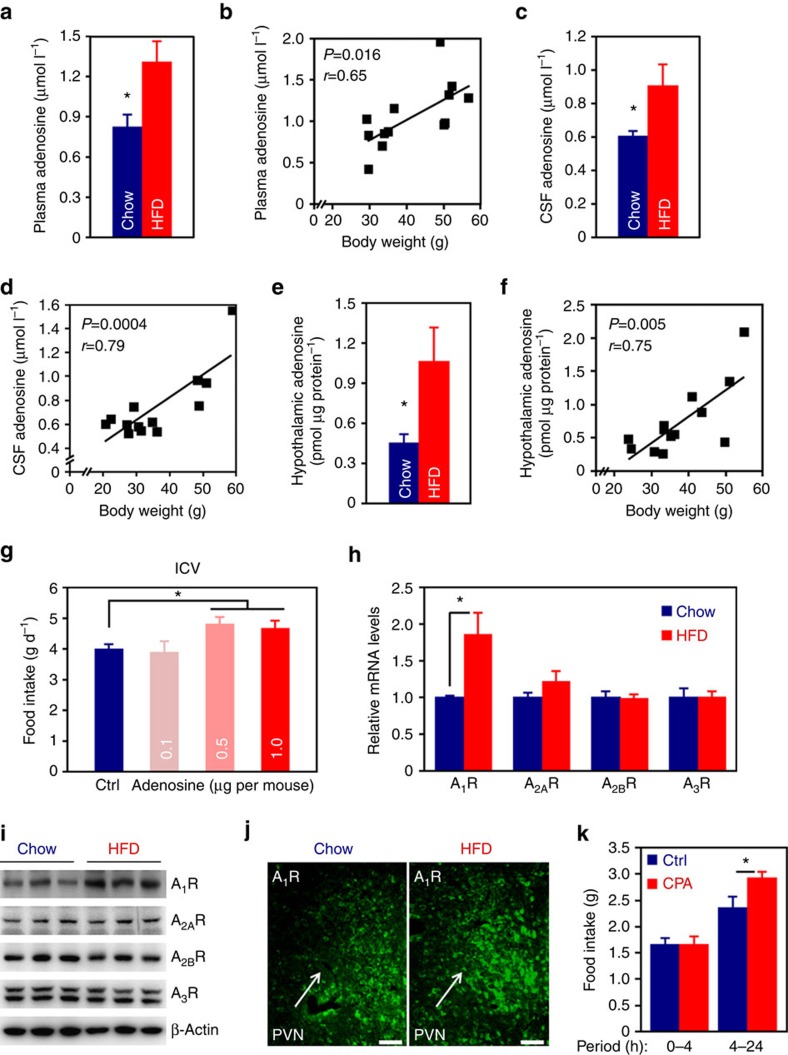
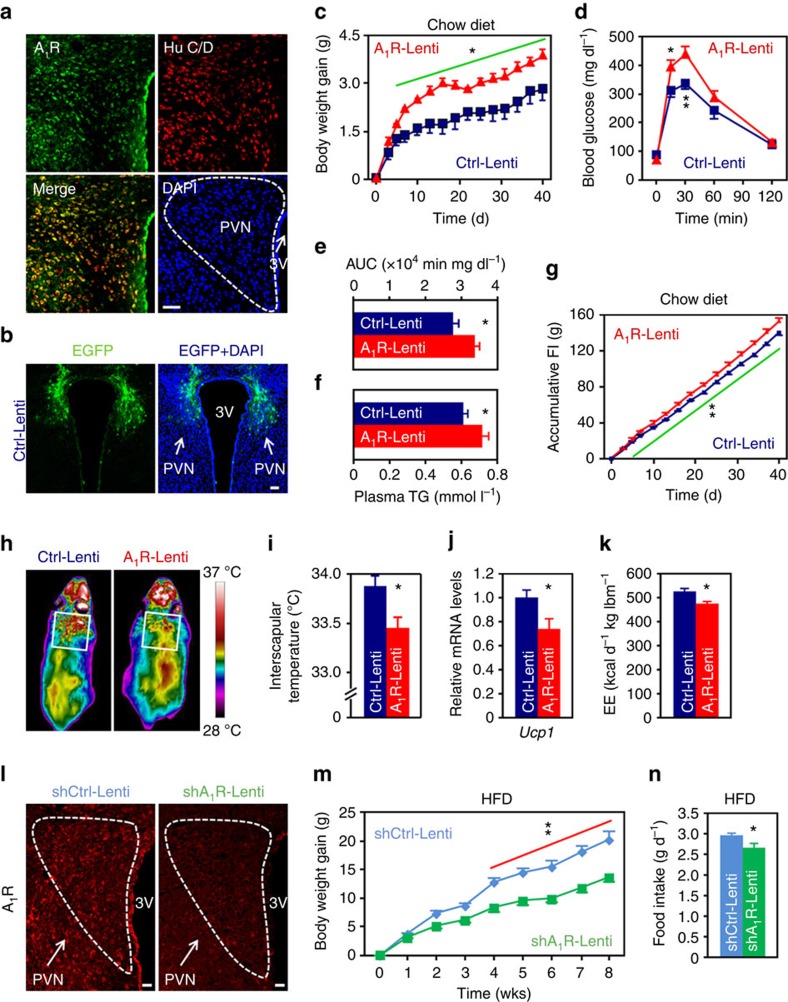
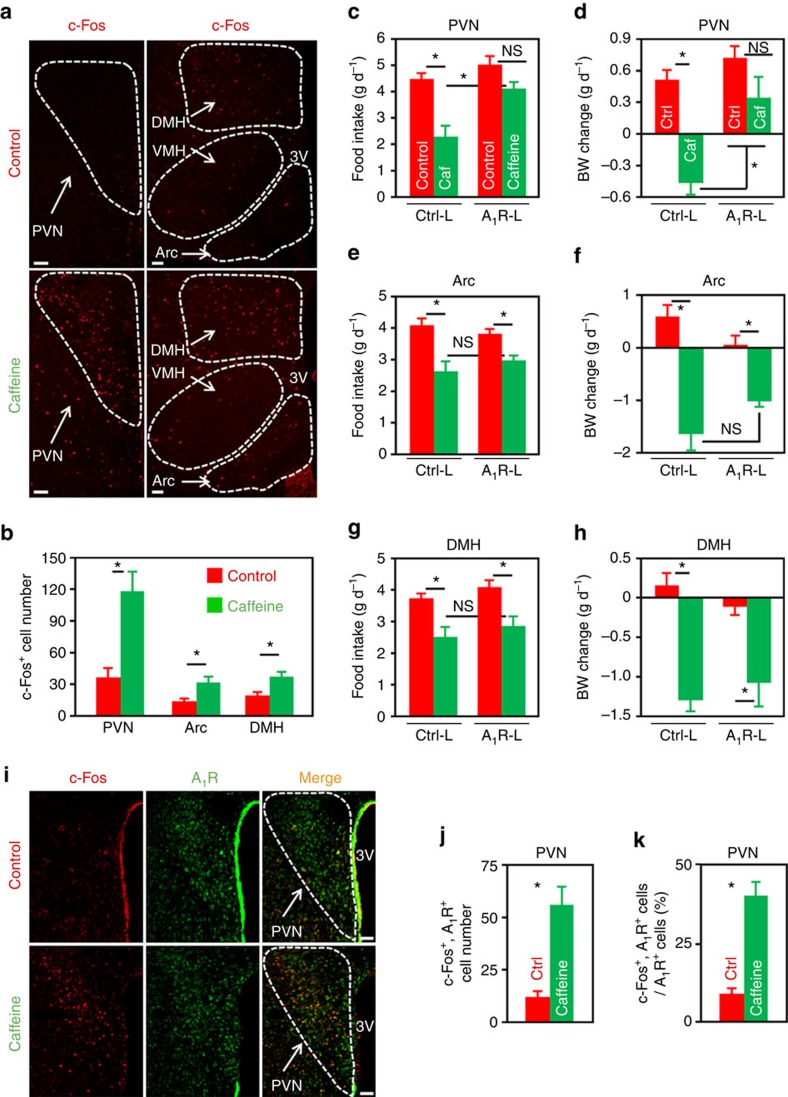
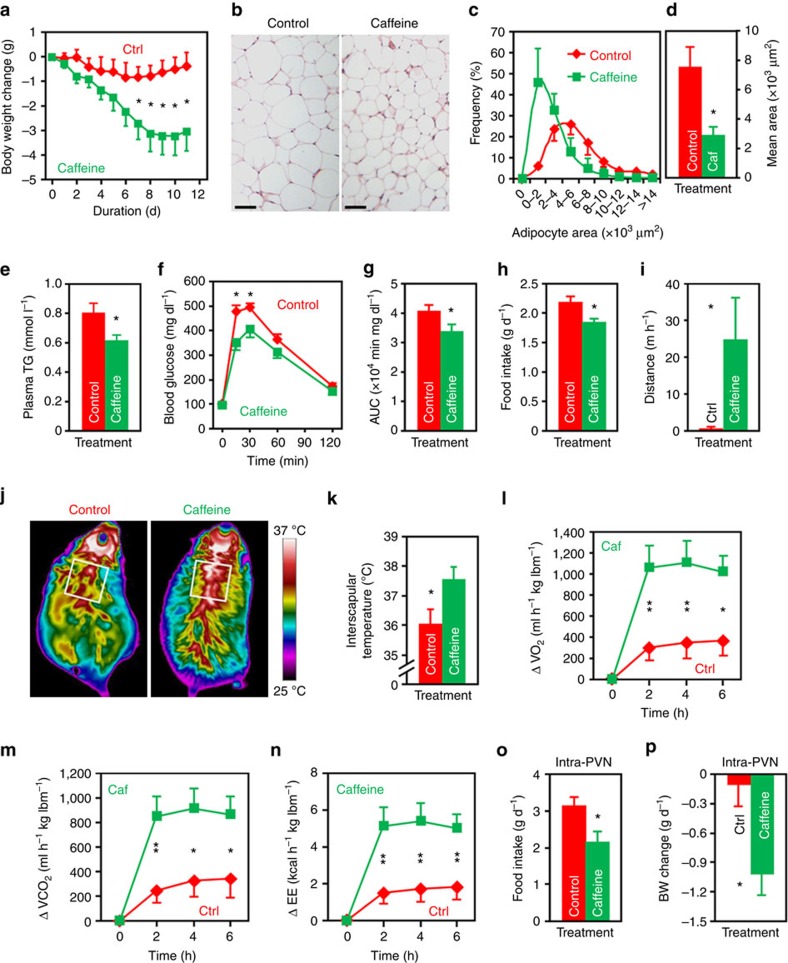
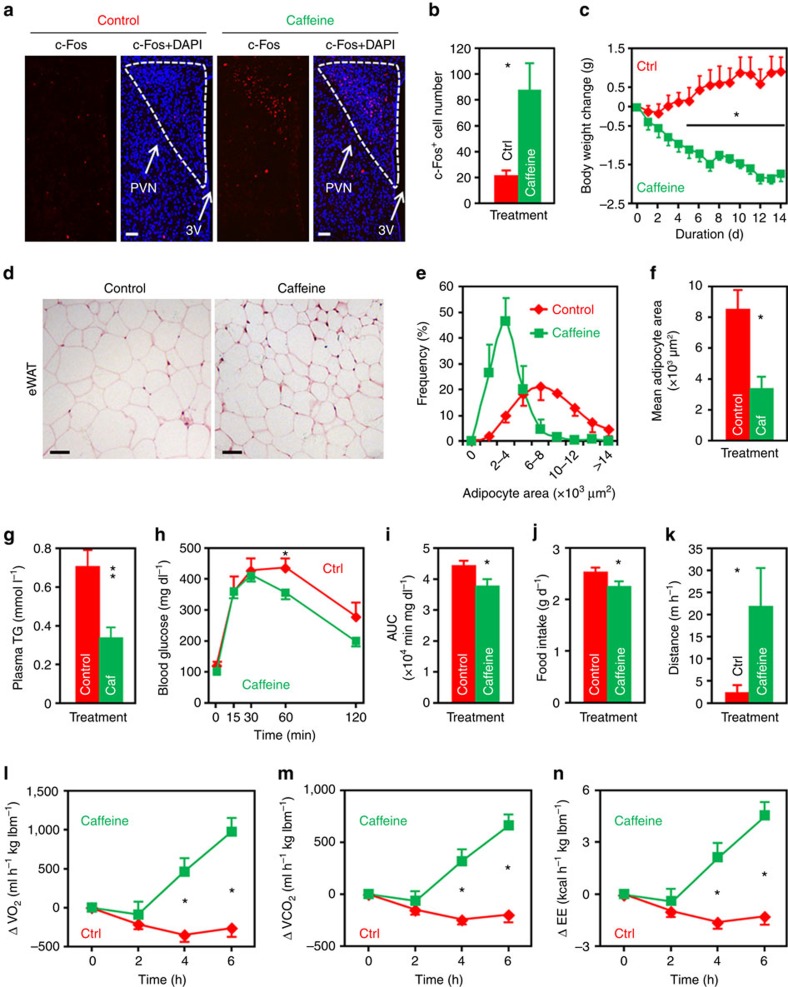
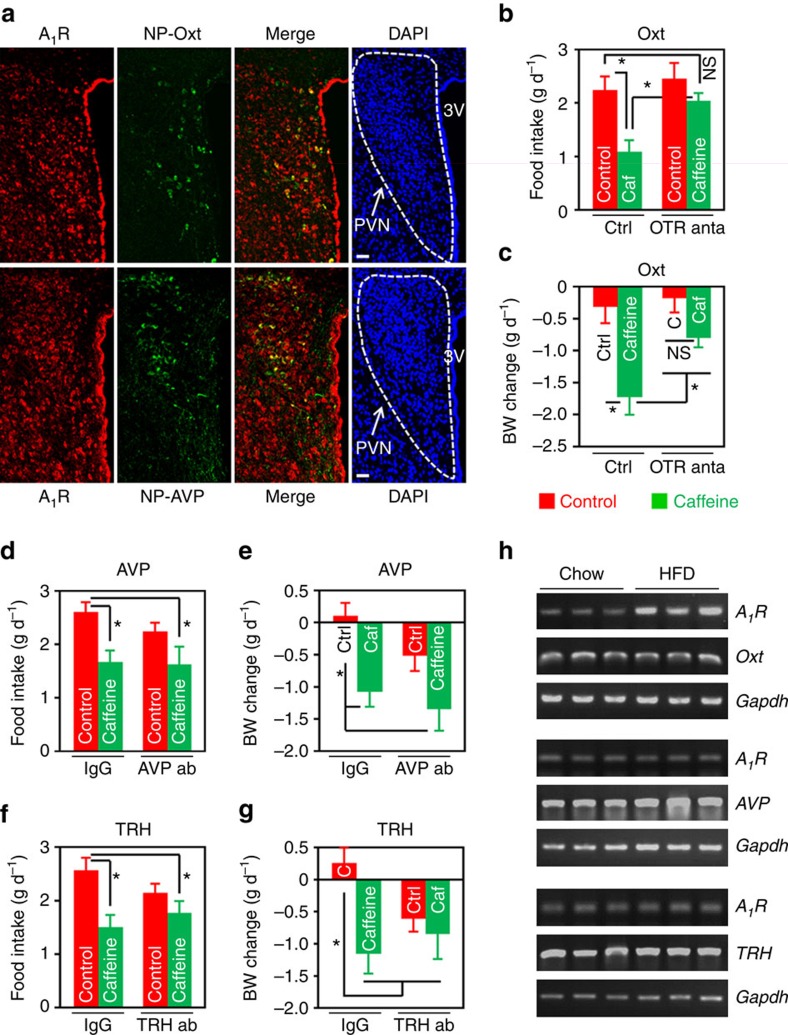
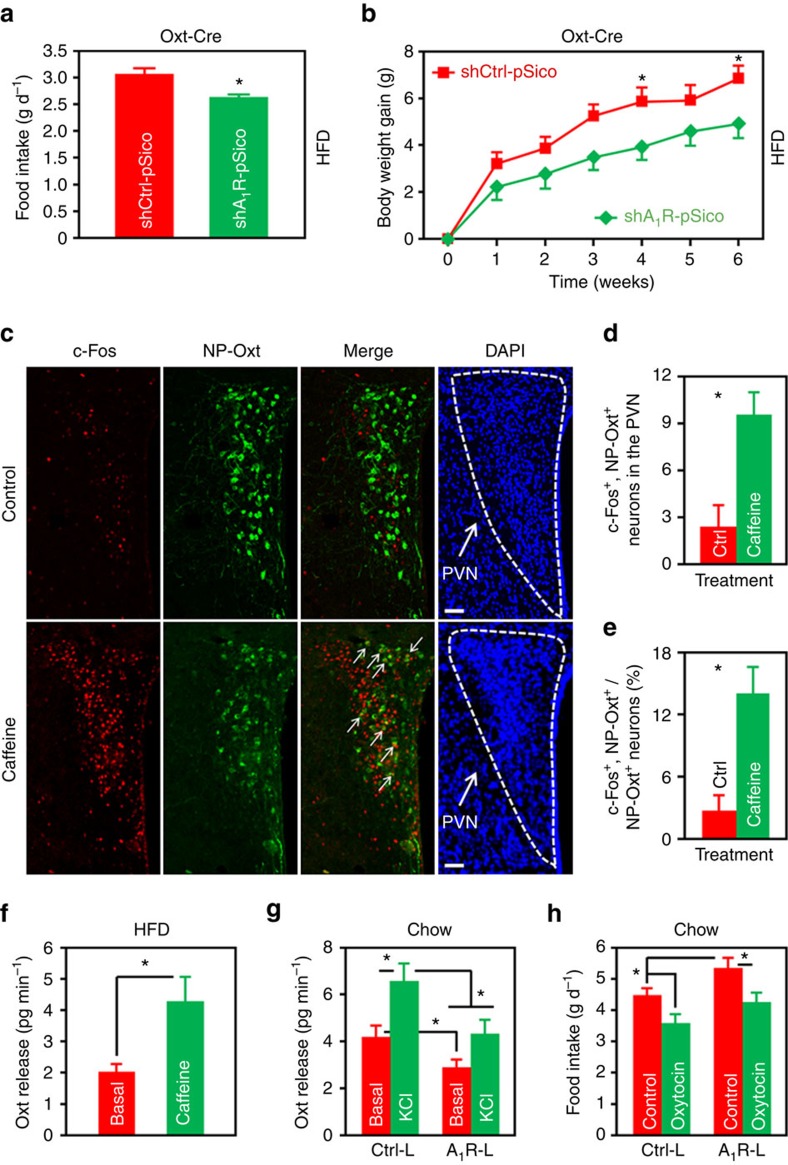
Caffeine, an antagonist of the adenosine receptor A1R, is used as a dietary supplement to reduce body weight, although the underlying mechanism is unclear. Here, we report that adenosine level in the cerebrospinal fluid, and hypothalamic expression of A1R, are increased in the diet-induced obesity (DIO) mouse. We find that mice with overexpression of A1R in the neurons of paraventricular nucleus (PVN) of the hypothalamus are hyperphagic, have glucose intolerance and high body weight. Central or peripheral administration of caffeine reduces the body weight of DIO mice by the suppression of appetite and increasing of energy expenditure. We also show that caffeine excites oxytocin expressing neurons, and blockade of the action of oxytocin significantly attenuates the effect of caffeine on energy balance. These data suggest that caffeine inhibits A1Rs expressed on PVN oxytocin neurons to negatively regulate energy balance in DIO mice.


Figures

Figure 1
Figure 1. Aberration of the adenosine receptor signalling pathway in the hypothalamus of DIO mouse.
(a) Plasma adenosine levels of chow- or 24 weeks HFD-fed mice. n=6 (Chow), 7 (HFD). (b) Correlation of plasma adenosine level with body weight, r, Pearson’s r; P, P value. (c) Adenosine levels in the CSF of chow- or 24 weeks HFD-fed mice. n=7. (d) Correlation of CSF adenosine level with body weight. (e) Hypothalamic adenosine contents of chow- or 24 weeks HFD-fed mice. n=7 (Chow), 6 (HFD). (f) Correlation of hypothalamic adenosine content with body weight. (g) Effect of i.c.v. administered adenosine on food intake. Ctrl, control. n=12 (Ctrl), 9 (0.1), 7 (0.5), 15 (1.0). (h) qRT-PCR analysis of the hypothalamic expression levels of adenosine receptors in chow- or HFD-fed mice. n=7 (Chow), 8 (HFD). (i) Western blot analysis of adenosine receptor expression in the hypothalami of chow- or HFD-fed mice. β-Actin was used as loading control. (j) Immunofluorescence staining of A1R in the PVN of hypothalamus of chow- or HFD-fed mouse. (k) Food intake of mice i.c.v. administered control or A1R agonist, CPA. n=9 (Ctrl), 7 (CPA). Data are presented as mean±s.e.m. *P<0.05, two-tailed Student’s t-test (a,c,e,h,k); one-way analysis of variance (ANOVA) with Bonferroni’s post hoc test (g).
Figure 2
Figure 2. Effects of manipulations of A1R expression in PVN on systemic energy balance.
(a) Double immunofluorescence staining of A1R (green) and neuronal marker Hu C/D (red) in mouse PVN. Cell nuclei were counterstained with DAPI (blue). 3V, third ventricle. Scale bar, 50 μm. (b) Expression of EGFP (green) after the injection of control lentivirus (Ctrl-Lenti) into PVN. Cell nuclei were counterstained with DAPI (blue). Scale bar, 50 μm. (cf) Body weight gain (c), GTT (d), area under the curve (AUC) of GTT (e) and plasma triglycerides (TG) levels (f) were analysed. Mice were injected either Ctrl-Lenti or A1R-Lenti virus into the PVN. Ctrl-Lenti, n=6 (c,f), 7 (d,e). A1R-Lenti, n=6 (f), 7 (ce). (gi) Accumulative food intake (FI) (g), representative infrared images (h) and interscapular temperatures (i) of mice injected either Ctrl-Lenti or A1R-Lenti virus into the PVN. Ctrl-Lenti, n=6 (g), 7 (i). A1R-Lenti, n=7. (j) qRT-PCR analysis of the expression level of Ucp1 in brown adipose tissue of mice injected Ctrl-Lenti (n=6) or A1R-Lenti (n=7) virus. (k) Daily energy expenditure (EE) of mice injected Ctrl-Lenti or A1R-Lenti virus. lbm, lean body mass. n=6. (l) Immunofluorescence images showing that A1R shRNA-expressing (shA1R-Lenti) lentivirus delivered into the PVN effectively reduced the expression of A1R in comparison with control (shCtrl-Lenti). 3V, third ventricle. Scale bar, 20 μm. (m,n) Body weight gain (m) and daily food intake (n) of mice injected either shCtrl-Lenti or shA1R-Lenti virus into the PVN. n=7. Data are presented as mean±s.e.m. *P<0.05, **P<0.01, two-tailed Student’s t-test (e,f,ik,n); two-way analysis of variance (ANOVA) with Bonferroni’s post hoc test (c,d,g,m).
Figure 3
Figure 3. Overexpression of A1R in PVN neurons significantly attenuates caffeine’s effect on energy balance.
(a) Immunofluorescence staining of c-Fos (red) in the paraventricular (PVN), arcuate (Arc), ventromedial (VMH) and dorsomedial (DMH) nuclei of mice infused with either caffeine (10 μg per mouse) or control. 3V, third ventricle. Scale bar, 50 μm. (b) The number of c-Fos+ cells in the PVN, Arc and DMH nuclei of control or caffeine administered mice. n=7. (ch) Chow-fed mice were injected Ctrl-Lenti (Ctrl-L) or A1R-Lenti (A1R-L) virus into the PVN (c,d), Arc (e,f) or DMH (g,h). Meanwhile, cannula directed to third ventricle were implanted. The mice were then i.c.v. injected control or caffeine (10 μg per mouse), and 24- h food intake (c,e,g) and body weight change (d,f,h) were analysed. Ctrl, control; Caf, caffeine. For PVN, n=7; Arc, n=7 (Ctrl-L, Control), 6 (Ctrl-L, Caffeine), 5 (A1R-L); DMH, n=6 (Ctrl-L), 7 (A1R-L). (i) Double immunofluorescence staining of c-Fos (red) and A1R (green) in the PVN of control or caffeine administered mice. 3V, third ventricle. Scale bar, 50 μm. (j,k) The number of c-Fos+ and A1R+ cells (j), as well as the percentage of A1R+ cells expressing c-Fos (k) in the PVN of mice administered control (Ctrl) or caffeine. n=3. Data are presented as mean±s.e.m. *P<0.05, two-tailed Student’s t-test (b,j,k); one-way analysis of variance (ANOVA) with Bonferroni’s (c,d,g,h) or Newman–Keuls (e,f) post hoc test. NS, not significant.
Figure 4
Figure 4. Central administration of caffeine reduces the body weights and improves obesity-related syndrome in DIO mice.
(a) Daily i.c.v. administration of caffeine (10 μg per mouse) significantly reduced the body weights of DIO mice. Ctrl, aCSF injected mice. n=9 (Ctrl), 11 (Caffeine). (bd) H&E staining (b), distribution of area (based on 100 cells per mouse) (c), mean area (d) of adipocytes of epididymal white adipose tissue (eWAT) from mice administered control or caffeine (Caf). n=3. (eg) Post-treatment plasma triglycerides (TG) levels (e), GTT (f) and the AUC of GTT (g) of mice injected control or caffeine. n=6 (e). n=7 (Control), 9 (Caffeine) (f,g). (h) Food intake of mice i.c.v. injected control or caffeine. n=9 (Control), 11 (Caffeine). (i) Distance travelled during the first hour by mice i.c.v. infused control or caffeine. n=6 (Ctrl), 5 (Caffeine). (j) Representative infrared images acquired 4 h post i.c.v. injection. (k) Quantification of the highest 10% temperatures in the interscapular area. n=4 (Control), 5 (Caffeine). (ln) Changes of O2 consumption (l), CO2 production (m) and energy expenditure (EE) (n) of the DIO mice immediately after the i.c.v. injection of control or of caffeine. lbm, lean body mass. n=8. (o,p) Twenty-four hours food intake (o) and body weight change (p) of mice administered control or caffeine (1 μg per mouse) into the PVN. n=9. Data are presented as mean±s.e.m. *P<0.05, **P<0.01, two-tailed Student’s t-test, comparison between caffeine and control groups (d,e,gi,k,o,p); two-way analysis of variance (ANOVA) with Bonferroni’s post hoc test (a,f,ln).
Figure 5
Figure 5. Peripheral caffeine treatment ameliorates diet-induced obesity.
(a) Peripheral caffeine treatment elicits neuronal activities in the PVN. Immunofluorescence staining of c-Fos (red) in the PVN of mice administered control saline or caffeine (60 mg kg−1) by using oral gavage. Cell nuclei were counterstained with DAPI. 3V, third ventricle. Scale bar, 50 μm. (b) Numbers of c-Fos+ cells in the PVN. n=7 (Ctrl), 6 (Caffeine). (c) Body weight changes of DIO mice administered control (Ctrl) or caffeine (60 mg kg−1) by using oral gavage. n=7. (df) H&E staining (d), distribution of area (based on 100 cells per mouse) (e), and the mean area (f) of adipocyte of epididymal white adipose tissue (eWAT) from control or caffeine (Caf) injected mice. Scale bar, 50 μm. n=4. (gi) Post-treatment plasma triglycerides (TG) levels (g), GTT (h) and the AUC of GTT (i) of mice injected control or caffeine. Control, n=7 (g), 10 (h,i). Caffeine, n=8 (g), 10 (h,i). (j) Daily food intake of control or caffeine administered mice. n=7. (k) Distance travelled in the first hour by mice administered control of caffeine. n=8. (ln) Changes of O2 consumption (l), CO2 production (m) and energy expenditure (EE) (n) of the DIO mice immediately after the administration of control or caffeine. lbm, lean body mass. n=8. Data are presented as mean±s.e.m. *P<0.05, **P<0.01, two-tailed Student’s t-test (b,f,g,ik); two-way analysis of variance (ANOVA) with Bonferroni’s post hoc test (c,h,ln).
Figure 6
Figure 6. Oxt mediates caffeine's effect on energy balance in the DIO mice.
(a) Double immunofluorescence staining of A1R (red) and Neurophysin I (NP-Oxt, green) or Neurophysin II (NP-AVP, green), which is co-expressed with Oxt or AVP in the PVN, respectively. Cell nuclei were counterstained with DAPI (blue). 3V, third ventricle. Scale bar, 50 μm. (bg) HFD-fed mice were i.c.v. administered aCSF or IgG as control (Ctrl), and 2 μg of Oxt receptor (OTR) antagonist (anta), L-368,899 (b,c), or 0.5 μg of antibody against AVP (d,e) or TRH (f,g). An hour later, mice were i.c.v. injected control or 10 μg of caffeine (Caf or C). Twenty-four hours food intake (b,d,f) and body weight change (c,e,g) were then measured. ab, antibody. In OTR antagonist experiment, n=10 (Ctrl+Ctrl), 11 (Ctrl+Caf), 9 (OTR anta+Ctrl), 13 (OTR anta+Caf); AVP antibody, n=11 (IgG+Ctrl), 9 (IgG+Caf), 7 (AVP ab+Ctrl), 14 (AVP ab+Caf); TRH antibody, n=7 (IgG+Ctrl), 7 (IgG+Caf), 8 (TRH ab+Ctrl), 10 (TRH ab+Caf). (h) Single-cell RT-PCR analysis of A1R expression in Oxt, AVP or TRH-expressing cells isolated from the PVN of chow or HFD-fed mice. Gapdh was used as an internal control. Data are presented as mean±s.e.m. *P<0.05, one-way analysis of variance (ANOVA) with Bonferroni’s (b,d,e,f) or Newman–Keuls (c,g) post hoc test. NS, not significant.
Figure 7
Figure 7. Caffeine and A1R regulate the PVN Oxt release.
(a,b) HFD intake (a) and body weight gain (b) of Oxt-Cre mice injected either shCtrl-pSico or shA1R-pSico lentivirus into the PVN. n=6 (shCtrl-pSico), 7 (shA1R-pSico). (c) Double immunofluorescence staining of c-Fos (red) and NP-Oxt (green) in the PVN of mice i.c.v. administered control or caffeine (10 μg per mouse). Cell nuclei were counterstained with DAPI (blue). Arrows indicate c-Fos and NP-Oxt co-expressing cells. Scale bar, 50 μm. (d,e) Number of c-Fos+ and NP-Oxt+ cells (d), as well as the percentage of NP-Oxt+ cells expressing c-Fos in the PVN (e). n=3 (Ctrl), 4 (Caffeine). (f) PVN slices of 12 weeks HFD-fed mice were dissected from the brains. Basal and caffeine (2 mmol l−1) elicited Oxt release were measured. n=8. (g) Chow-fed mice were injected Ctrl-Lenti (Ctrl-L) or A1R-Lenti (A1R-L) virus into the PVN. The animals were allowed to recover from surgeries, and then spontaneous (Basal) and high K+ (KCl) elicited Oxt release of PVN slices were examined. n=6 (Ctrl-L), 8 (A1R-L). (h) Chow-fed mice were injected Ctrl-L or A1R-L virus into the PVN, and cannulas directed to third ventricle were implanted. The mice were then i.c.v. administered control or 1 μg of Oxt, and food intake was measured. n=7 (Control), 6 (Oxytocin). Data are presented as mean±s.e.m. *P<0.05, two-tailed Student’s t-test (a,d,e,f); two-way analysis of variance (ANOVA) with Bonferroni’s post hoc test (b); or one-way ANOVA with Newman–Keuls post hoc test (g,h).

Similar articles

Cited by

References

    1. Flegal K. M., Kruszon-Moran D., Carroll M. D., Fryar C. D. & Ogden C. L. Trends in obesity among adults in the United States, 2005–2014. JAMA 315, 2284–2291 (2016). - PMC - PubMed
    1. Jia W. Obesity in China: its characteristics, diagnostic criteria, and implications. Front. Med. 9, 129–133 (2015). - PubMed
    1. Bray G. A. Medical treatment of obesity: the past, the present and the future. Best Pract. Res. Clin. Gastroenterol. 28, 665–684 (2014). - PubMed
    1. Lopez-Garcia E. et al.. Changes in caffeine intake and long-term weight change in men and women. Am. J. Clin. Nutr. 83, 674–680 (2006). - PubMed
    1. Chen J. F., Eltzschig H. K. & Fredholm B. B. Adenosine receptors as drug targets-what are the challenges? Nat. Rev. Drug Discov. 12, 265–286 (2013). - PMC - PubMed

Publication types

MeSH terms