Review
. 2017 Aug 9;117(15):10043-10120.
doi: 10.1021/acs.chemrev.7b00042. Epub 2017 Jun 27.

Mitochondria-Targeted Triphenylphosphonium-Based Compounds: Syntheses, Mechanisms of Action, and Therapeutic and Diagnostic Applications

Affiliations
Review

Mitochondria-Targeted Triphenylphosphonium-Based Compounds: Syntheses, Mechanisms of Action, and Therapeutic and Diagnostic Applications

Jacek Zielonka et al. Chem Rev. .

Abstract

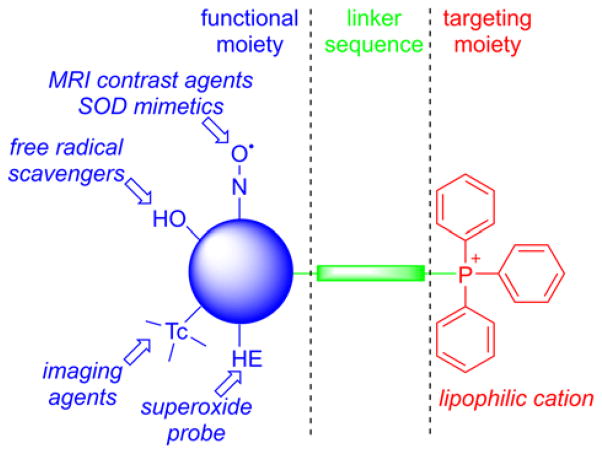
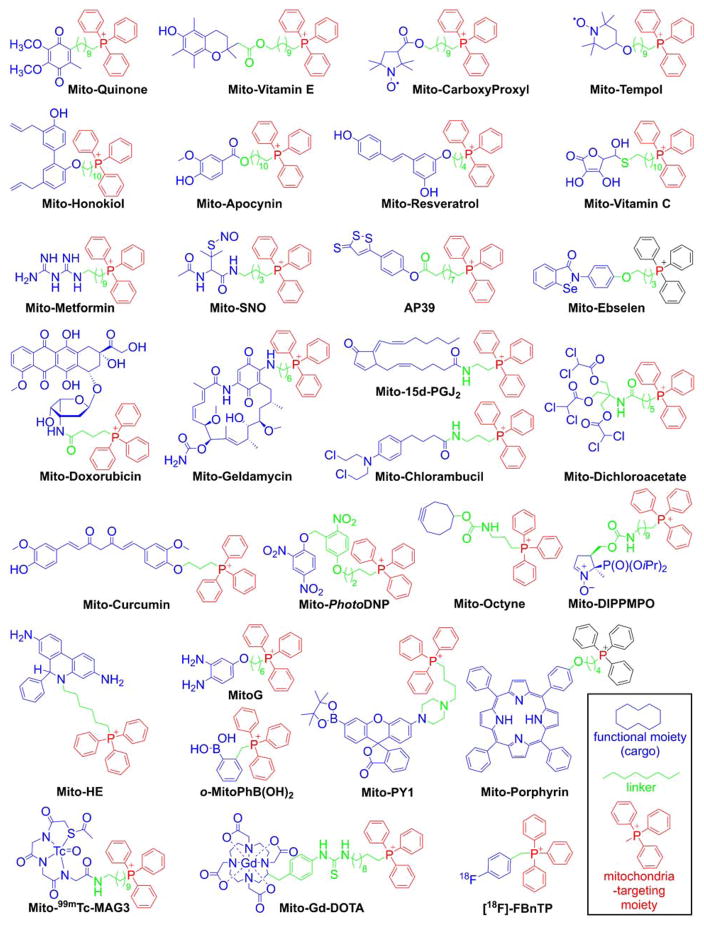
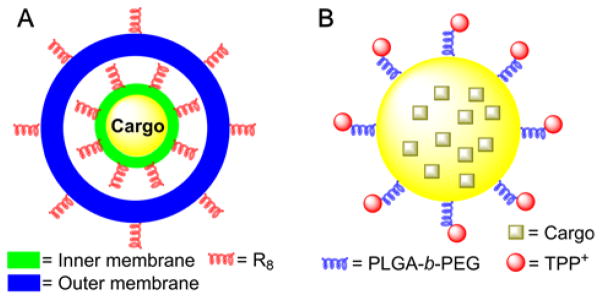
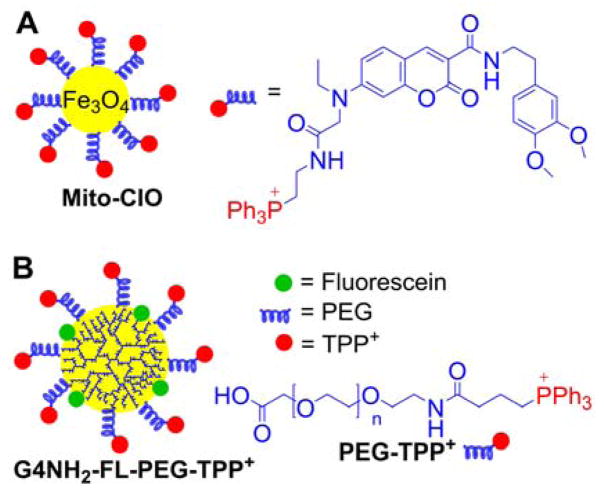
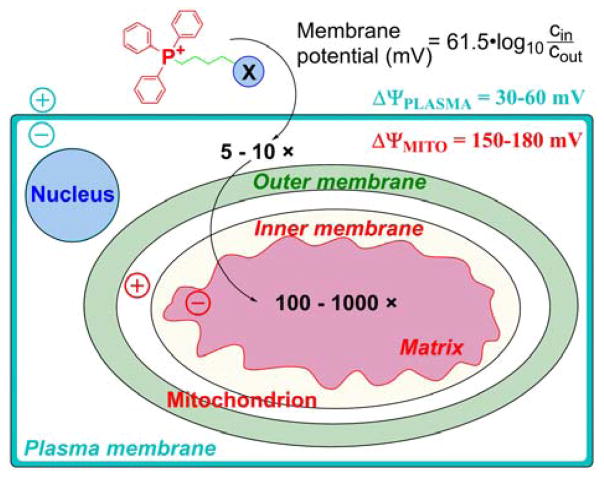
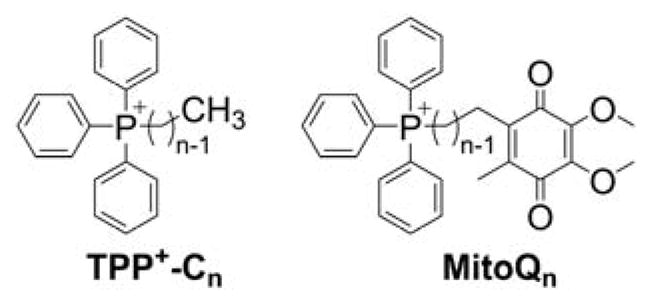
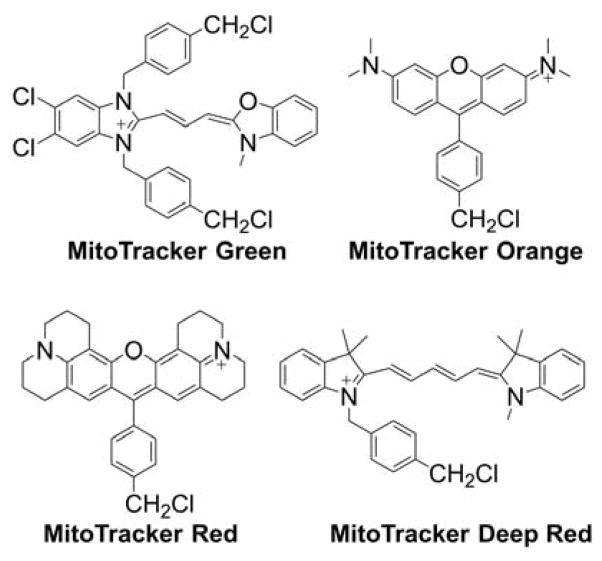
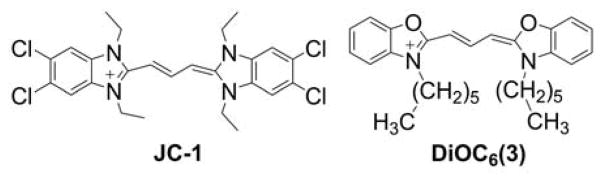
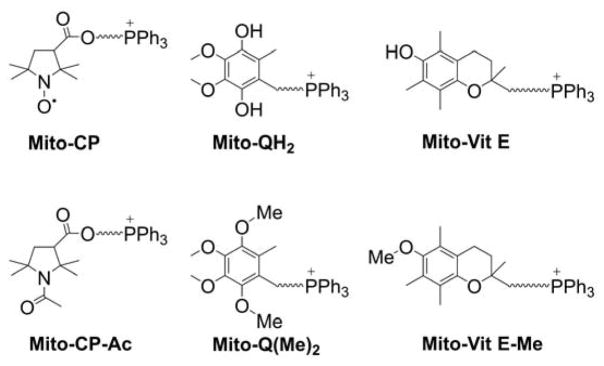
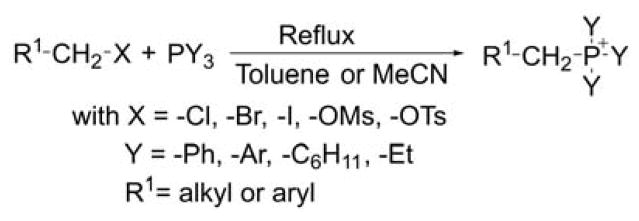
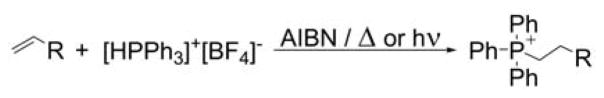
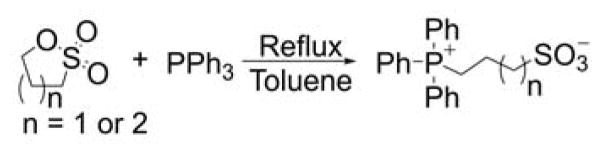
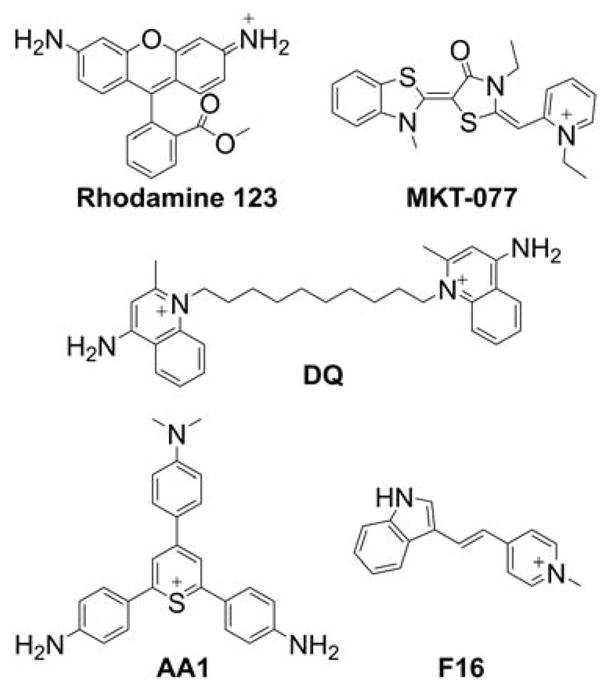
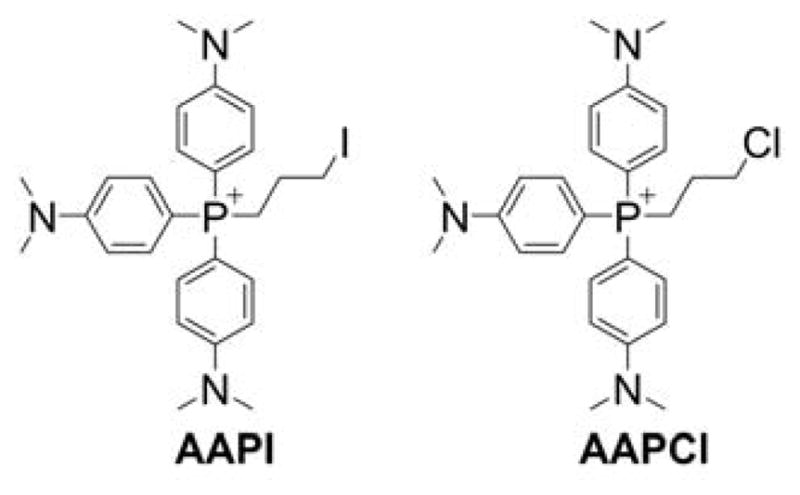
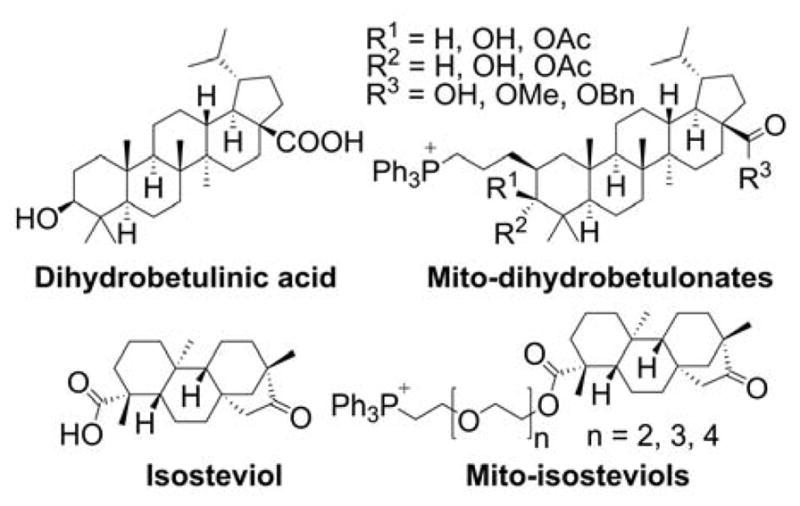
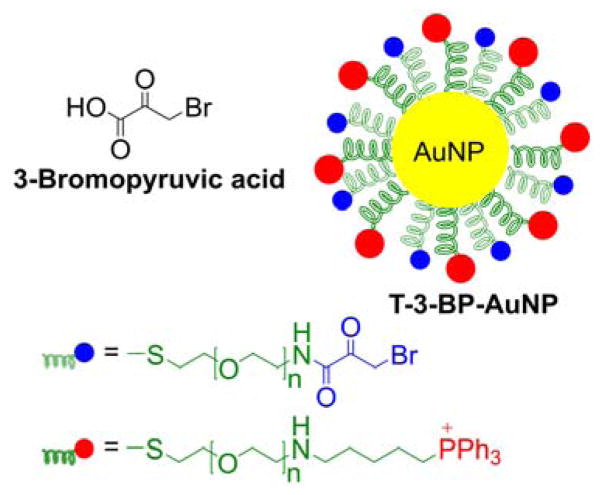
Mitochondria are recognized as one of the most important targets for new drug design in cancer, cardiovascular, and neurological diseases. Currently, the most effective way to deliver drugs specifically to mitochondria is by covalent linking a lipophilic cation such as an alkyltriphenylphosphonium moiety to a pharmacophore of interest. Other delocalized lipophilic cations, such as rhodamine, natural and synthetic mitochondria-targeting peptides, and nanoparticle vehicles, have also been used for mitochondrial delivery of small molecules. Depending on the approach used, and the cell and mitochondrial membrane potentials, more than 1000-fold higher mitochondrial concentration can be achieved. Mitochondrial targeting has been developed to study mitochondrial physiology and dysfunction and the interaction between mitochondria and other subcellular organelles and for treatment of a variety of diseases such as neurodegeneration and cancer. In this Review, we discuss efforts to target small-molecule compounds to mitochondria for probing mitochondria function, as diagnostic tools and potential therapeutics. We describe the physicochemical basis for mitochondrial accumulation of lipophilic cations, synthetic chemistry strategies to target compounds to mitochondria, mitochondrial probes, and sensors, and examples of mitochondrial targeting of bioactive compounds. Finally, we review published attempts to apply mitochondria-targeted agents for the treatment of cancer and neurodegenerative diseases.


Conflict of interest statement

Notes

The authors declare no competing financial interests.

Figures

Figure 1
Figure 1
Anatomy of TPP+-Based MTA
Figure 2
Figure 2
Examples of the TPP+-conjugated Compounds for Their Mitochondrial Delivery. Color coding represents the three parts of the mitochondria-targeted molecules: functional moiety (blue), linker (green), and targeting moiety (red).
Figure 3
Figure 3
Structure of the MITO-Porter (A) and PLGA-b-PEG-TPP+-Containing (B) Mitochondria-Targeting Particles
Figure 4
Figure 4
Anatomy of the Mito-CIO Particle (A) and the PAMAM-G4-NH2-Based TPP+-Conjugated Mitochondria-Targeted Dendrimer (B)
Figure 5
Figure 5
Cellular Uptake of TPP+-Linked Compounds Driven by Plasma Membrane and Mitochondrial Membrane Potentials (Adapted with permission from Ref.. Copyright 2003 National Academy of Sciences)
Figure 6
Figure 6
Schematic Representation of the Transport of an MTC From the Mitochondrial IMS to the Matrix through the Mitochondrial Inner Membrane
Figure 7
Figure 7
Comparison of the Mitochondria to Cytosol ACR for TPP+-Linked Weak Acids and Bases, as a Function of Their pKa Values. (A) Scheme of the Transport of Weak Acids and Bases Conjugated to a Lipophilic Cation; (B) Calculated Equilibrium ACR Values as a Function of pKa of Acids and Bases.
Figure 8
Figure 8
Formation of Phenyl Radicals During the Reaction of Mitochondria-Targeted Phenylboronates (MitoPhB(OH)2) with ONOO. (A) Chemical scheme showing the two pathways of the reaction of MitoPhB(OH)2 isomers with ONOO: major nonradical pathway (blue) and minor, radical-mediated pathway (red). (B) EPR spectra detected after reacting three MitoPhB(OH)2 isomers with ONOO in the presence of the MNP spin trap. (Adapted with permission from Ref.. This research was originally published in The Journal of Biological Chemistry. Zielonka J, Zielonka M, VerPlank L, Cheng G, Hardy M, Ouari O, Ayhan MM, Podsiadly R, Sikora A, Lambeth JD. Mitigation of NADPH Oxidase 2 Activity as a Strategy to Inhibit Peroxynitrite Formation. The Journal of Biological Chemistry. 2016; 291:7029–7044. © the American Society for Biochemistry and Molecular Biology.)
Figure 9
Figure 9
Cellular Uptake and Mitochondrial Accumulation of CP and Mito-CP in Endothelial Cells. (A) Chemical structures of CP and Mito-CP. (B) EPR spectra of the medium, cell lysates, and mitochondrial fractions of cells treated with CP or Mito-CP (1 μM each) for different periods of time. Dashed lines show nonlinear least squares fit to the spectra. (Adapted with permission from Ref.. Reprinted from Free Radical Biology and Medicine, 39/5, Dhanasekaran A, Kotamraju S, Karunakaran C, Kalivendi SV, Thomas S, Joseph J, Kalyanaraman B, Mitochondria superoxide dismutase mimetic inhibits peroxide-induced oxidative damage and apoptosis: Role of mitochondrial superoxide, 567–583, Copyright 2005, with permission from Elsevier.)
Figure 10
Figure 10
Superoxide-Scavenging and Antiproliferative Activities of Mito-CP and Mito-CP-Ac. (A) Chemical structures of Mito-CP and Mito-CP-Ac. (B) EPR spectra collected during EPR spin trapping of superoxide radical anion. Control incubations containing DIPPMPO (25 mM) and the solution of KO2 in DMSO were slowly infused over 10 min into the aqueous phosphate buffer (50 mM, pH 7.4) containing dtpa (100 μM). Where indicated, incubations contained Mito-CP (1 mM), Mito-CP-Ac (1 mM), TEMPOL (1 mM), or CP (1 mM). The bar graph shows the quantitative analyses of the DIPPMPO– OOH adduct formed in various incubations, using the EPR intensity of the low field line, as indicated by the arrows in the EPR spectra. (C) Intracellular concentrations of Mito-CP and Mito-CP-Ac in MiaPaCa-2 cells treated with 1 μM Mito-CP or Mito-CP-Ac for 24 h. (D) Effects of Mito-CP or Mito-CP-Ac on colony formation by MiaPaCa-2 and MCF-10A cells. Cells were treated with Mito-CP (left panel) or Mito-CP-Ac (right panel) for 24 h, and the colonies formed were counted after additional incubation. (Adapted with permission from Ref.. Reprinted from Cancer Letters, 365/1, Cheng G, Zielonka J, McAllister D, Hardy M, Ouari O, Joseph J, Dwinell MB, Kalyanaraman B, Antiproliferative effects of mitochondria-targeted cationic antioxidants and analogs: Role of mitochondrial bioenergetics and energy-sensing mechanism, 96–106, Copyright 2015, with permission from Elsevier.)
Figure 11
Figure 11
Cytotoxicity of Mito-ChM Toward Breast Cancer Cells and Nontumorigenic MCF-10A Cells. Nine different breast cancer cells and MCF-10A cells were treated with Mito-ChM at the indicated concentrations (0.5–20 μM) for 24 h, and cell death was monitored in real time by Sytox Green staining. Data shown are the means ± SEM for n = 4. Real-time cell death curves were plotted in Panel A for MCF-7 (left), MDA-MB-231 (middle), and MCF-10A cells (right). Panel B shows the titration of breast cancer and noncancerous cells with Mito-ChM, and the extent of cell death observed after four h of treatment is plotted against Mito-ChM concentration. Solid lines represent the fitting curves used to determine the EC50 values indicated in each panel. (Adapted with permission from Ref.. This research was originally published by BioMed Central in BMC Cancer. Cheng G, Zielonka J, McAllister DM, Mackinnon AC, Joseph J, Dwinell MB, Kalyanaraman B. (2013) Mitochondria-Targeted Vitamin E Analogs Inhibit Breast Cancer Cell Energy Metabolism and Promote Cell Death. BMC Cancer. 13:285. © BioMed Central.)
Figure 12
Figure 12
Antitumor Effects of Mito-ChM in Mice Xenograft Model of Breast Cancer. (A) HPLC-MS/MS chromatograms (MRM transition: 679.1→515.0) of the Mito-ChM standard (1 μM) and of indicated tissue extracts from MDA-MB-231-luc tumor xenograft mice treated with Mito-ChM. Quantitative data on concentrations of Mito-ChM after normalization to tissue wet weight are shown in Panel B. Tumor growth was determined by both bioluminescence signal intensity and tumor wet weight after four weeks of treatment. Representative bioluminescent images are show in (C). Quantitative data were plotted in Panel D on bioluminescence signal intensity (left) and wet tumor weight (right). Data are represented as a percentage of control mice, mean ± SEM (n = 10, control group, and n= 9, Mito-ChM treated group). *, P < 0.05 vs. control group. (Adapted with permission from Ref.. This research was originally published by BioMed Central in BMC Cancer. Cheng G, Zielonka J, McAllister DM, Mackinnon AC, Joseph J, Dwinell MB, Kalyanaraman B. (2013) Mitochondria-Targeted Vitamin E Analogs Inhibit Breast Cancer Cell Energy Metabolism and Promote Cell Death. BMC Cancer. 13:285. © BioMed Central.)
Figure 13
Figure 13
Inhibition of Mitochondrial Complex I by Mito-Met10 in Pancreatic Cancer versus Noncancerous Cells. Pancreatic cancer cells or normal nonmalignant cells were pretreated with Met or Mito-Met10 for 24 h. Mitochondrial complex I oxygen consumption is plotted against concentration of Met or Mito-Met10. Dashed lines represent the fitting curves used for determination of the IC50 values. (Adapted with permission from Ref.. This research was originally published in Cancer Research. Cheng G, Zielonka J, Ouari O, Lopez M, McAllister D, Boyle K, Barrios CS, Weber JJ, Johnson BD, Hardy M, Dwinnell MB, Kalyanaraman B. (2016) Mitochondria superoxide dismutase mimetic inhibits peroxide-induced oxidative damage and apoptosis: Role of mitochondrial superoxide. Cancer Research 76(13):3904–3915. doi: 10.1158/0008-5472.CAN-15-2534.)
Figure 14
Figure 14
Proposed Mechanism of Antiproliferative Effects of Mito-Met10 in Pancreatic Cancer Cells. Mito-Met10 inhibits complex I, stimulates ROS production, and activates AMPK phosphorylation, leading to antiproliferative effects. Changes due to the treatment with Mito-Met10 are shown by red block arrows. HE conversion to 2-OH-E+ is used for specific detection of superoxide. (Adapted with permission from Ref.. This research was originally published in Cancer Research. Cheng G, Zielonka J, Ouari O, Lopez M, McAllister D, Boyle K, Barrios CS, Weber JJ, Johnson BD, Hardy M, Dwinnell MB, Kalyanaraman B. (2016) Mitochondria superoxide dismutase mimetic inhibits peroxide-induced oxidative damage and apoptosis: Role of mitochondrial superoxide. Cancer Research 76(13):3904–3915. doi: 10.1158/0008-5472.CAN-15-2534.)
Figure 15
Figure 15
Synergistic Effects of 2-DG and Mito-CP on the Intracellular ATP Level in Breast Cancer MCF-7 and Nontumorigenic MCF-10A Cells. MCF-7 and MCF-10A cells were treated with 2-DG in the presence and absence of 1 μM of Mito-CP for six h. Intracellular ATP levels were monitored using a luciferase-based assay. Data are represented as a percentage of control (nontreated) cells after normalization to total protein for each well. The calculated absolute values of ATP (nmol ATP/μg protein) for MCF-7 and MCF-10A control cells were 20.6 ± 1.9 and 28.0 ± 2.0, respectively. Data shown are the means ± SEM, n = 4. (Adapted with permission from Ref.. This research was originally published in Cancer Research. Cheng G, Zielonka J, Dranka BP, McAllister D, Mackinnon Jr AC, Joseph J, Kalyanaraman B. (2012) Mitochondria-targeted drugs synergize with 2-deoxyglucose to trigger breast cancer cell death. Cancer Research 72(10):2634–2644. doi: 10.1158/0008-5472.CAN-11-3928.)
Figure 16
Figure 16
Differential Toxicity of MitoQ in Cancer Cells and Noncancerous Cells. (A) An SRB dye-based assay was used to measure cell viability following increasing concentrations of MitoQ after 72 h in breast cancer cell lines (MDA-MB-231 or MCF-7) or healthy breast epithelial cells (MCF-12A). (B) H9c2 cells were treated with 1 μM DOX in the presence and absence of DPI (5 μM), MitoQ (1 μM), Mito-undecanol (1 μM), or CoQ (1 μM) for eight h and caspase-3 and -8 activities were determined. (Adapted with permission from Ref.,. A portion of this research was originally published in The Journal of Biological Chemistry. Rao VA, Klein SR, Bonar SJ, Zielonka J, Mizuno N, Dickey JS, Keller PW, Joseph J, Kalyanaraman B, Shacter E. The antioxidant transcription factor Nrf2 negatively regulates autophagy and growth arrest induced by the anticancer redox agent mitoquinone. The Journal of Biological Chemistry. 2010; 285:34447–59. © the American Society for Biochemistry and Molecular Biology. A version of this figure was originally published in Kalivendi SV, Konorev EA, Cunningham S, Vanamala SK, Kaji EH, Joseph J, Kalyanaraman B. Biochemical Journal. 2005.)
Figure 17
Figure 17
Protective Effects of MitoQ Against DOX-Induced Cardiomyopathy In Vivo. (A) Endsystolic 2D B-mode images at the midventricular level: (1) Control rat, (2) DOX treatment for 12 weeks, (3) DOX plus MitoQ treatment for 12 weeks, and (4) MitoQ treatment for 12 weeks. (B) Anatomical M-mode through the anterior and interior walls. (C) Graph showing the radial strain in one cardiac cycle of six equidistant regions of the myocardium in the short-axis view. The global radial strain was computed as the average of all six segments. (Adapted with permission from Ref.. Reprinted from Biophysical Journal, 94/4, Chandran K, Aggarwal D, Migrino RQ, Joseph J, McAllister D, Konorev EA, Antholine WE, Zielonka J, Srinivasan S, Avadhani NG, Kalyanaraman B, Doxorubicin inactivates myocardial cytochrome c oxidase in rats: Cardioprotection by Mito-Q, 1388–1398, Copyright 2009, with permission from Elsevier.)
Figure 18
Figure 18
Cardioprotective and Chemotherapeutic Effects of Mito-TEMPOL-C4 in the Syngeneic Rat Breast Cancer Model. (A) Effect of Mito-TEMPOL-C4 (Mito-T (4)) alone and in combination with DOX on the tumor size. Spontaneously hypertensive rats (SHRs) were implanted with SST-2 cells and 24 h later were administered either doxorubicin (10 mg/kg), dexrazoxane (50 mg/kg), Mito-T (4) (5 or 25 mg/kg), a combination of doxorubicin and dexrazoxane, or a combination of doxorubicin and Mito-T (4). Each treatment group consisted of 10 animals. The mean tumor volumes (mm3) were measured 14 days after drug treatment. The two inset images show representative excised tumors from saline and doxorubicin-treated SHR/SST-2 animals. (B) Effect of Mito-TEMPOL-C4 on DOXinduced cell apoptosis in cardiac tissues, as measured by monitoring caspase-3 activity. Paraffin-embedded cardiac tissues were stained with the anti-active caspase-3 antibody. The intensity of the HRP-tagged secondary antibody was quantified as an indication of active caspase-3 using the ScanScope software. Mean intensities are shown in the graph and derived from at least 10 images per animal (five animals per group). (Adapted with permission from Ref.. This research was originally published in PLOS One. Dickey et al. (2013) Mito-TEMPOL and Dexrazoxane Exhibit Cardioprotective and Chemotherapeutic Effects through Specific Protein Oxidation and Autophagy in a Syngeneic Breast Tumor Preclinical Model. PLOS one 8(8):e70575. doi: 10.1371/journal.pone.0070575.)
Figure 19
Figure 19
Synergistic Effects of 2-DG and Mito-CP on Proliferation of Breast Cancer Cells and Nontumorigenic Cells. MTDs synergize with 2-DG to inhibit colony formation in MCF-7 and MDA-MB-231 cells but not in MCF-10A cells. (A) MCF-7, MDA-MB-231, and MCF-10A cells were treated with 2-DG only (top, left), 2-DG in the presence of Mito-CP (1 μM; top, right), 2-DG in the presence of MitoQ (1 μM) for six h (bottom, left), 2-DG in the presence of Dec-TPP+ (bottom, right), and the number of colonies formed was counted. (B) The survival fraction was calculated under the same conditions as in (A). The calculated plating efficiency for MCF-7, MDA-MB-231, and MCF-10A cells was 55 ± 6, 33 ± 4, and 34 ± 8, respectively. Data shown represent the mean ± SEM. *, P < 0.05 (n = 5) comparing MCF-7 and MDA-MB-231 with MCF-10A under the same treatment conditions. (Adapted with permission from Ref.. This research was originally published in Cancer Research. Cheng G, Zielonka J, Dranka BP, McAllister D, Mackinnon Jr AC, Joseph J, Kalyanaraman B. (2012) Mitochondria-targeted drugs synergize with 2-deoxyglucose to trigger breast cancer cell death. Cancer Research 72(10):2634–2644. doi: 10.1158/0008-5472.CAN-11-3928.)
Figure 20
Figure 20
Selective Depletion of Intracellular ATP Levels in Breast Cancer Cells by Mitochondria-Targeted Vitamin E Analog, Mito-ChM. The MCF-7, MDA-MB-231, and MCF-10A cells were treated with Mito-ChM (1–20 μM) as indicated for one to eight h. After treatment, cells were washed with complete media and either assayed immediately (A), or returned to cell culture incubator for 24 h (B). Intracellular ATP levels were measured using a luciferase-based assay. Data are represented as a percentage of control (nontreated) cells after normalization to total cellular protein. (Adapted with permission from Ref.. This research was originally published by BioMed Central in BMC Cancer. Cheng G, Zielonka J, McAllister DM, Mackinnon AC, Joseph J, Dwinell MB, Kalyanaraman B. (2013) Mitochondria-Targeted Vitamin E Analogs Inhibit Breast Cancer Cell Energy Metabolism and Promote Cell Death. BMC Cancer. 13:285. © BioMed Central.)
Figure 21
Figure 21
Selective Retention and Irreversible Inhibition of Mitochondrial Function by MTDs in Breast Cancer Cells. (A–D) MCF-7 and MCF-10A cells (20,000 cells per well) seeded in V7 culture plates were treated with the indicated compounds for six h. The cells were then washed with complete media (MEM-a for MCF-7 and DMEM/F12 for MCF-10A) and returned to a 37 °C incubator for 36 h. The cells were then washed with unbuffered media as described. Five baseline OCR and ECAR measurements were then taken before injection of oligomycin (1 μg/mL), to inhibit ATP synthase, FCCP (1–3 μM), to uncouple the mitochondria and yield maximal OCR, and antimycin A (10 μM) to inhibit complex III and mitochondrial oxygen consumption. The effects of MTDs and 2-DG on basal OCR, ATP-linked OCR, and ECAR are shown in E. *P < 0.01 (n = 5) comparing MCF-7 with MCF-10A under the same treatment conditions. (Adapted with permission from from Ref. This research was originally published in Cancer Research. Cheng G, Zielonka J, Dranka BP, McAllister D, Mackinnon Jr AC, Joseph J, Kalyanaraman B. (2012) Mitochondria-targeted drugs synergize with 2-deoxyglucose to trigger breast cancer cell death. Cancer Research 72(10):2634–2644. doi: 10.1158/0008-5472.CAN-11-3928.)
Figure 22
Figure 22
Mito-CP-Induced Mitigation of the Inflammatory Response in Kidneys of Mice Treated with Cisplatin. Mito-CP attenuates cisplatin-induced inflammation. Cisplatin significantly increased mRNA expression of proinflammatory chemokines (A) MCP-1, (B) MIP1α and MIP2, (C and D) myeloperoxidase staining and activity, and (E and F) adhesion molecule ICAM-1 and proinflammatory cytokine TNF-α mRNA expression in the kidneys 72 h after its administration to mice, indicating enhanced inflammatory response. These changes could be largely prevented by treatment with Mito-CP. Results are means±SEM of 6–16/group. *P < 0.05 vs. vehicle; #P < 0.05 vs. cisplatin. (Adapted with permission from Ref.. Reprinted from Free Radical Biology and Medicine, 52/2, Mukhopadhyay P, Horváth B, Zsengellér Z, Zielonka J, Tanchian G, Holovac E, Kechrid M, Patel V, Stillman IE, Parikh SM, Joseph J, Kalyanaraman B, Pacher P, Mitochondrial-targeted antioxidants represent a promising approach for prevention of cisplatin-induced nephropathy, 497–506, Copyright 2012, with permission from Elsevier.)
Figure 23
Figure 23
Neuroprotective Effects of Mito-Apo11. Mito-apocynin-C11 improves time-to-treat performance in LRRK2R1441G tg mice. The time required to identify either a chow pellet or a fruit cereal treat was monitored in mice in a novel cage with clean bedding. Individual mice are represented by the black dots, and the mean is shown as the red bar. (Adapted with permission from Ref.. Reprinted from Neuroscience Letters, 583, Dranka BP, Gifford A, McAllister D, Zielonka J, Joseph J, O’Hara CL, Stucky CL, Kanthasamy AG, Kalyanaraman B, A novel mitochondrially-targeted apocynin derivative prevents hyposmia and loss of motor function in the leucine-rich repeat kinase 2 (LRRK2R1441G) transgenic mouse model of Parkinson’s disease, 159–164., Copyright 2014, with permission from Elsevier.)
Figure 24
Figure 24
Spin Echo Inversion Recovery Images (T1=1900 ms) of the Tubes Containing Isolated Mitochondria (top) or Post-Mitochondrial Supernatant (bottom) in PBS Containing Succinate and the Nitroxides, as Indicated. (Adapted with permission from Ref.. This research was originally published in Proceedings of the International Society for Magnetic Resonance in Medicine. Prah D, Paulson E, Zielonka J, Hardy M, Joseph J, Kalyanaraman B, Schmainda K. (2007) In Vitro Mitochondrial Labeling using Mito-CarboxyPROXYL (Mito-CP) Enhanced Magnetic Resonance Imaging. Proc Intl Soc Mag Reson Med 15:1162.)
Figure 25
Figure 25
Mito-CP-Based Imaging of Breast Cancer in Rats (Adapted with permission from Ref.. This research was originally published in Proceedings of the International Society for Magnetic Resonance in Medicine. Prah D, Paulson E, Wagner-Schuman M, Zielonka J, Lopez M, Hardy M, Joseph J, Kalyanaraman B, Schmainda K. (2008) In Vivo Mitochondrial Labeling using Mito-CarboxyPROXYL (Mito-CP) Enhanced Magnetic Resonance Imaging. Proc Intl Soc Mag Reson Med 16:106.)
Figure 26
Figure 26
Application of the Mito-99mTc-MAG3 for In Vivo Tumor Imaging in Rats in Chemically Induced Breast Cancer. Anterior images of the same rat from three consecutive weeks are shown in (A–C). The site of progressive tumor growth, as detected by Mito-99mTc-MAG3, is indicated with an arrow. (Adapted with permission from Ref.. This research was originally published in Cancer Biotherapy and Radiopharmaceuticals. Li Z, Lopez M, Hardy M, McAllister DM, Kalyanaraman B, Zhao M. (2009) A 99mTc-Labeled Triphenylphosphonium Derivative for the Early Detection of Breast Tumors. 24(5): 579–587. doi: 10.1089/cbr.2008.0606.)
Chart 1
Chart 1
Examples of Heterocyclic Cations Used as Mitochondria-Targeting Moieties. Color coding represents three parts of the mitochondria-targeted molecules: targeting moiety (red), linker (green), and functional moiety (blue).
Chart 2
Chart 2
Examples of Mitochondria-Targeted Peptides: SS Peptide (SS-31), MPP, and Hemigramicidin S-linked Nitroxide (XJB-5-131)
Chart 3
Chart 3
Structures of TPP+-Cn and MitoQn
Chart 4
Chart 4
Structure of the TBB Lipophilic Anion
Chart 5
Chart 5
Structures of Different MitoTracker Probes
Chart 6
Chart 6
Structures of JC-1 and DiOC6(3) Probes
Chart 7
Chart 7
Structures of Rhodamine-Based Indicators of Mitochondrial Membrane Potential
Chart 8
Chart 8
Structure of NOA
Chart 9
Chart 9
Chemical Structures of Mitochondria-Targeted Probes with AIE (Mito-AIE Probes)
Chart 10
Chart 10
Click-Chemistry-Based Mitochondrial Probes
Chart 11
Chart 11
Examples of “Control” Compounds for Mitochondria-Targeted Antioxidants
Chart 12
Chart 12
Alkylation of Trisubstituted Phosphines
Chart 13
Chart 13
Free-Radical-Mediated Hydrophosphonation of Alkenes
Chart 14
Chart 14
Reaction of Triphenylphosphine with Sulfones
Chart 15
Chart 15
Palladium-Catalyzed Arylation of Triphenylphosphine
Chart 16
Chart 16
Difluoromethylation Using Me3SiCF2Br and DMPU
Chart 17
Chart 17
O- and C-alkylation of Stabilized Ylides
Chart 18
Chart 18
Strategies for Conjugating the TPP+ Cations with Functional Moieties (Cargo). Color coding represents three parts of the mitochondria-targeted molecules: targeting moiety (red), linker (green), and functional moiety (blue).
Chart 19
Chart 19
Scheme of Synthesis of Mitochondria-Targeted Spin Traps Based on
Chart 20
Chart 20
Synthetic Pathway for Mitochondria-Targeted Metformins, Mito-Metn. Reagents and conditions: i, PPh3, ACN, reflux, 70–80%; ii, NH2-NH2, EtOH, reflux, 75–80%; iii, HCl, sodium dicyanamide, neat, 180°C, 25–40%.
Chart 21
Chart 21
Synthesis of 99mTc-Mito-MAG3 Probe. Reagents and conditions: i, DMSO, TEA, rt, 50%; ii, radiolabeling with 99mTc, 92%.
Chart 22
Chart 22
Mitochondria-Targeted Probes for O2•−
Chart 23
Chart 23
Formation of Superoxide-Specific and Nonspecific Oxidation Products of Mito-HE (or MitoSOX Red)
Chart 24
Chart 24
EPR Spin Trapping of Short-Lived Radicals, Using a Cycling Nitrone
Chart 25
Chart 25
Spin Traps and Their Mitochondria-Targeted Analogs
Chart 26
Chart 26
Mitochondria-Targeted Boronate-Based Probe, MitoPY1
Chart 27
Chart 27
Oxidation of Arylboronates by Various Oxidants
Chart 28
Chart 28
Mechanism and Products of the Reaction Between Arylboronates and ONOO
Chart 29
Chart 29
Mitochondria-Targeted Phenylboronate Probes
Chart 30
Chart 30
Formation of Peroxynitrite-Specific Products from (A) Para, (B) Meta, and (C) Ortho Isomers of MitoPhB(OH)2
Chart 31
Chart 31
Products Formed and Detected upon Oxidation of the ortho-MitoPhB(OH)2 Probe by Different Oxidants. The peroxynitrite-specific, minor pathway and products are shown in red. (Adapted with permission from Ref.. This research was originally published in The Journal of Biological Chemistry. Zielonka J, Zielonka M, VerPlank L, Cheng G, Hardy M, Ouari O, Ayhan MM, Podsiadly R, Sikora A, Lambeth JD. Mitigation of NADPH Oxidase 2 Activity as a Strategy to Inhibit Peroxynitrite Formation. The Journal of Biological Chemistry. 2016; 291:7029–7044. © the American Society for Biochemistry and Molecular Biology.)
Chart 32
Chart 32
Mitochondria-Targeted Boronate Probes: SHP-Mito, pep3-NP1, and Mito-H2O2
Chart 33
Chart 33
Mitochondria-Accumulating Rhodamine-Based Probes for Peroxynitrite and Other Oxidants
Chart 34
Chart 34
Cyanine-Based Mitochondria-Targeted Probes for Peroxynitrite
Chart 35
Chart 35
Mito-A2 probe for Mitochondrial Peroxynitrite
Chart 36
Chart 36
Mitochondria-Targeted Probes for Singlet Oxygen
Chart 37
Chart 37
C11-BODIPY(581/591) Probe and Its Mitochondria-Targeted Analog, MitoPerOx, for Reporting Lipid Peroxidation
Chart 38
Chart 38
Phenothiazine-Based Mitochondria-Targeted Probes Designed for HOCl
Chart 39
Chart 39
Cyanine-Based Mitochondria-Targeted Probes for HOCl
Chart 40
Chart 40
MitoClO Probe for HOCl
Chart 41
Chart 41
Rh-TPP, Rh-Py, RMClO-1, and RMClO-2 Probes for Mitochondrial HOCl Other mitochondria-targeted probes reported for HOCl detection include MITO-TP (Chart 42), based on the acedan fluorophore and iridium(III) complexes, with the diaminomaleonitrile moiety as the HOCl-reactive reporter group.
Chart 42
Chart 42
Mito-TP Probe for Mitochondrial HOCl
Chart 43
Chart 43
TBTB Probes for Mitochondrial Thiol Redox Status
Chart 44
Chart 44
Mitochondria-Targeted Probes for the Detection of H2S, Based on Reduction of the Azidyl Group
Chart 45
Chart 45
Mitochondria-Targeted Probes for Detecting H2S, Based on the Nucleophilic Addition Mechanisms
Chart 46
Chart 46
Mitochondria-Targeted Probes for detecting H2S, Based on Thiolysis of the 7-nitro-1,2,3-benzodiazole Amine Moiety
Chart 47
Chart 47
Mitochondria-Targeted Probe for Polysulfides, Mito-ss.
Chart 48
Chart 48
Mitochondria-Targeted Probe for Glyoxals, MitoG
Chart 49
Chart 49
Mitochondria-Targeted Macrocyclic SOD Mimetics
Chart 50
Chart 50
Redox Cycling of PQ and Structure of MitoPQ
Chart 51
Chart 51
Structures of MitoSNO and HVTP Donors
Chart 52
Chart 52
Ascorbic Acid and MitoVitC
Chart 53
Chart 53
Ebselen and Mito-Ebselens
Chart 54
Chart 54
Mitochondria-Targeted Fullerene
Chart 55
Chart 55
Structures of Mitochondria-Targeted Electrophiles
Chart 56
Chart 56
H2S Donors, ADT-OH and HTB, and Their Mitochondria-Targeted Analogs, AP39 and AP123
Chart 57
Chart 57
Lipoic Acid and its Mitochondria-Targeted Analogs
Chart 58
Chart 58
Ubiquinone and Plastoquinone and Their Mitochondria-Targeted Analogs (MitoQ and SkQ1, Respectively)
Chart 59
Chart 59
Two-electron Redox Equilibrium of MitoQ/MitoQH2 Couple
Chart 60
Chart 60
Redox Equilibrium Between MitoQ and O2•−
Chart 61
Chart 61
Redox Cycle of Nitroxide Radicals
Chart 62
Chart 62
Structures of Tempo and Mito-Tempo Analogs,,,,
Chart 63
Chart 63
α-Tocopherol, Mito-Vit E Analogs
Chart 64
Chart 64
Mitochondria-Targeted Uncouplers and “Caged” Uncouplers
Chart 65
Chart 65
DCA and Mitochondria-Targeted Analogs
Chart 66
Chart 66
Metformin and Mito-Metformins
Chart 67
Chart 67
Mitochondria-Targeted Hsp90 Inhibitors
Chart 68
Chart 68
Mitochondria-Targeted Resveratrols
Chart 69
Chart 69
Mitochondria-Targeted Quercetins
Chart 70
Chart 70
Mitochondria-Targeted Derivatives of Curcumin
Chart 71
Chart 71
Examples of Lipophilic Cationic Compounds Exhibiting Anticancer Effects (Rh-123, MKT-077, Dequalinium, AA1, F16)
Chart 72
Chart 72
Structure of APPCL and APPI Compounds
Chart 73
Chart 73
Mitochondria-Targeted Terpenoids
Chart 74
Chart 74
3-Bromopyruvate (Free and in TPP+-Nanoparticles)
Chart 75
Chart 75
DOX and TPP-DOX
Chart 76
Chart 76
Cisplatin and Its Mitochondria-Targeted Analogs
Chart 77
Chart 77
Chlorambucil and Mitochondria-Targeted Analogs
Chart 78
Chart 78
Paclitaxel and Mitochondria-Targeted Analog
Chart 79
Chart 79
Targeting Porphyrin-Based Photosensitizers to Mitochondria
Chart 80
Chart 80
Targeting Dithiaporphyrin-Based Photosensitizers to Mitochondria
Chart 81
Chart 81
Pc, Ce6, and ZnPc1 Photosensitizers
Chart 82
Chart 82
Iridium-Based TPP+-Linked Photosensitizer
Chart 83
Chart 83
Ruthenium-Based Photosensitizers
Chart 84
Chart 84
Triphenylamine-Based Mitochondria-Targeted Photosensitizers
Chart 85
Chart 85
Mitochondria-Targeted Apocynin Analogs
Chart 86
Chart 86
Structures of Mito-Gd(III)-DOTA and Mito-Gd(III)-DTPA
Chart 87
Chart 87
Mitochondria-Targeted Gd-Based MRI Contrast Agents Carrying Arylphosphonium Cations
Chart 88
Chart 88
Radiolabeled Triphenylphosphonium Cations for Imaging Applications
Chart 89
Chart 89
18F-labeled Triphenylphosphonium Cations for Imaging Applications
Chart 90
Chart 90
64Cu-Labeled Mitochondria-Targeted Imaging Agents
Chart 91
Chart 91
99mTc-Labeled Mitochondria-Targeted Imaging Agents

References

    1. Milane L, Trivedi M, Singh A, Talekar M, Amiji M. Mitochondrial Biology, Targets, and Drug Delivery. J Control Release. 2015;207:40–58. - PubMed
    1. Nunnari J, Suomalainen A. Mitochondria: In Sickness and in Health. Cell. 2012;148:1145–1159. - PMC - PubMed
    1. Chandel NS. Evolution of Mitochondria as Signaling Organelles. Cell Metab. 2015;22:204–206. - PubMed
    1. Willems PH, Rossignol R, Dieteren CE, Murphy MP, Koopman WJ. Redox Homeostasis and Mitochondrial Dynamics. Cell Metab. 2015;22:207–218. - PubMed
    1. Chouchani ET, Pell VR, James AM, Work LM, Saeb-Parsy K, Frezza C, Krieg T, Murphy MP. A Unifying Mechanism for Mitochondrial Superoxide Production During Ischemia-Reperfusion Injury. Cell Metab. 2016;23:254–263. - PubMed

MeSH terms

Substances