. 2017 Jan 1:16:1536012117704557.
doi: 10.1177/1536012117704557.

Brain and Brown Adipose Tissue Metabolism in Transgenic Tg2576 Mice Models of Alzheimer Disease Assessed Using 18F-FDG PET Imaging

Affiliations

Brain and Brown Adipose Tissue Metabolism in Transgenic Tg2576 Mice Models of Alzheimer Disease Assessed Using 18F-FDG PET Imaging

Robert A Coleman et al. Mol Imaging. .

Abstract

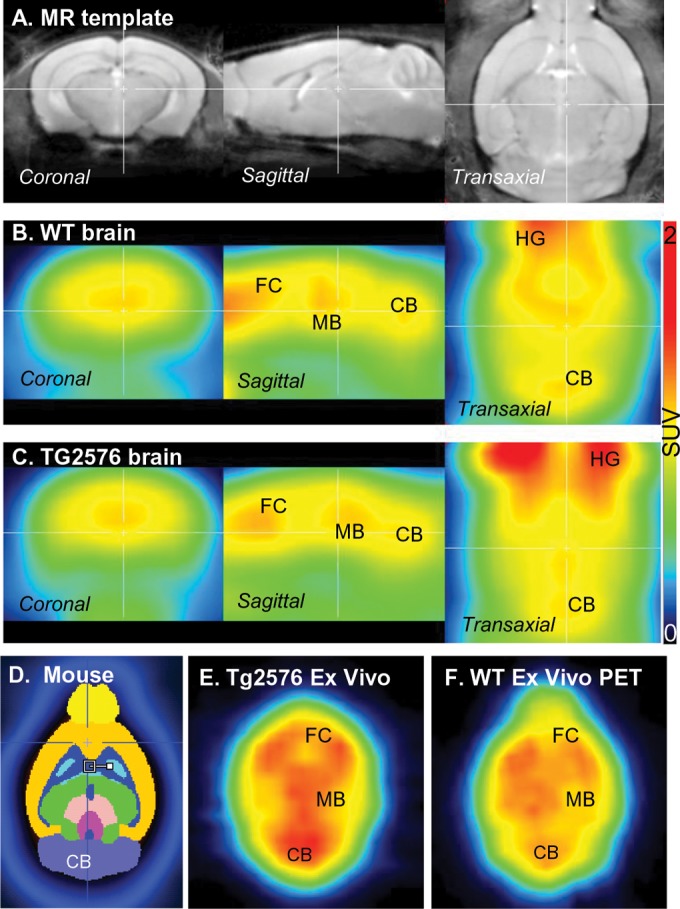
Objective: Imaging animal models of Alzheimer disease (AD) is useful for the development of therapeutic drugs and understanding AD. Transgenic Swedish hAPPswe Tg2576 mice are a good model of β-amyloid plaques. We report 18F-fluoro-2-deoxyglucose (18F-FDG) positron emission tomography (PET) imaging of brain and intrascapular brown adipose tissue (IBAT) in transgenic mice 2576 (Tg2576) and wild-type (WT) mice.

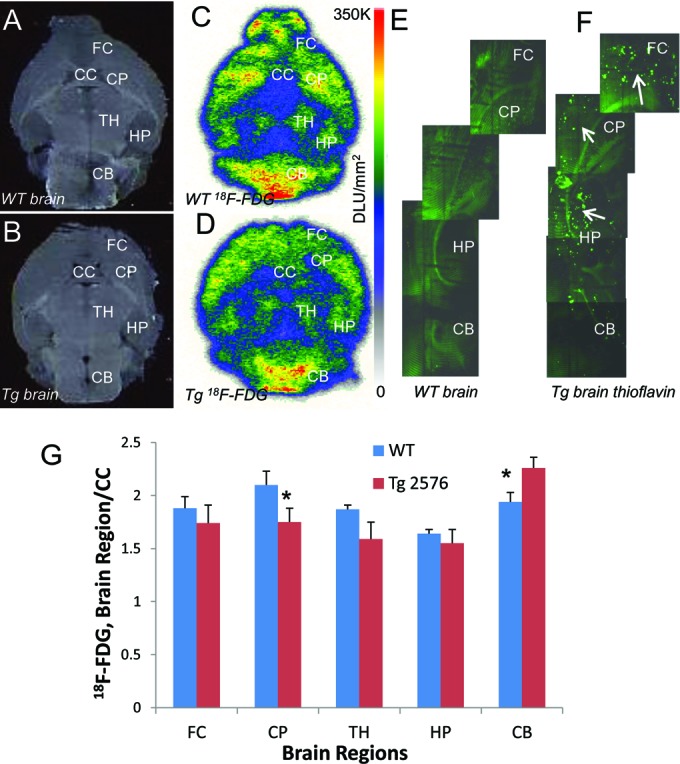
Methods: Transgenic Tg2576 mice and WT mice, >18 months were injected intraperitonally with ≈ 25 to 30 MBq 18F-FDG while awake. After 60 minutes, they were anesthetized with isoflurane (2.5%) and imaged with Inveon MicroPET. Select mice were killed, imaged ex vivo, and 20 µm sections cut for autoradiography. 18F-FDG uptake in brain and IBAT PET and brain autoradiographs were analyzed.

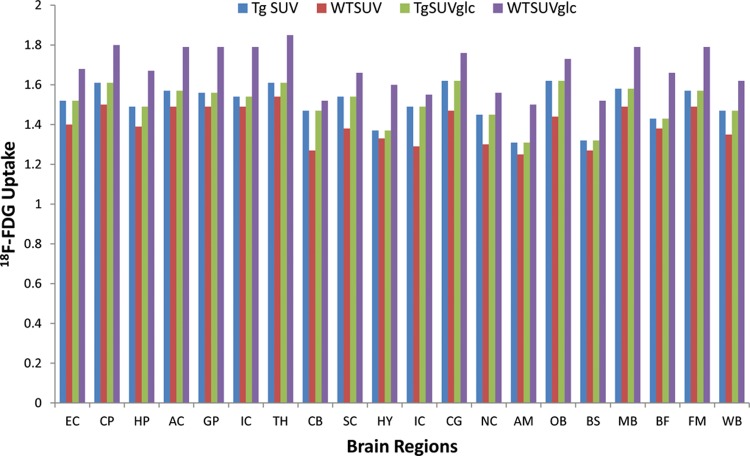
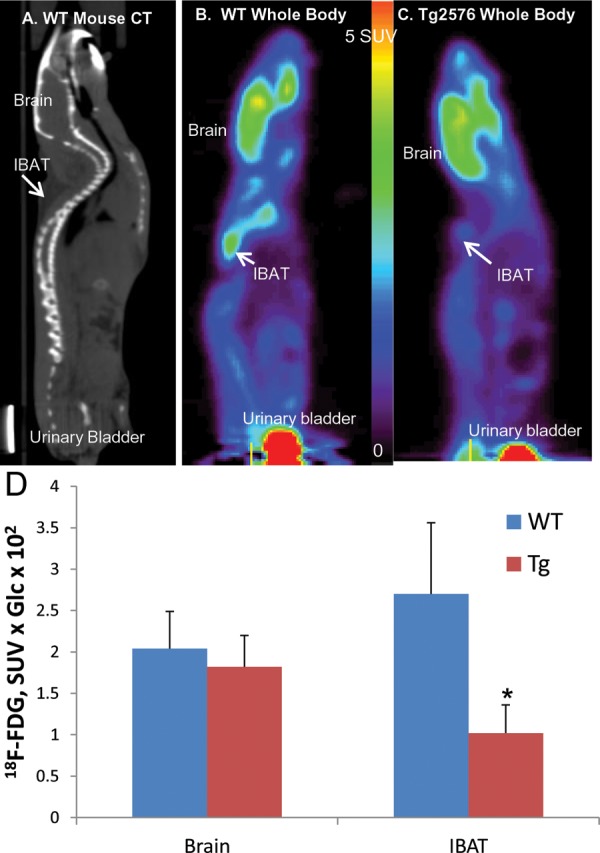
Results: Fasting blood glucose levels averaged 120 mg/dL for WT and 100 mg/dL for Tg2576. Compared to WT, Tg2576 mice exhibited a decrease in SUVglc in the various brain regions. Average reductions in the cerebrum regions were as high as -20%, while changes in cerebellum were -3%. Uptake of 18F-FDG in IBAT decreased by -60% in Tg2576 mice and was found to be significant. Intrascapular brown adipose tissue findings in Tg2576 mice are new and not previously reported. Use of blood glucose for PET data analysis and corpus callosum as reference region for autoradiographic analysis were important to detect change in Tg2576 mice.

Conclusion: Our results suggest that 18F-FDG uptake in the Tg2576 mice brain show 18F-FDG deficits only when blood glucose is taken into consideration.

Keywords: Alzheimer disease; PET imaging; brain; brown adipose tissue; glucose metabolism; norepinephrine; transgenic mice 2576.


Conflict of interest statement

Declaration of Conflicting Interests: The author(s) declared no potential conflicts of interest with respect to the research, authorship, and/or publication of this article.

Figures

Figure 1.
Figure 1.
Brain 18F-FDG images: (A) mouse brain magnetic resonance (MR) template showing coronal, sagittal, and transaxial views; (B) coregistered wild-type (WT) mouse brain 18F-FDG PET images of coronal, sagittal, and transaxial views; (C) coregistered Tg 2576 mouse brain 18F-FDG PET images of coronal, sagittal, and transaxial views; (D) screen capture of the horizontal slice of mouse brain atlas showing relevant brain regions; (E) transgenic Tg 2576 ex vivo 18F-FDG PET horizontal PET brain slice; (F) WT ex vivo 18F-FDG PET horizontal brain slice.
Figure 2.
Figure 2.
Brain 18F-FDG plot. 18F-FDG uptake in Tg 2576 and WT mice in different brain regions expressed as SUV and SUVglc (values from Table 1). Significance was poor for the difference between Tg SUV versus WT SUV (unpaired t test values P > .4), and for Tg SUVglc versus WT SUVglc, P > .17. AC indicates anterior commissure; AM, amygdala; BS, brain stem; BF, basal forebrain; CB, cerebellum; CG, central gray; CP, caudate putamen; EC, external capsule; FM, fimbria; GP, globus pallidus; HP, hippocampus; HY, hypothalamus; IC, internal capsule; IC, inferior colliculi; MB, midbrain; NC, neocortex; OB, olfactory bulb; SC, superior colliculi; SUV, standard uptake value; SUVglc, SUV × glucose; TH, thalamus; WB, whole brain; WT, wild type.
Figure 3.
Figure 3.
Ex vivo autoradiographs: (A) brain slice (20 μm thick) of WT mouse showing various brain regions and (C) shows 18F-FDG uptake in the brain slice; (B) brain slice (20 μm thick) of Tg2576 mouse showing various brain regions and (D) shows 18F-FDG uptake in the brain slice; (E and F) thioflavin staining of WT and Tg2576 brain sections showing presence of β-amyloid plaques (arrows) in the Tg2576 mice brain but absent in WT (G). Comparison of ratio of 18F-FDG uptake in brain regions versus CC used as reference region in autoradiographic brain slices (C and D) of Wild Type and Tg 2576 mice; difference between WT and Tg2576 was significant (P < .05, asterisk) for CP and CB; other brain region differences were not significant, P > .2). CB indicates cerebellum; CC, corpus callosum; CP, caudate putamen; FC, frontal cortex; HP, hippocampus; TH, thalamus.
Figure 4.
Figure 4.
Whole-body 18F-FDG uptake mice. (A) Mouse CT image slice showing brain and interscapular BAT (IBAT) regions. (B) PET image slice of in vivo 18F-FDG in WT mouse showing significant brain and IBAT uptake. (C) PET image slice of in vivo 18F-FDG in Tg 2576 mouse showing significant brain but lower IBAT uptake. (D) Average brain and IBAT uptake with standard deviation in WT mice and Tg 2576 mice showing lower IBAT uptake compared to brain in Tg 2576 and higher IBAT uptake compared to brain in WT. Difference between WT and Tg2576 was significant (P < .05, asterisk) for IBAT. CT indicates computed tomography; IBAT, intrascapular brown adipose tissue.
Figure 5.
Figure 5.
Correlation of in vivo PET ex vivo autoradiographs. Comparison of difference between 18F-FDG uptake in Tg 2576 and WT mice measured in vivo by PET (SUV and SUVglc) and ex vivo brain slices measured in autoradiographs. CB indicates cerebellum; CP, caudate putamen; FC indicates frontal cortex; HP, hippocampus; SUV, standard uptake value; SUVglc; SUV × glucose; TH, thalamus; WT, wild type.

References

    1. Webster SJ, Bachstetter AD, Nelson PT, Schmitt FA, Van Eldik LJ. Using mice to model Alzheimer’s dementia: an overview of the clinical disease and the preclinical behavioral changes in 10 mouse models. Front Genet. 2014;5(98):1–23. - PMC - PubMed
    1. Klohs J, Rudin M, Shimshek DR, Beckmann N. Imaging of cerebrovascular pathology in animal models of Alzheimer’s disease. Front Neurosci. 2014;6(32):1–30. - PMC - PubMed
    1. Hsiao K, Chapman P, Nilsen S, et al. Correlative memory deficits, Abeta elevation, and amyloid plaques in transgenic mice. Science. 1996;274(5284):99–102. - PubMed
    1. Irizarry MC, McNamara M, Fedorchak K, Hsiao K, Hyman BT. APPSw transgenic mice develop age-related A beta deposits and neuropil abnormalities, but no neuronal loss in CA1. J Neuropathol Exp Neurol. 1997;56(9):965–973. - PubMed
    1. Chapman PF, White GL, Jones MW, et al. Impaired synaptic plasticity and learning in aged amyloid precursor protein transgenic mice. Nat Neurosci. 1999;2(3):271–276. - PubMed

Publication types

Substances