

Imaging Bone-Cartilage Interactions in Osteoarthritis Using [18F]-NaF PET-MRI
- PMID: 28654417
- PMCID: PMC5470142
- DOI: 10.1177/1536012116683597
Imaging Bone-Cartilage Interactions in Osteoarthritis Using [18F]-NaF PET-MRI
Abstract
Purpose: Simultaneous positron emission tomography-magnetic resonance imaging (PET-MRI) is an emerging technology providing both anatomical and functional images without increasing the scan time. Compared to the traditional PET/computed tomography imaging, it also exposes the patient to significantly less radiation and provides better anatomical images as MRI provides superior soft tissue characterization. Using PET-MRI, we aim to study interactions between cartilage composition and bone function simultaneously, in knee osteoarthritis (OA).
Procedures: In this article, bone turnover and remodeling was studied using [18F]-sodium fluoride (NaF) PET data. Quantitative MR-derived T1ρ relaxation times characterized the biochemical cartilage degeneration. Sixteen participants with early signs of OA of the knee received intravenous injections of [18F]-NaF at the onset of PET-MR image acquisition. Regions of interest were identified, and kinetic analysis of dynamic PET data provided the rate of uptake ( Ki) and the normalized uptake (standardized uptake value) of [18F]-NaF in the bone. Morphological MR images and quantitative voxel-based T1ρ maps of cartilage were obtained using an atlas-based registration technique to segment cartilage automatically. Voxel-by-voxel statistical parameter mapping was used to investigate the relationship between bone and cartilage.
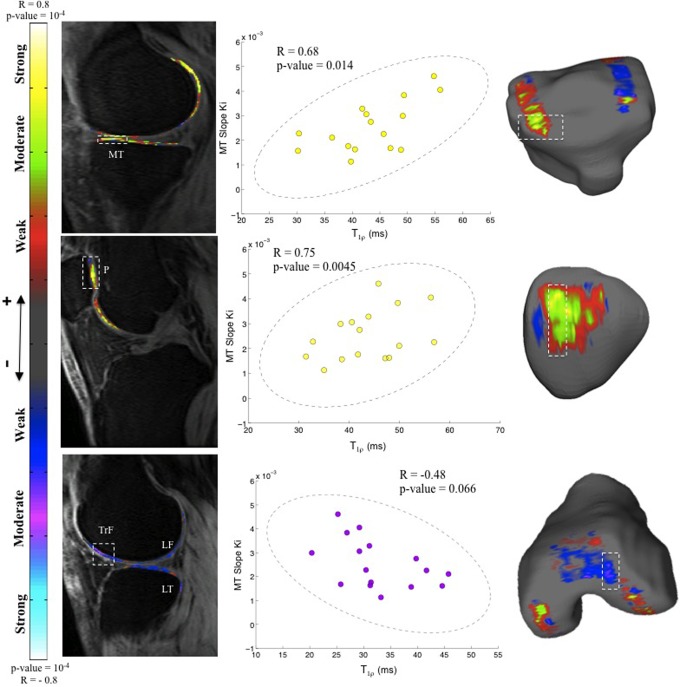
Results: Increases in cartilage T1ρ, indicating degenerative changes, were associated with increased turnover in the adjoining bone but reduced turnover in the nonadjoining compartments. Associations between pain and increased bone uptake were seen in the absence of morphological lesions in cartilage, but the relationship was reversed in the presence of incident cartilage lesions.
Conclusion: This study shows significant cartilage and bone interactions in OA of the knee joint using simultaneous [18F]-NaF PET-MR, the first in human study. These observations highlight the complex biomechanical and biochemical interactions in the whole knee joint in OA, which potentially could help assess therapeutic targets in treating OA.
Keywords: PET-MRI; T1ρ relaxation times; bone remodeling; bone–cartilage interactions; cartilage degeneration; knee osteoarthritis; multimodality imaging; sodium fluoride imaging; voxel-by-voxel statistical parameter mapping.
Conflict of interest statement
Figures


Similar articles
-
Assessment of quantitative [18F]Sodium fluoride PET measures of knee subchondral bone perfusion and mineralization in osteoarthritic and healthy subjects.Osteoarthritis Cartilage. 2021 Jun;29(6):849-858. doi: 10.1016/j.joca.2021.02.563. Epub 2021 Feb 24. Osteoarthritis Cartilage. 2021. PMID: 33639259 Free PMC article.
-
[18 F]-Sodium Fluoride PET/MR Imaging for Bone-Cartilage Interactions in Hip Osteoarthritis: A Feasibility Study.J Orthop Res. 2019 Dec;37(12):2671-2680. doi: 10.1002/jor.24443. Epub 2019 Aug 30. J Orthop Res. 2019. PMID: 31424110 Free PMC article.
-
Qualitative and Quantitative Evaluation of Morpho-Metabolic Changes in Bone Cartilage Complex of Knee Joint in Osteoarthritis Using Simultaneous 18F-NaF PET/MRI-A Pilot Study.Indian J Radiol Imaging. 2023 Jan 6;33(2):173-182. doi: 10.1055/s-0042-1760285. eCollection 2023 Apr. Indian J Radiol Imaging. 2023. PMID: 37123591 Free PMC article.
-
Evolving Role of Molecular Imaging with (18)F-Sodium Fluoride PET as a Biomarker for Calcium Metabolism.Curr Osteoporos Rep. 2016 Aug;14(4):115-25. doi: 10.1007/s11914-016-0312-5. Curr Osteoporos Rep. 2016. PMID: 27301549 Review.
-
Emerging role of integrated PET-MRI in osteoarthritis.Skeletal Radiol. 2021 Dec;50(12):2349-2363. doi: 10.1007/s00256-021-03847-z. Epub 2021 Jun 29. Skeletal Radiol. 2021. PMID: 34185124 Review.
Cited by
-
Assessment of quantitative [18F]Sodium fluoride PET measures of knee subchondral bone perfusion and mineralization in osteoarthritic and healthy subjects.Osteoarthritis Cartilage. 2021 Jun;29(6):849-858. doi: 10.1016/j.joca.2021.02.563. Epub 2021 Feb 24. Osteoarthritis Cartilage. 2021. PMID: 33639259 Free PMC article.
-
Kinetic [18F]-Fluoride of the Knee in Normal Volunteers.Clin Nucl Med. 2019 May;44(5):377-385. doi: 10.1097/RLU.0000000000002533. Clin Nucl Med. 2019. PMID: 30888996 Free PMC article.
-
18F-sodium fluoride PET-CT visualizes both axial and peripheral new bone formation in psoriatic arthritis patients.Eur J Nucl Med Mol Imaging. 2023 Feb;50(3):756-764. doi: 10.1007/s00259-022-06035-w. Epub 2022 Nov 12. Eur J Nucl Med Mol Imaging. 2023. PMID: 36370181 Free PMC article.
-
Latest advancements in imaging techniques in OA.Ther Adv Musculoskelet Dis. 2022 Dec 26;14:1759720X221146621. doi: 10.1177/1759720X221146621. eCollection 2022. Ther Adv Musculoskelet Dis. 2022. PMID: 36601087 Free PMC article. Review.
-
18F-NaF simultaneous PET/MRI in osteoarthritis: Initial observations with case illustration.J Clin Orthop Trauma. 2021 Aug 26;22:101569. doi: 10.1016/j.jcot.2021.101569. eCollection 2021 Nov. J Clin Orthop Trauma. 2021. PMID: 34513587 Free PMC article.
References
-
- Lawrence RC, Helmick CG, Arnett FC, et al. Estimates of the prevalence of arthritis and selected musculoskeletal disorders in the United States. Arthritis Rheum. 1998;41(5):778–799. - PubMed
-
- World Health Organization. Global Economic and Healthcare Burden of Musculoskeletal Disease. 2003. http://www.who.int/bulletin/volumes/81/9/Woolf.pdf.
MeSH terms
Substances
Grants and funding
LinkOut - more resources
Full Text Sources
Other Literature Sources
Medical
