

A data analysis framework for biomedical big data: Application on mesoderm differentiation of human pluripotent stem cells
- PMID: 28654683
- PMCID: PMC5487013
- DOI: 10.1371/journal.pone.0179613
A data analysis framework for biomedical big data: Application on mesoderm differentiation of human pluripotent stem cells
Abstract
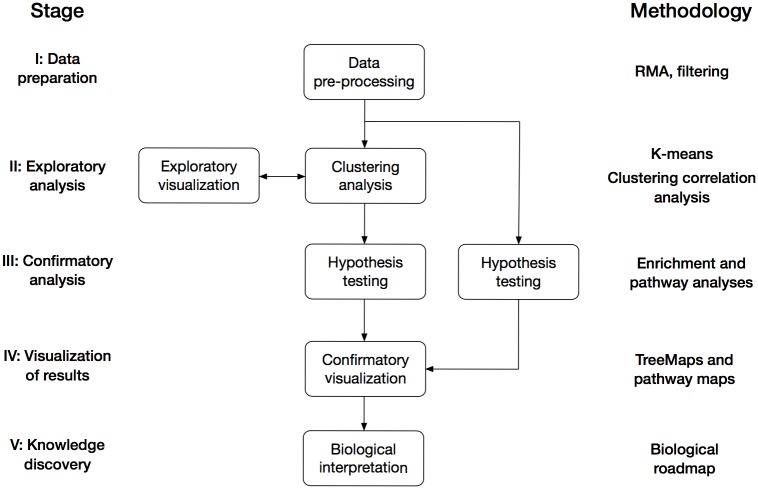
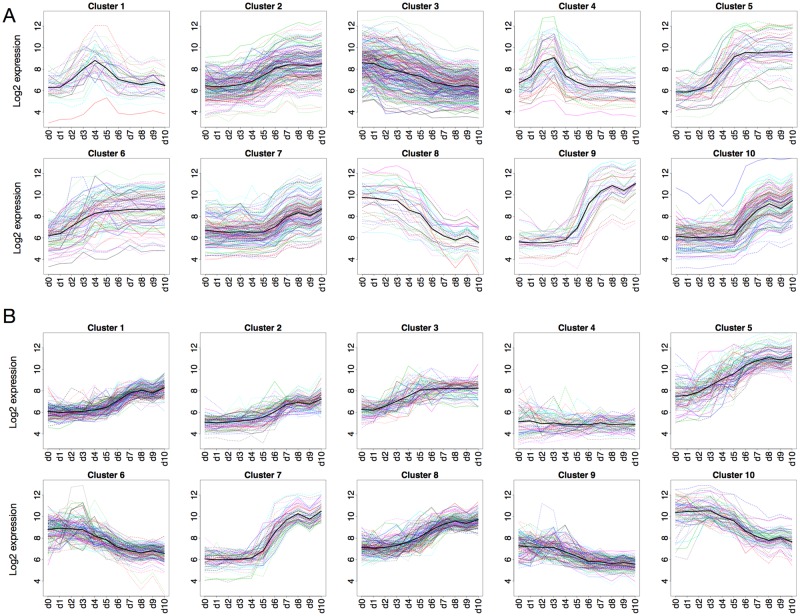
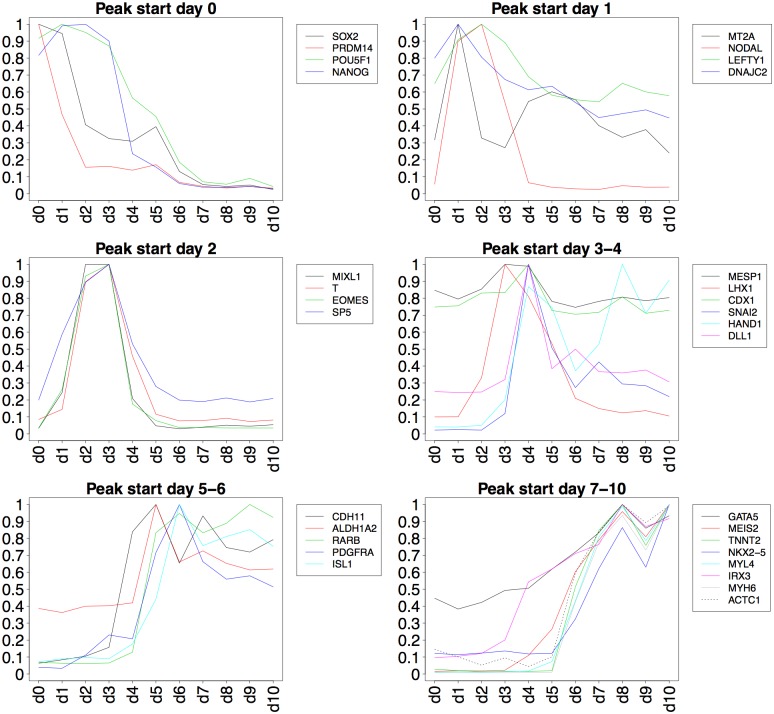
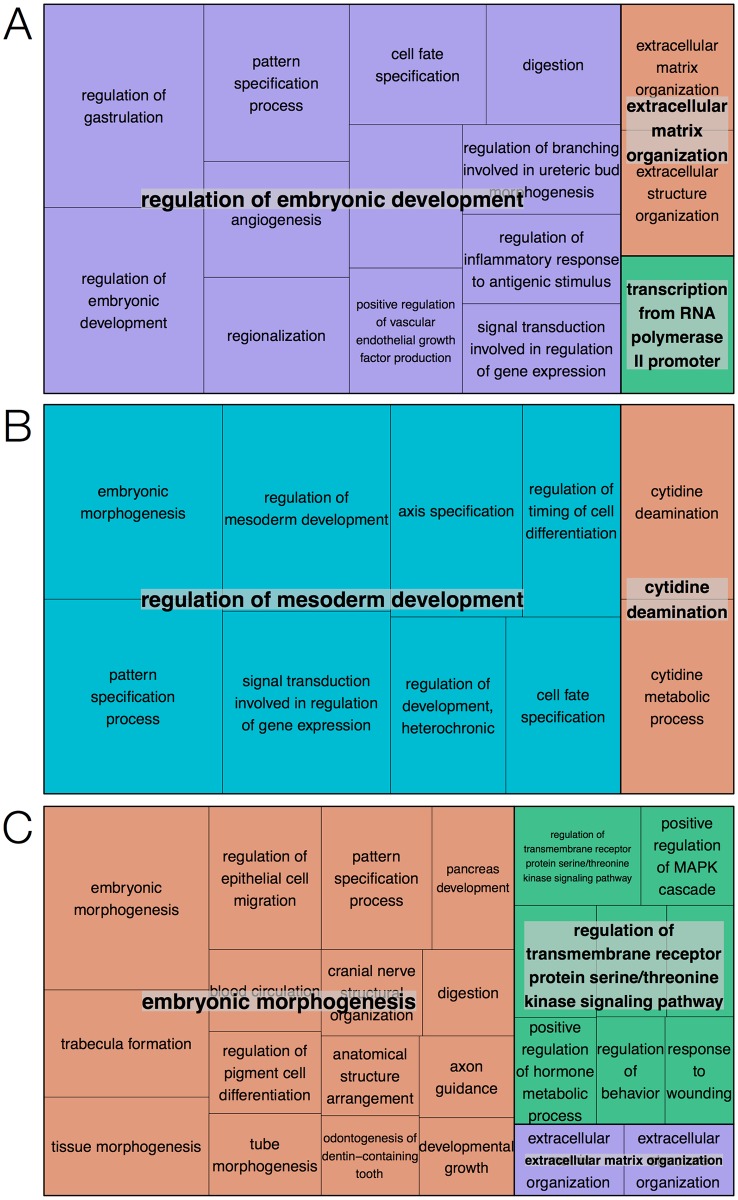
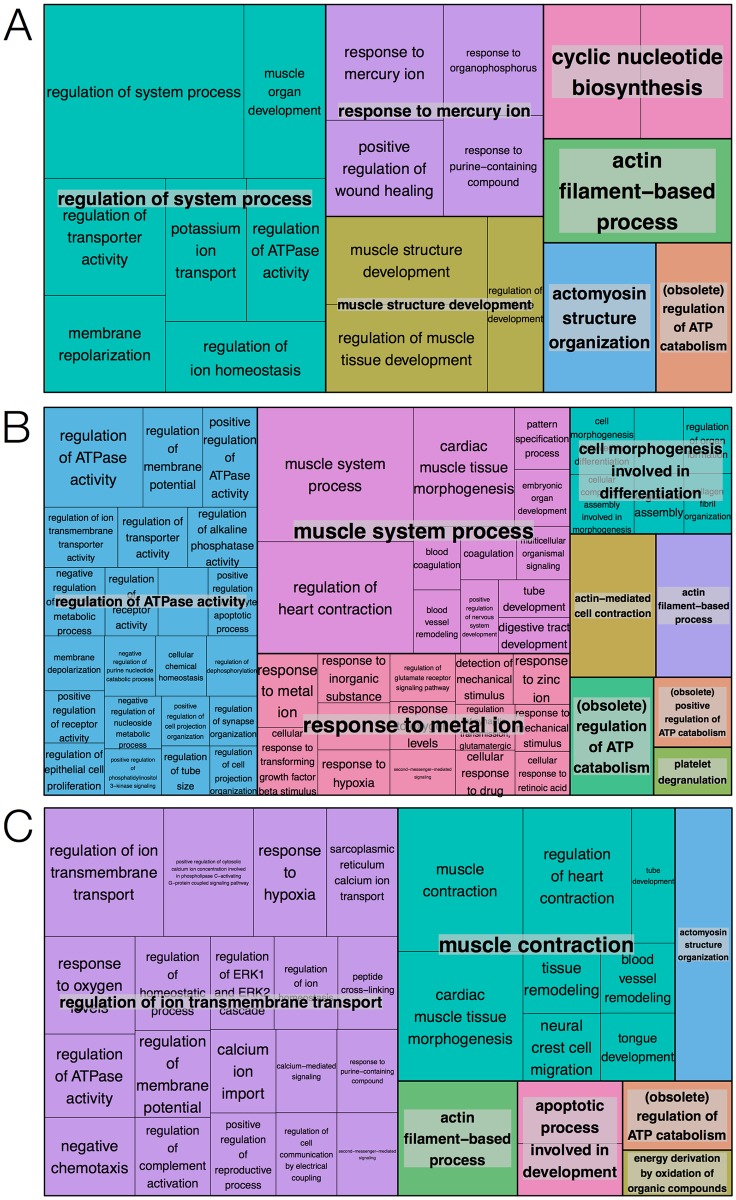
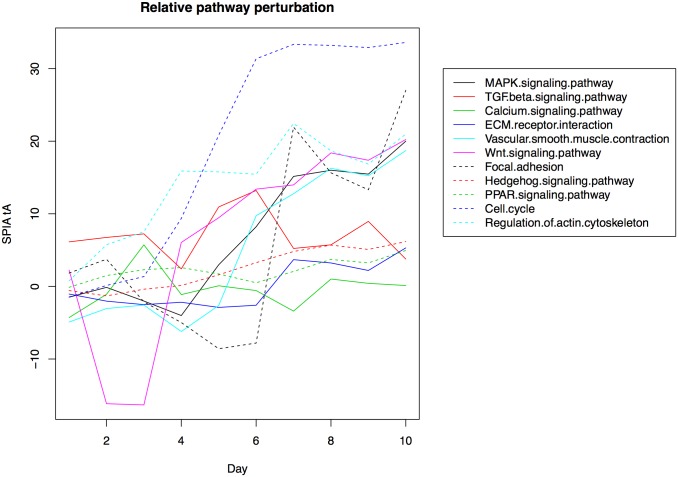
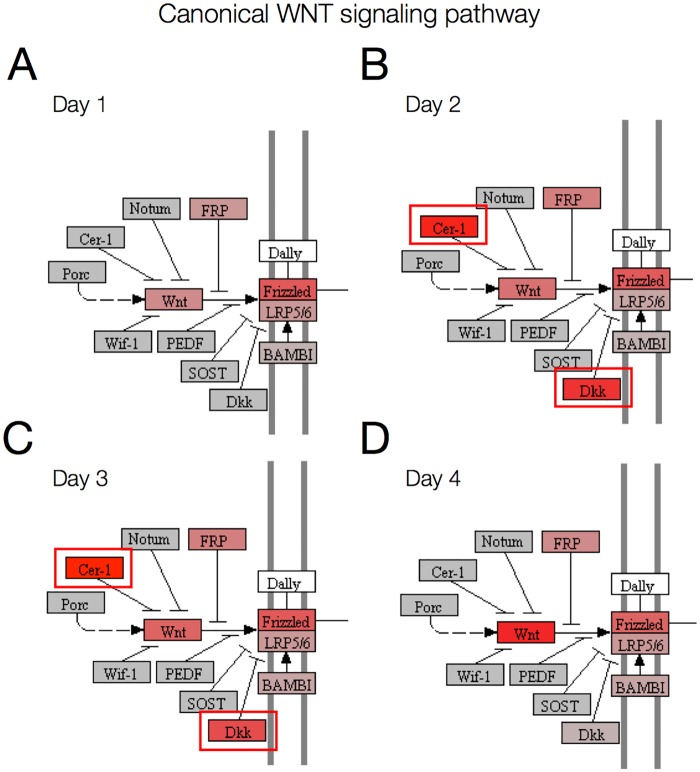
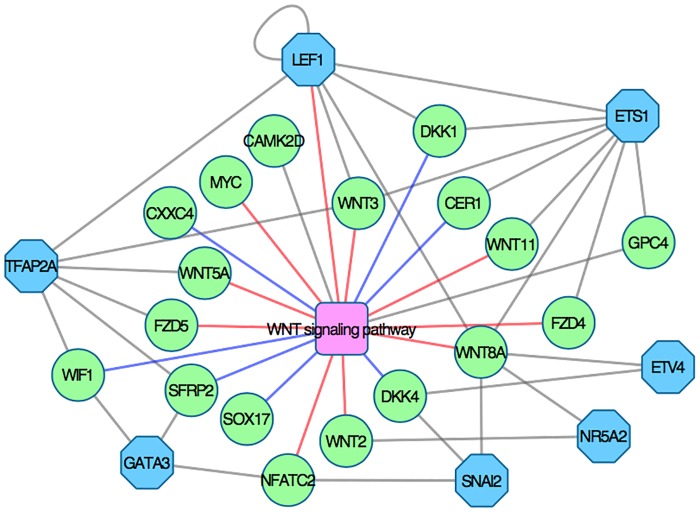
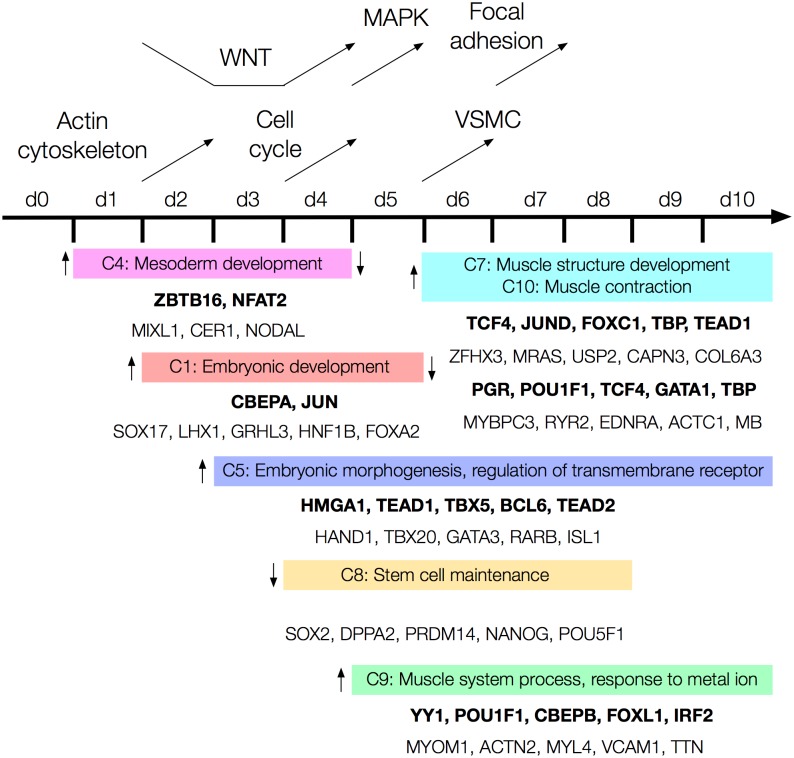
The development of high-throughput biomolecular technologies has resulted in generation of vast omics data at an unprecedented rate. This is transforming biomedical research into a big data discipline, where the main challenges relate to the analysis and interpretation of data into new biological knowledge. The aim of this study was to develop a framework for biomedical big data analytics, and apply it for analyzing transcriptomics time series data from early differentiation of human pluripotent stem cells towards the mesoderm and cardiac lineages. To this end, transcriptome profiling by microarray was performed on differentiating human pluripotent stem cells sampled at eleven consecutive days. The gene expression data was analyzed using the five-stage analysis framework proposed in this study, including data preparation, exploratory data analysis, confirmatory analysis, biological knowledge discovery, and visualization of the results. Clustering analysis revealed several distinct expression profiles during differentiation. Genes with an early transient response were strongly related to embryonic- and mesendoderm development, for example CER1 and NODAL. Pluripotency genes, such as NANOG and SOX2, exhibited substantial downregulation shortly after onset of differentiation. Rapid induction of genes related to metal ion response, cardiac tissue development, and muscle contraction were observed around day five and six. Several transcription factors were identified as potential regulators of these processes, e.g. POU1F1, TCF4 and TBP for muscle contraction genes. Pathway analysis revealed temporal activity of several signaling pathways, for example the inhibition of WNT signaling on day 2 and its reactivation on day 4. This study provides a comprehensive characterization of biological events and key regulators of the early differentiation of human pluripotent stem cells towards the mesoderm and cardiac lineages. The proposed analysis framework can be used to structure data analysis in future research, both in stem cell differentiation, and more generally, in biomedical big data analytics.
Conflict of interest statement
Figures
Similar articles
-
Hypocapnia leads to enhanced expression of pluripotency and meso-endodermal differentiation genes in mouse embryonic stem cells.Exp Cell Res. 2014 Apr 1;322(2):389-401. doi: 10.1016/j.yexcr.2014.02.008. Epub 2014 Feb 18. Exp Cell Res. 2014. PMID: 24560741
-
CD13 and ROR2 Permit Isolation of Highly Enriched Cardiac Mesoderm from Differentiating Human Embryonic Stem Cells.Stem Cell Reports. 2016 Jan 12;6(1):95-108. doi: 10.1016/j.stemcr.2015.11.006. Stem Cell Reports. 2016. PMID: 26771355 Free PMC article.
-
Differential expression of pluripotency factors Sox2 and Oct4 regulate neuronal and mesenchymal lineages.Neurosurgery. 2011 Oct;69(4):N19. doi: 10.1227/01.neu.0000405596.78460.20. Neurosurgery. 2011. PMID: 21900806 No abstract available.
-
[OCT4 and NANOG are the key genes in the system of pluripotency maintenance in mammalian cells].Genetika. 2008 Dec;44(12):1589-608. Genetika. 2008. PMID: 19178078 Review. Russian.
-
Directed differentiation of pluripotent stem cells: from developmental biology to therapeutic applications.Cold Spring Harb Symp Quant Biol. 2008;73:101-10. doi: 10.1101/sqb.2008.73.065. Epub 2009 Mar 27. Cold Spring Harb Symp Quant Biol. 2008. PMID: 19329573 Review.
Cited by
-
A Systems-level Characterization of the Differentiation of Human Embryonic Stem Cells into Mesenchymal Stem Cells.Mol Cell Proteomics. 2019 Oct;18(10):1950-1966. doi: 10.1074/mcp.RA119.001356. Epub 2019 Jul 22. Mol Cell Proteomics. 2019. PMID: 31332097 Free PMC article.
-
Human Pluripotent Stem Cell-Derived Hepatocytes Show Higher Transcriptional Correlation with Adult Liver Tissue than with Fetal Liver Tissue.ACS Omega. 2020 Mar 2;5(10):4816-4827. doi: 10.1021/acsomega.9b03514. eCollection 2020 Mar 17. ACS Omega. 2020. PMID: 32201767 Free PMC article.
-
Potential benefits of large database analysis.Ann Transl Med. 2017 Oct;5(20):413. doi: 10.21037/atm.2017.08.02. Ann Transl Med. 2017. PMID: 29152513 Free PMC article. No abstract available.
References
-
- Bacardit J, Widera P, Lazzarini N, Krasnogor N. Hard Data Analytics Problems Make for Better Data Analysis Algorithms: Bioinformatics as an Example. Big data. 2014;2: 164–176. doi: 10.1089/big.2014.0023 - DOI - PMC - PubMed
-
- Ho P-J, Yen M-L, Yet S-F, Yen BL. Current Applications of Human Pluripotent Stem Cells: Possibilities and Challenges. Cell Transplant. 2012;21: 801–814. doi: 10.3727/096368911X627507 - DOI - PubMed
-
- Thies RS, Murry CE. The advancement of human pluripotent stem cell-derived therapies into the clinic. Development. 2015;142: 3077–3084. doi: 10.1242/dev.126482 - DOI - PMC - PubMed
MeSH terms
LinkOut - more resources
Full Text Sources
Other Literature Sources
Research Materials
