

Effects of Macronutrient Distribution on Weight and Related Cardiometabolic Profile in Healthy Non-Obese Chinese: A 6-month, Randomized Controlled-Feeding Trial
- PMID: 28655596
- PMCID: PMC5672080
- DOI: 10.1016/j.ebiom.2017.06.017
Effects of Macronutrient Distribution on Weight and Related Cardiometabolic Profile in Healthy Non-Obese Chinese: A 6-month, Randomized Controlled-Feeding Trial
Abstract
Background: It has been suggested that the increase in carbohydrate at the expense of fat has contributed to the obesity epidemic in North America and some European countries. However, obesity rates in China have increased rapidly in parallel with a transition from the traditional low fat, high carbohydrate diet to a diet relatively high in fat and reduced in carbohydrate. Therefore, the current study aimed to determine whether the traditional Chinese diet was likely to be more effective than a diet with higher fat and lower carbohydrate — which is consumed in most Western societies, at weight control among a non-obese healthy population in China.
Methods:
The 6-month, two-center, three-arm, randomized, parallel-group, controlled-feeding trial was conducted at People's Liberation Army General Hospital in north China and Zhejiang University in south China. We recruited healthy young adults (aged 18–35 years, body mass index < 28) who lived in the university campus or the hospital dormitory during the whole study intervention period. They were required to eat only the foods provided, and to avoid excessive or unusual strenuous exercise during the trial. Participants were simultaneously enrolled and randomized using a computer-generated number (stratified by clinic center, age, sex, and body mass index) by data manager to one of the three isocaloric diets (1:1:1): a lower fat, higher carbohydrate diet (fat 20%, carbohydrate 66% energy); a moderate fat, moderate carbohydrate diet (fat 30%, carbohydrate 56% energy); a higher fat, lower carbohydrate diet (fat 40%, carbohydrate 46% energy). Protein provided 14% energy in all diets. We provided all food and beverages throughout the 6-month intervention. Laboratory personnel were masked to treatment allocation. Body weight was the primary outcome and measured each month. Data were primarily analyzed according to an intention-to-treat approach, supplemented with per-protocol analysis. The study was approved by the Ethics Committee at Zhejiang University. Each participant provided written informed consent. The study was registered at
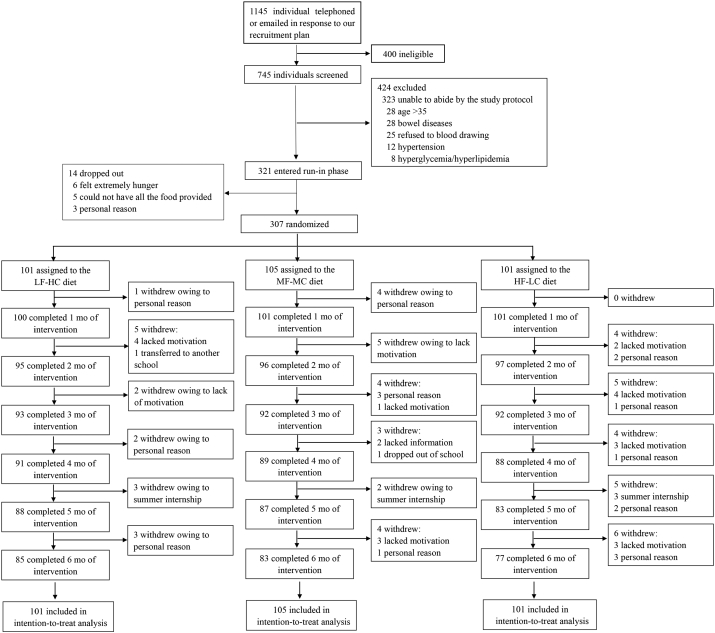
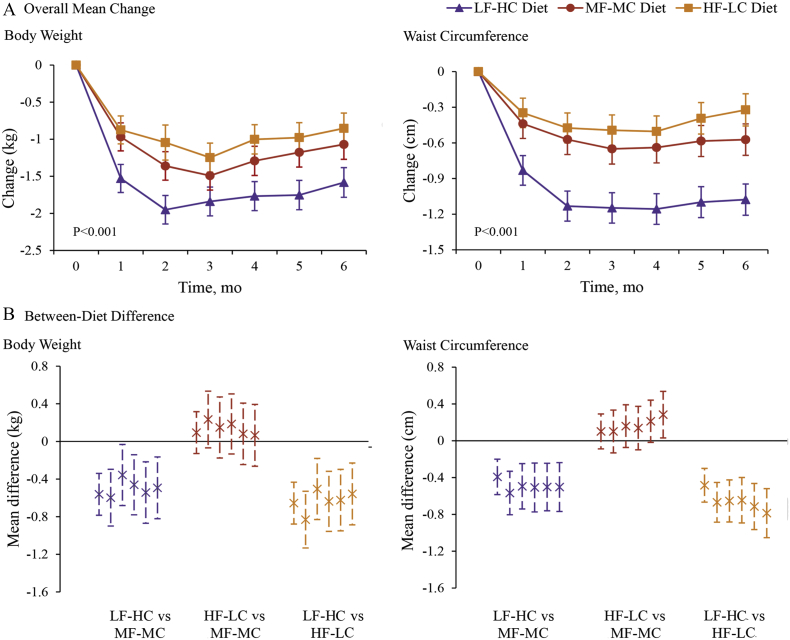
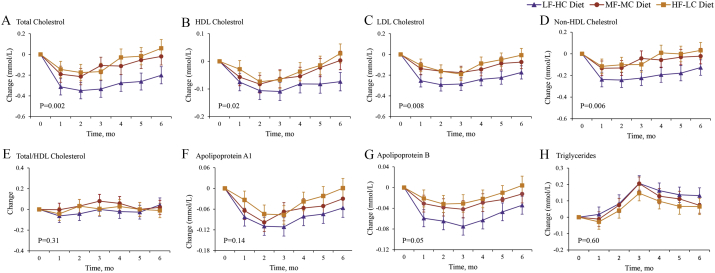
Findings: Between April 30, 2016, and October 30, 2016, 307 participants were randomly assigned to the lower fat diet (n = 101), the moderate fat diet (n = 105) and the higher fat diet (n = 101), and 245 (79.8%) participants completed the study. Reduction in body weight was significantly greater in the lower fat, higher carbohydrate group throughout the intervention (P < 0.001 for the interaction between diet group and time) than in the two other groups. Weight change at 6 months was − 1.6 kg (95% CI − 1.8 to − 1.4) in the lower fat, higher carbohydrate group; − 1.1 kg (95% CI − 1.3 to − 0.9) in the moderate fat, moderate carbohydrate group, and − 0.9 kg (95% CI − 1.1 to − 0.6) in the higher fat, lower carbohydrate group. Reduction in waist circumference, total cholesterol, low-density lipoprotein cholesterol and non-high-density lipoprotein cholesterol on the lower fat, higher carbohydrate group were greater than those observed on the other two diet groups.
Interpretation: A lower fat, relatively higher carbohydrate diet, similar in macronutrient composition to that traditionally eaten in China appears to be less likely to promote excessive weight gain and be associated with a lower cardiometabolic risk profile than a diet more typical of that eaten in Western countries in healthy non-obese Chinese. Findings from studies in European and North American populations suggesting possible benefits of carbohydrate restriction may not apply to people of other ethnicities.
Figures
Comment in
-
Low-Fat or Low Carb for Weight Loss? It Depends on Your Glucose Metabolism.EBioMedicine. 2017 Aug;22:20-21. doi: 10.1016/j.ebiom.2017.07.001. Epub 2017 Jul 4. EBioMedicine. 2017. PMID: 28693980 Free PMC article. No abstract available.
-
The Debate Goes on: New Evidence for the Role of Macronutrient Distribution on Body Weight Development: A Commentary on "Effects of Macronutrient Distribution on Weight and Related Cardiometabolic Profile in Healthy Non-Obese Chinese: A 6-month, Randomized Controlled-Feeding Trial" by Wan et al., EBioMedicine 2017, 22, 200-207.EBioMedicine. 2017 Oct;24:32-33. doi: 10.1016/j.ebiom.2017.09.018. Epub 2017 Sep 15. EBioMedicine. 2017. PMID: 28939486 Free PMC article. No abstract available.
References
-
- Austin G.L., Ogden L.G., Hill J.O. Trends in carbohydrate, fat, and protein intakes and association with energy intake in normal-weight, overweight, and obese individuals: 1971–2006. Am. J. Clin. Nutr. 2011;93:836–843. - PubMed
-
- Connor W.E., Connor S.L. Should a low-fat, high-carbohydrate diet be recommended for everyone? The case for a low-fat, high-carbohydrate diet. N. Engl. J. Med. 1997;337:562–563. (discussion 566–567) - PubMed
-
- Connor W.E., Cerqueira M.T., Connor R.W., Wallace R.B., Malinow M.R., Casdorph H.R. The plasma lipids, lipoproteins, and diet of the Tarahumara indians of Mexico. Am. J. Clin. Nutr. 1978;31:1131–1142. - PubMed
-
- Chinese Nutrition Society . Science Press; Beijing, China: 2014. Chinese Dietary Reference Intakes.
Publication types
MeSH terms
Substances
Associated data
LinkOut - more resources
Full Text Sources
Other Literature Sources
Medical
Miscellaneous
