. 2017 Aug 25;292(34):14280-14289.
doi: 10.1074/jbc.M117.797100. Epub 2017 Jun 27.

Isolation and structure-function characterization of a signaling-active rhodopsin-G protein complex

Affiliations

Isolation and structure-function characterization of a signaling-active rhodopsin-G protein complex

Yang Gao et al. J Biol Chem. .

Abstract

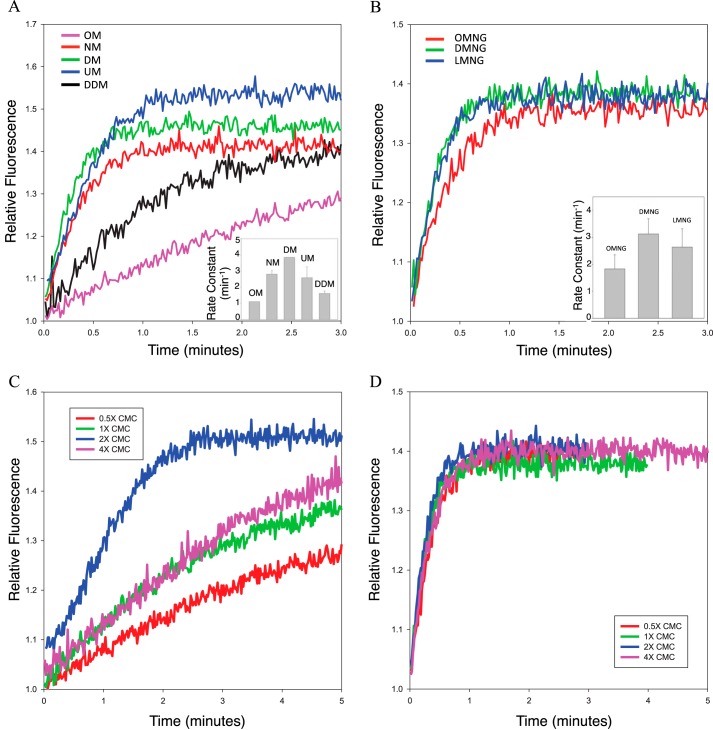
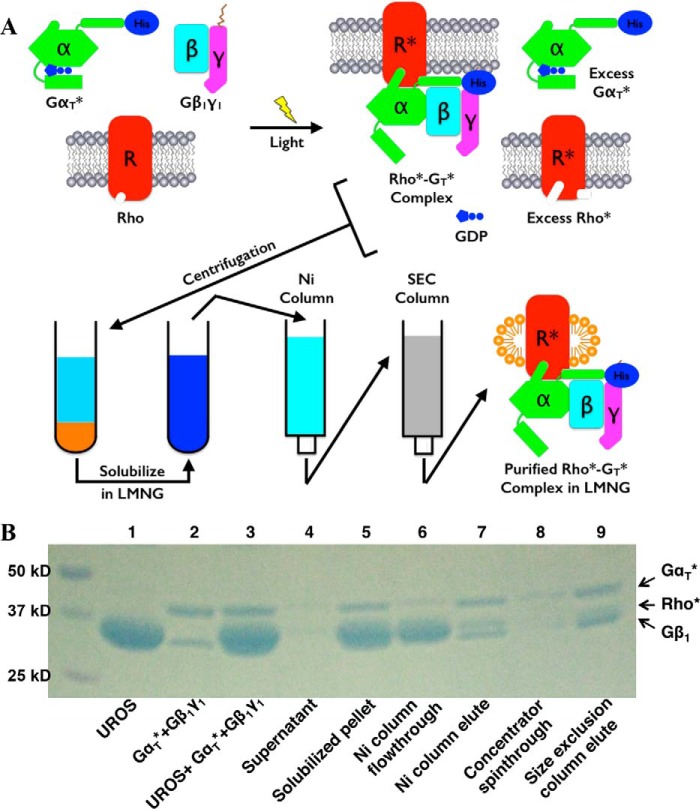
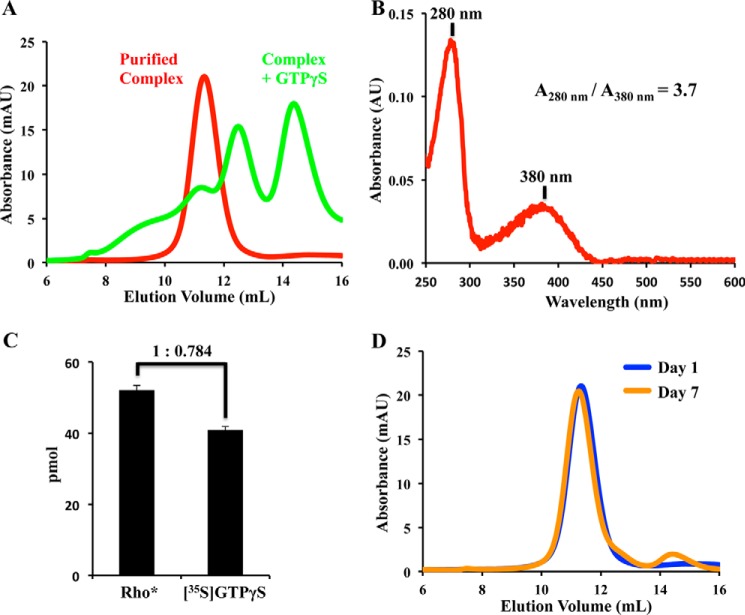
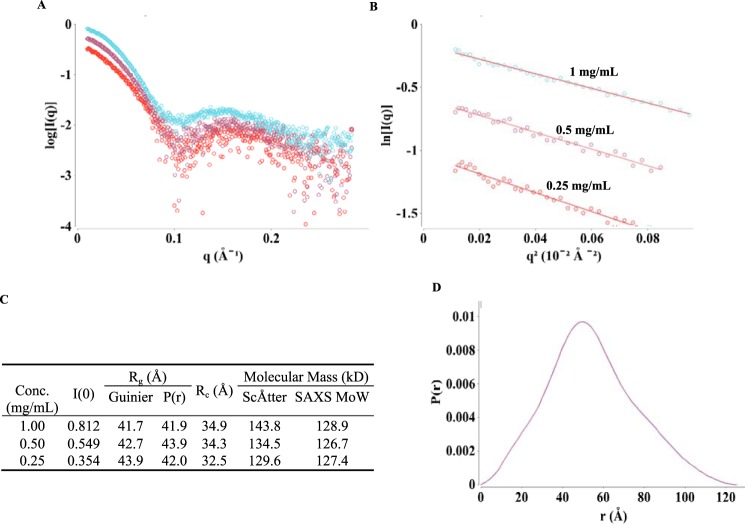
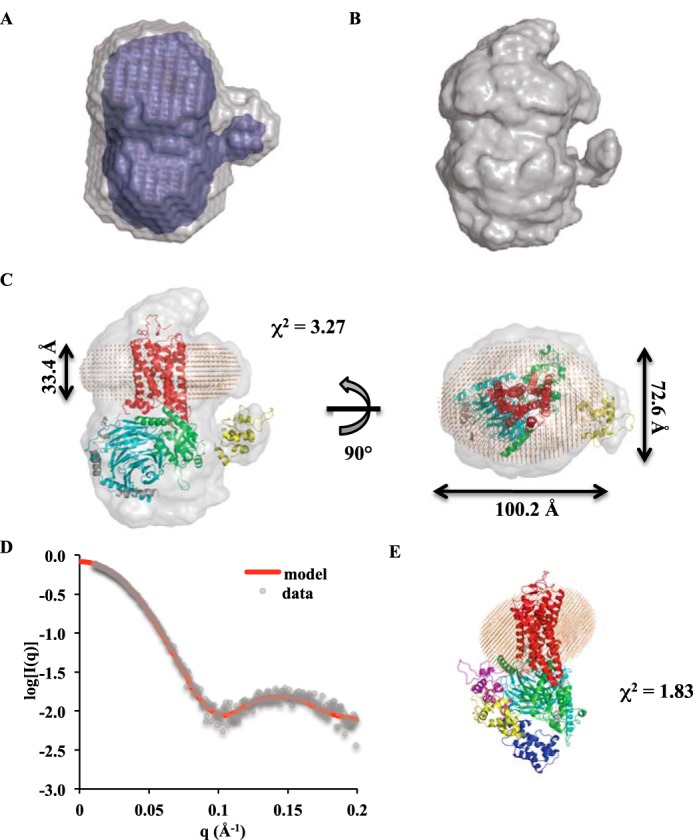
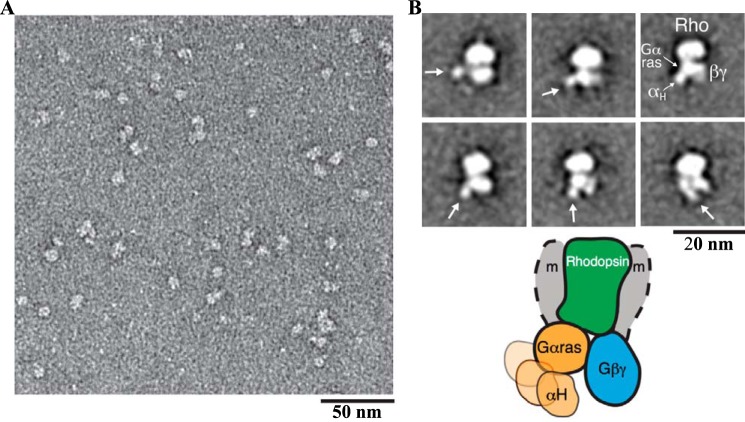
The visual photo-transduction cascade is a prototypical G protein-coupled receptor (GPCR) signaling system, in which light-activated rhodopsin (Rho*) is the GPCR catalyzing the exchange of GDP for GTP on the heterotrimeric G protein transducin (GT). This results in the dissociation of GT into its component αT-GTP and β1γ1 subunit complex. Structural information for the Rho*-GT complex will be essential for understanding the molecular mechanism of visual photo-transduction. Moreover, it will shed light on how GPCRs selectively couple to and activate their G protein signaling partners. Here, we report on the preparation of a stable detergent-solubilized complex between Rho* and a heterotrimer (GT*) comprising a GαT/Gαi1 chimera (αT*) and β1γ1 The complex was formed on native rod outer segment membranes upon light activation, solubilized in lauryl maltose neopentyl glycol, and purified with a combination of affinity and size-exclusion chromatography. We found that the complex is fully functional and that the stoichiometry of Rho* to GαT* is 1:1. The molecular weight of the complex was calculated from small-angle X-ray scattering data and was in good agreement with a model consisting of one Rho* and one GT*. The complex was visualized by negative-stain electron microscopy, which revealed an architecture similar to that of the β2-adrenergic receptor-GS complex, including a flexible αT* helical domain. The stability and high yield of the purified complex should allow for further efforts toward obtaining a high-resolution structure of this important signaling complex.

Keywords: 7-helix receptor; EM; G protein-coupled receptor (GPCR); G-protein; SAXS; photo-transduction; rhodopsin; signal transduction; structural biology; transducin.


Conflict of interest statement

The authors declare that they have no conflicts of interest with the contents of this article

Figures

Figure 1.
Figure 1.
Rho*-catalyzed nucleotide exchange activity of αT* in various detergents. A, tryptophan fluorescence emission profiles of Rho*-catalyzed nucleotide exchange in maltoside detergents at a concentration of 2× CMC (OM, octyl maltoside; NM, nonyl maltoside; DM, decyl maltoside; UM, undecyl maltoside; DDM, dodecyl maltoside). Inset, rate constants obtained from single exponential fits of the data (n = 3). The respective rate constants are as follows: OM, 0.96 ± 0.13 min−1; NM, 2.81 ± 0.21 min−1; DM, 3.83 ± 0.01 min−1; UM, 2.60 ± 0.67 min−1; DDM, 1.52 ± 0.17 min−1. B, tryptophan fluorescence emission profiles of Rho*-catalyzed nucleotide exchange in maltose neopentyl glycol detergents at a concentration of 2× CMC (OMNG, octyl maltose neopentyl glycol; DMNG, decyl maltose neopentyl glycol; LMNG, lauryl maltose neopentyl glycol). Inset, rate constants obtained from single exponential fits of the data (n = 3). The respective rate constants as follows: OMNG, 1.83 ± 0.52 min−1; DMNG, 3.12 ± 0.56 min−1; LMNG, 2.64 ± 0.68 min−1. C, tryptophan fluorescence emission profiles of Rho*-catalyzed nucleotide exchange in DDM at various detergent concentrations (CMC = 0.0087% w/v). D, tryptophan fluorescence emission profiles of Rho*-catalyzed nucleotide exchange in LMNG at various detergent concentrations (CMC = 0.001% w/v).
Figure 2.
Figure 2.
Purification of the Rho*–GT* complex. A, purification scheme (see “Experimental procedures”). B, SDS-polyacrylamide gel of the purification process. (This is representative of more than 20 repetitions of the purification process.)
Figure 3.
Figure 3.
Stoichiometry determination and SEC profiles of the purified Rho*–GT* complex. A, SEC profiles of the purified Rho*–GT* complex (red) and its dissociation upon the addition of GTPγS (green). (This is representative of more than 10 similar sets of SEC profiles.) B, UV-visible spectrum of purified complex. (This is representative of more than 20 similar spectra of the purified complex.) C, ratio of Rho* to GT* in the Rho*–GT* complex was determined by a [35S]GTPγS binding assay and the extinction coefficient for the chromophore retinal in Rho*. (This experiment was repeated three times.) D, SEC profiles of the Rho*–GT* complex after 1 day (blue) and 7 days (orange). (This is representative of more than 20 similar sets of SEC profiles.)
Figure 4.
Figure 4.
SAXS data and analyses of the Rho*–GT* complex. A, SAXS scattering profiles from protein concentrations of 1, 0.5, and 0.25 mg/ml (colored cyan, purple, and red, respectively). (Each curve shown is the average of 10 scattering curves.) B, Guinier plots for q*Rg <1.3 region of the scattering curve. C, SAXS parameters and calculation results. D, pair distribution function calculated from 1 mg/ml scattering profile.
Figure 5.
Figure 5.
Ab initio envelopes and model of the Rho*–GT* complex. A, DAMMIN envelopes (averaged and filtered envelopes are colored in gray and blue, respectively). B, GASBOR envelope. C, superimposition of the Rho*–GT* complex model with the GASBOR envelope. Rho* is in red; the αT* GTPase domain is in green; the αT* helical domain is in yellow; β1 is in cyan; γ1 is in gray; and detergents are shown as orange beads. D, theoretical scattering profile of the Rho*–GT* complex model (red line) overlaid with experimental data (gray dots). E, position of the αT* helical domain (yellow) in the model compared with open (purple) and closed (blue) positions from X-ray crystal structures.
Figure 6.
Figure 6.
EM 2D projection analysis of the Rho*–GT* complex. A, raw EM image of the detergent-solubilized Rho*–GT* complex embedded in negative stain. B, representative EM class averages of the Rho*–GT* complex (the positions of the αΤ* helical domain are indicated by an arrow). The schematic model represents the conformations reflected by the EM averages, depicting the variable positioning of the helical domain (the position of the detergent micelle is indicated by gray shaded arcs and labeled with m).

References

    1. Ma P., and Zemmel R. (2002) Value of novelty? Nat. Rev. Drug Discov. 1, 571–572 - PubMed
    1. De Lean A., Stadel J. M., and Lefkowitz R. J. (1980) A ternary complex model explains the agonist-specific binding properties of the adenylate cyclase-coupled β-adrenergic receptor. J. Biol. Chem. 255, 7108–7117 - PubMed
    1. Rosenbaum D. M., Cherezov V., Hanson M. A., Rasmussen S. G., Thian F. S., Kobilka T. S., Choi H. J., Yao X. J., Weis W. I., Stevens R. C., and Kobilka B. K. (2007) GPCR engineering yields high-resolution structural insights into β2-adrenergic receptor function. Science 318, 1266–1273 - PubMed
    1. Caffrey M., and Cherezov V. (2009) Crystallizing membrane proteins using lipidic mesophases. Nat. Protoc. 4, 706–731 - PMC - PubMed
    1. Xu S., and Fischetti R. F. (2007) Design and performance of a compact collimator on GM/CA-CAT at the advanced photon source. Proc. SPIE. 6665, 1–8

Publication types

MeSH terms

LinkOut - more resources