. 2017 Aug 11;292(32):13111-13121.
doi: 10.1074/jbc.M117.800904. Epub 2017 Jun 27.

Post-translational modification of the membrane type 1 matrix metalloproteinase (MT1-MMP) cytoplasmic tail impacts ovarian cancer multicellular aggregate dynamics

Affiliations

Post-translational modification of the membrane type 1 matrix metalloproteinase (MT1-MMP) cytoplasmic tail impacts ovarian cancer multicellular aggregate dynamics

Jing Yang et al. J Biol Chem. .

Abstract

Membrane type 1 matrix metalloproteinase (MT1-MMP, MMP-14) is a transmembrane collagenase highly expressed in metastatic ovarian cancer and correlates with poor survival. Accumulating evidence shows that the cytoplasmic tail of MT1-MMP is subjected to phosphorylation, and this post-translational modification regulates enzymatic activity at the cell surface. To investigate the potential role of MT1-MMP cytoplasmic residue Thr567 phosphorylation in regulation of metastasis-associated behaviors, ovarian cancer cells that express low endogenous levels of MT1-MMP were engineered to express wild-type MT1-MMP, a phosphomimetic mutant (T567E), or a phosphodeficient mutant (T567A). Results show that Thr567 modulation influences behavior of both individual cells and multicellular aggregates (MCAs). The acquisition of either wild-type or mutant MT1-MMP expression results in altered cohesion of epithelial sheets and the formation of more compact MCAs relative to parental cells. Cells expressing MT1-MMP-T567E phosphomimetic mutants exhibit enhanced cell migration. Furthermore, MCAs formed from MT1-MMP-T567E-expressing cells adhere avidly to both intact ex vivo peritoneal explants and three-dimensional collagen gels. Interaction of these MCAs with peritoneal mesothelium disrupts mesothelial integrity, exposing the submesothelial collagen matrix on which MT1-MMP-T567E MCAs rapidly disperse. Together, these findings suggest that post-translational regulation of the Thr567 in the MT1-MMP cytoplasmic tail may function as a regulatory mechanism to impact ovarian cancer metastatic success.

Keywords: cadherin; matrix metalloproteinase (MMP); metastasis; migration; ovarian cancer.


Conflict of interest statement

The authors declare that they have no conflicts of interest with the contents of this article

Figures

Figure 1.
Figure 1.
Expression of MT1-MMP cytoplasmic tail mutants in ovarian cancer cells. A, schematic illustration of wild-type and cytoplasmic tail mutations of MT1-MMP. Structural domains of MT1-MMP are shown from the N terminus: signal peptide (SP), pro-peptide that contains a basic RRKR motif cleaved by furin (Pro), catalytic domain that contains the zinc-binding site (Zn2+) (CAT), hinge region (H), hemopexin-like domain (HPX), linker (L), transmembrane domain (TM), and cytoplasmic tail domain (20 amino acids) (CT). Thr567 in the cytoplasmic tail was mutated either to Glu to make a phosphomimetic mutant (TE) or to Ala to generate a phosphodefective mutant (TA) (22, 23). B, cell lines were generated in an OVCA433 parental background expressing GFP-tagged MT, TE, and TA. Western blotting was performed to detect MT1-MMP, E-cadherin (E-cad), and β-actin as a loading control. Cell lysates (20 μg) were electrophoresed on 9% SDS-polyacrylamide gels and electroblotted to Immobilon as described under “Experimental procedures.” Blots were probed with anti-MT1-MMP (1:2,000 dilution) or anti-E-cadherin (1:5,000 dilution) as indicated and developed using a peroxidase-conjugated secondary antibody (1:4,000 dilution) and ECL detection, as described under “Experimental procedures.” Blots were stripped and reprobed with anti-β-actin-peroxidase antibody (1:100,000 dilution) to ensure equal loading. Top, arrow, 55-kDa active MT1-MMP; arrowhead, 82-kDa GFP-tagged MT1-MMP. Second panel, arrow, 120-kDa intact E-cadherin; arrowhead, 100-kDa cleaved E-cadherin. C, densitometric analysis of cleaved E-cadherin. Experiments were repeated in biologic triplicates. **, p < 0.01.
Figure 2.
Figure 2.
Effect of MT1-MMP expression on epithelial cohesion. A, confluent cell–cell adherent monolayers were separated from culture dishes as cell–cell adherent sheets by pulsing with dispase until sheets detached from the dish. B, cells were cultured to confluence in the absence or presence of 50 μm GM6001 (broad-spectrum MMP inhibitor), washed extensively, and incubated in 2 ml of dispase solution until the cell monolayer was detached. Released cell sheets were subjected to mechanical disruption using 50 inversion cycles on a rotator. The dissociated cellular fragments were imaged with a Leica M60 stereo microscope. C, cellular fragments were analyzed using ImageJ and categorized as small (0.02–0.1 mm2), medium (0.11–0.5 mm2), or large (>0.51 mm2) according to the fragment size. The total number of fragments in each category was manually counted. Results shown represent three independent biological replicates. D, cells were cultured to confluence in the absence (−) or presence of GM6001 (25 μm (+) or 50 μm (++)), washed, and incubated in dispase until the cell sheet was released, followed by rotation for mechanical disruption. The dissociated cellular fragments were lysed in mRIPA buffer, and Western blotting was performed to detect E-cadherin (E-cad). β-Actin was used as a loading control.
Figure 3.
Figure 3.
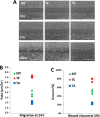
Phosphomimetic MT1-MMP-T567E enhances cell migration. A, cells were grown using a cell culture insert containing two reservoirs blocked by the insert wall. The insert was removed to allow cell migration between the reservoirs, and cells were photographed at various time points up to 24 h. B, rate indicates the average distance traveled by the cell front at each time point relative to the 0 h time point. p < 0.01 for the comparisons TE versus MT, TE versus TA, and MT versus TA. C, percentage closure indicates the area fraction of the space at the 0 h time point that has been covered by migrating cells. p < 0.01 for the comparisons TE versus MT, TE versus TA, and MT versus TA. Experiments were repeated three times independently.
Figure 4.
Figure 4.
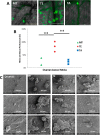
Expression of MT1-MMP mutants alters MCA morphology. A, diagram depicting MCA generation via the hanging drop method. Cells (300–2,000 in 20 μl) were seeded onto the top of 35-mm culture dishes and then gently inverted and allowed to aggregate for 2 days. MCAs were subsequently imaged or used in an ex vivo peritoneal explant adhesion assay (described in the legend to Fig. 5). B, MCAs were imaged using Olympus BX43 light microscopy (first column) or with FEI-MAGELLAN 400 FESEM scanning electron microscopy as described under “Experimental procedures.” Magnification is as indicated. C, MCA area (μm2) was measured using ImageJ from images acquired using Olympus BX43 light microscopy. The scatter plot represents the area measurement of n = 10 MCAs. p < 0.05 was accepted as the level of significance. **, p < 0.01.
Figure 5.
Figure 5.
Phosphomimetic MT1-MMP-T567E mutant enhances adhesion of MCAs to intact ex vivo peritoneal explants. A, peritoneal tissue was dissected from female mice (as depicted in Fig. 4A) and pinned mesothelium side-up on optically clear silastic resin. MCAs were generated from fluorescently tagged cells via the hanging drop method and were distributed evenly on excised peritonea (∼300 MCAs/explant). After 4 h, adhesion of MCAs to peritoneal tissue was quantified by fluorescence microscopy using the EVOS FL cell imaging system. B, adherent MCAs were imaged with EVOS FL cell imaging system for the whole peritoneum. To minimize the individual mouse peritonea difference, for each mouse, the left side peritoneum was always loaded with Ovca433 MCAs as an internal normalization control, and the right side peritoneum was used for loading MCAs from each mutant cell line. MCA area (μm2) was determined using ImageJ, summed as a total area for each cell line, and normalized with Ovca433 MCA total area using the same mouse left side peritoneum. The assay was repeated in three biological replicates, and statistical analysis was performed using one-way ANOVA. **, p < 0.01. C, MCA interaction with peritoneal explants was imaged using FEI-MAGELLAN 400 FESEM scanning electron microscopy as described under “Experimental procedures.”
Figure 6.
Figure 6.
Phosphomimetic MT1-MMP-T567E mutant exhibits enhanced dispersal on intact ex vivo peritoneal explants and collagen surfaces. A and B, peritoneal tissue was dissected from female mice as depicted in Fig. 4A and pinned mesothelium side-up on optically clear silastic resin. MCAs were generated via the hanging drop method from parental Ovca433 cells or Ovca433 cells expressing MT, TE, or TA and were distributed evenly on excised peritonea. Peritoneal explants were imaged using FEI-MAGELLAN 400 FESEM scanning electron microscopy, as described under “Experimental procedures.” The image in A shows only submesothelial collagen matrix, whereas B shows the boundary (yellow line) of an MCA interacting with collagen. C, MCAs were transferred independently into single wells of a plate containing collagen gels, and dispersal patterns were imaged daily for 4 days using the EVOS® FL cell imaging system. A representative time series of dispersal of an MCA composed of MT1-MMP-T567E-expressing cells is shown. D, quantitative image analysis was performed using ImageJ to quantify MCA dispersal at each time point. MCA area (μm2) was measured using ImageJ, and MCA area ratio was normalized by dividing each day MCA area over day 1 MCA area for each cell line. Results shown represent three independent biological replicates. Statistical analysis was performed using one-way ANOVA. For day 2 comparisons, p < 0.05 for TE versus Ovca433, TE versus MT, and TE versus TA. For day 4 comparisons, p < 0.05 for TE versus Ovca433 and TE versus TA.

References

    1. Siegel R. L., Miller K. D., and Jemal A. (2016) Cancer statistics, 2016. CA Cancer J. Clin. 66, 7–30 - PubMed
    1. Naora H., and Montell D. J. (2005) Ovarian cancer metastasis: integrating insights from disparate model organisms. Nat. Rev. Cancer 5, 355–366 - PubMed
    1. Lengyel E. (2010) Ovarian cancer development and metastasis. Am. J. Pathol. 177, 1053–1064 - PMC - PubMed
    1. Burleson K. M., Casey R. C., Skubitz K. M., Pambuccian S. E., Oegema T. R. Jr, and Skubitz A. P. (2004) Ovarian carcinoma ascites spheroids adhere to extracellular matrix components and mesothelial cell monolayers. Gynecol. Oncol. 93, 170–181 - PubMed
    1. Casey R. C., Burleson K. M., Skubitz K. M., Pambuccian S. E., Oegema T. R. Jr, Ruff L. E., and Skubitz A. P. (2001) β1-Integrins regulate the formation and adhesion of ovarian carcinoma multicellular spheroids. Am. J. Pathol. 159, 2071–2080 - PMC - PubMed

Publication types

MeSH terms