Review
. 2017 Jun 13:82:311-319.
doi: 10.12659/PJR.901791. eCollection 2017.

Toxins in Brain! Magnetic Resonance (MR) Imaging of Toxic Leukoencephalopathy - A Pictorial Essay

Affiliations
Review

Toxins in Brain! Magnetic Resonance (MR) Imaging of Toxic Leukoencephalopathy - A Pictorial Essay

Yogesh Kumar et al. Pol J Radiol. .

Abstract

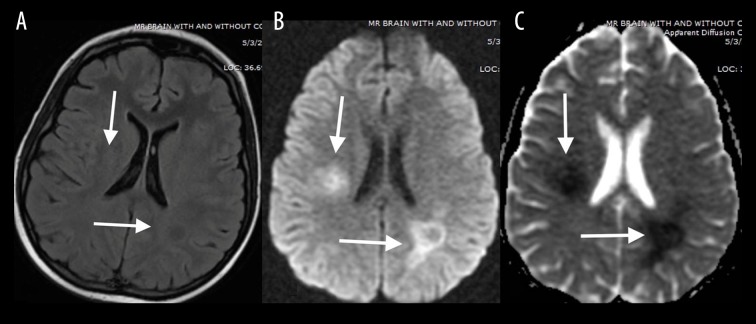
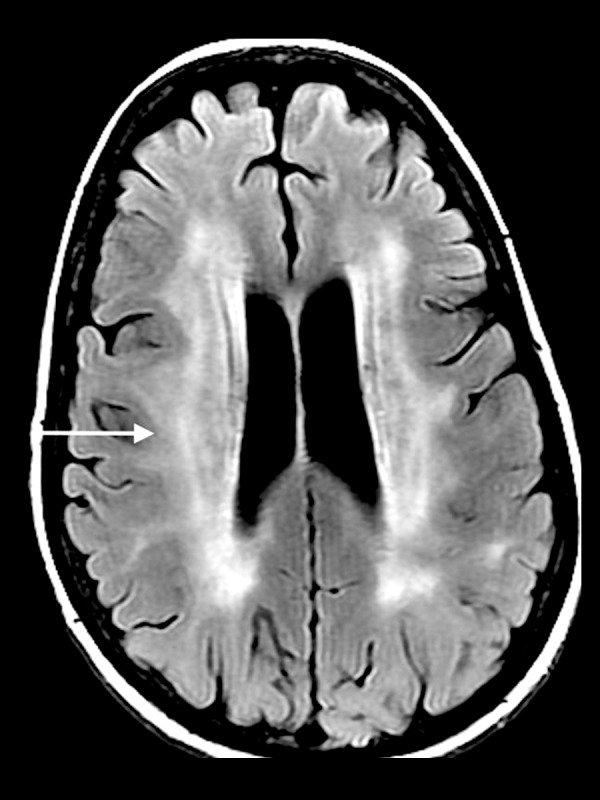
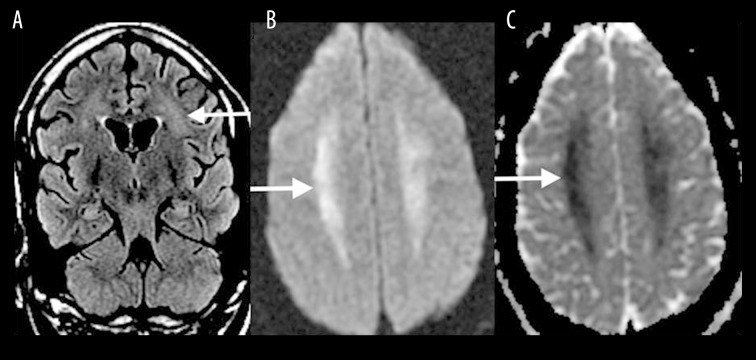
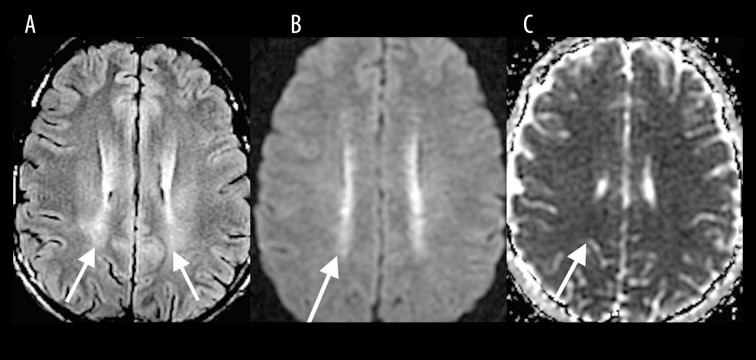
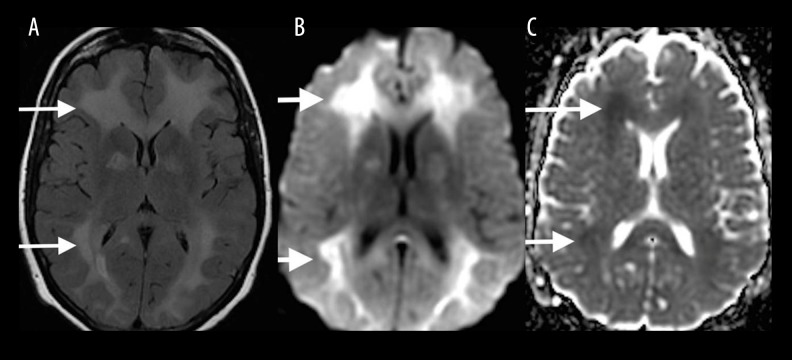
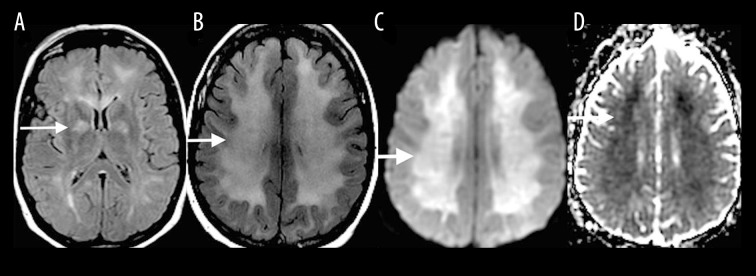
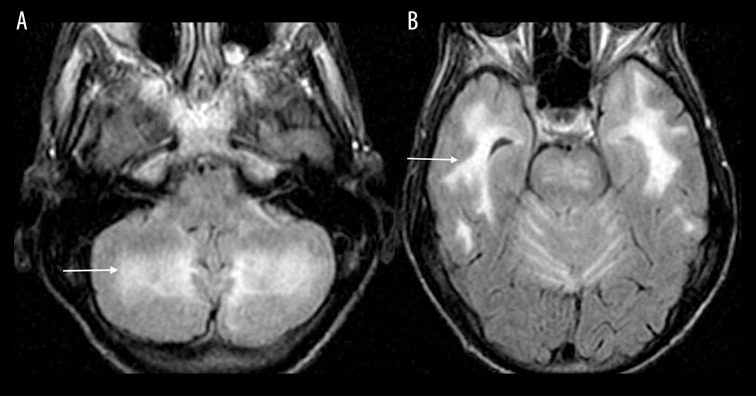
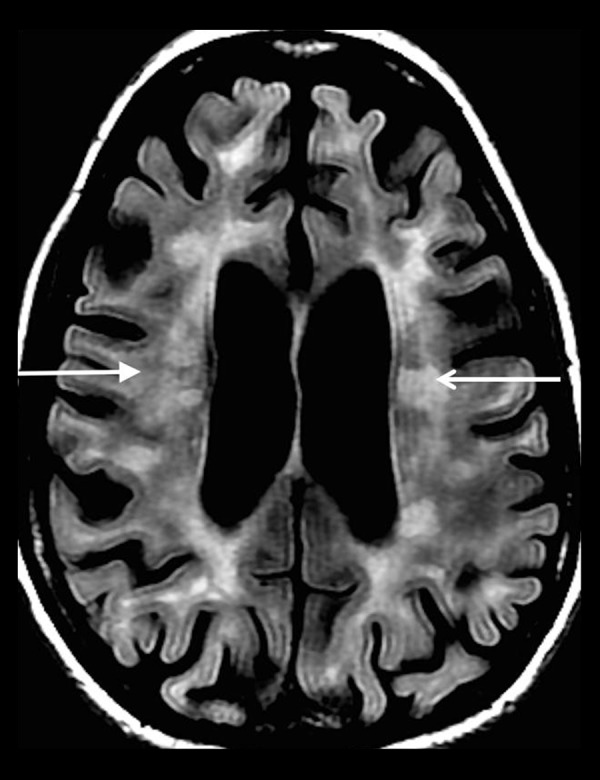
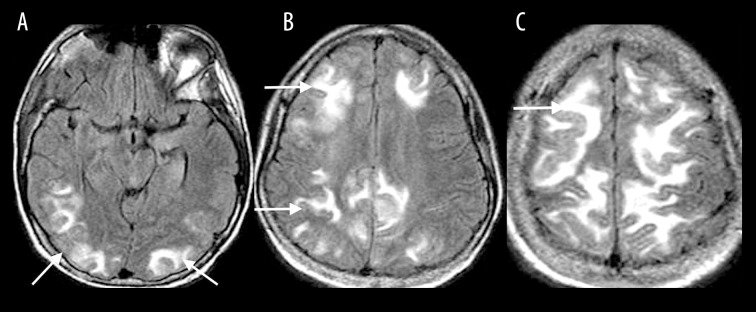
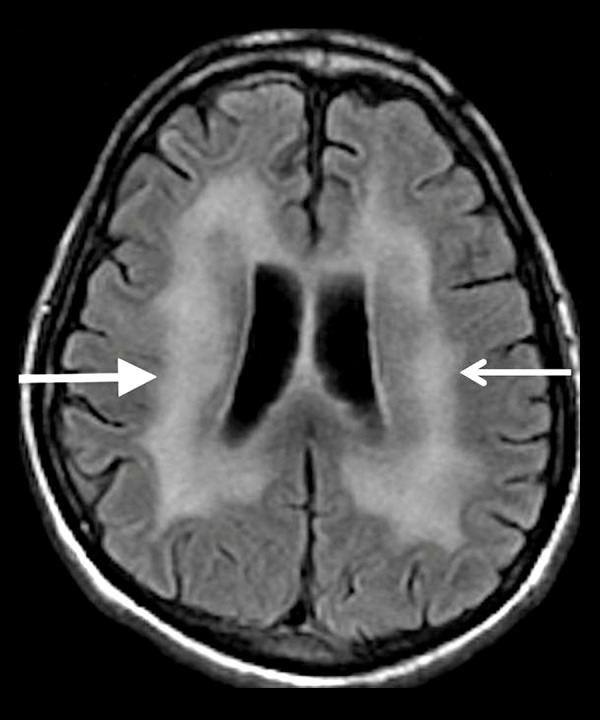
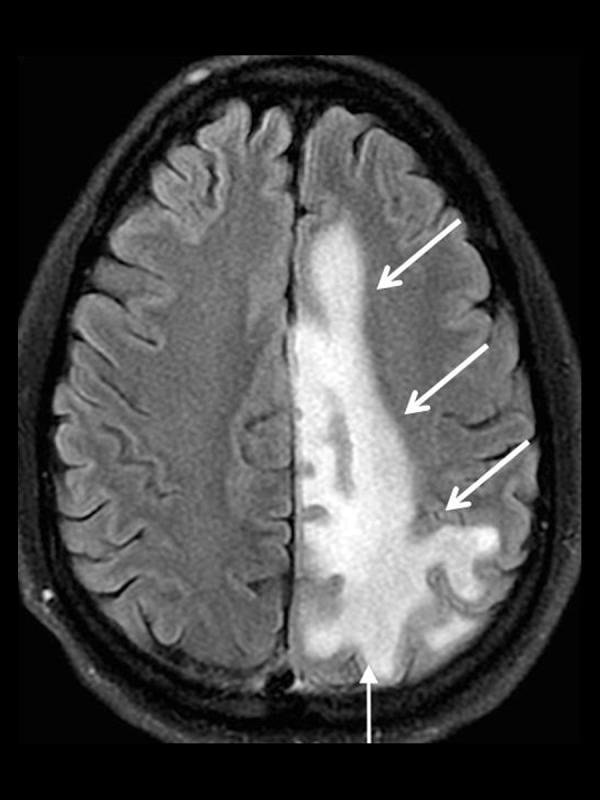
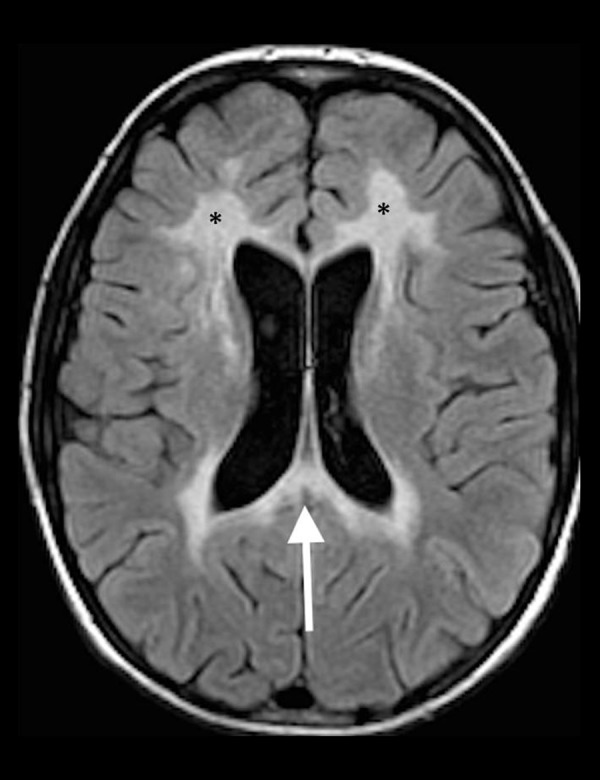
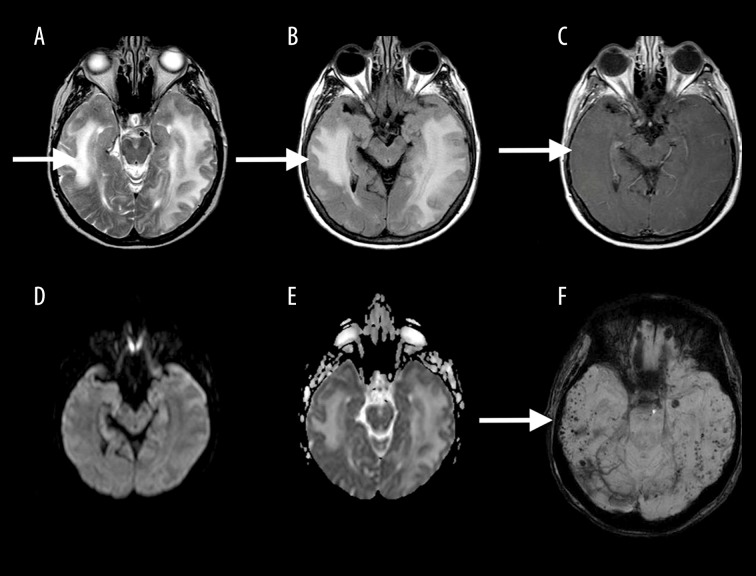
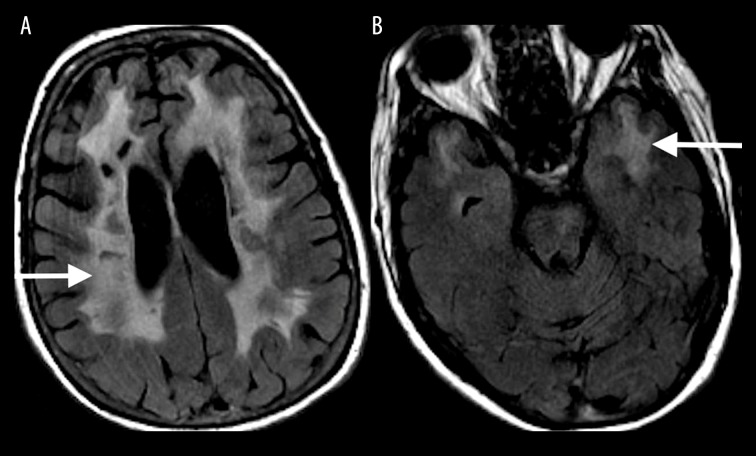
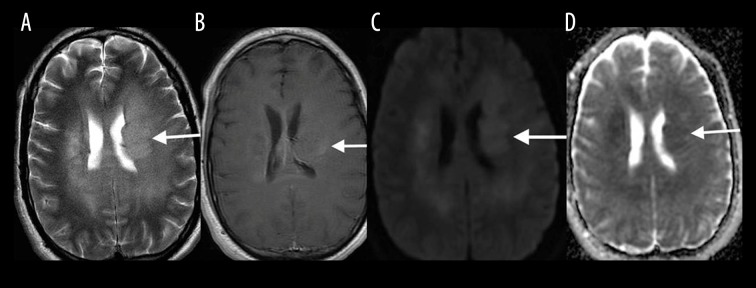
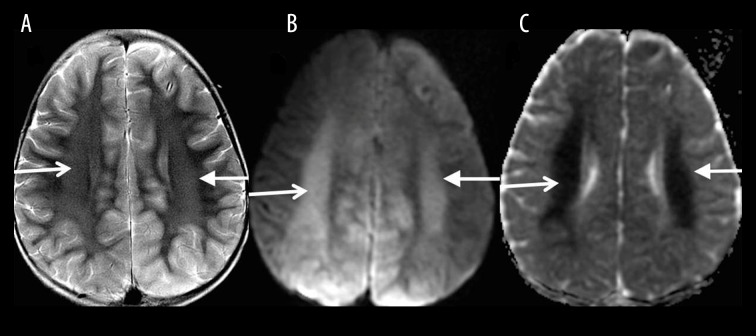
Toxic leukoencephalopathy results from damage to the white matter caused by various toxins. It manifests itself as white matter signal abnormalities with or without the presence of restricted diffusion. These changes are often reversible if the insulting agent is removed early, with the exception of posthypoxic leukoencephalopathy that can manifest itself 1-2 weeks after the initial insult. However, many other potential causes of white matter signal abnormalities can mimic the changes of toxic leukoencephalopathy. Thus, familiarity with the causes, clinical presentation and particularly imaging findings of toxic leukoencephalopathy is critical for early treatment and improved prognosis. The purpose of this pictorial essay is to familiarize the reader with the various causes of toxic leukoencephalopathy along with its differential diagnoses and mimics.

Keywords: Brain Diseases, Metabolic; Magnetic Resonance Imaging; Toxic Actions.


Conflict of interest statement

Conflict of interest The authors declare that they have no conflict of interest.

Figures

Figure 1
Figure 1
A 15-year-old girl treated for acute lymphoblastic leukemia who presented with headache after methotrexate treatment initiation. Axial T2-FLAIR image (A) demonstrates slightly increased signal intensity with restricted diffusion involving periventricular white matter and centrum semiovale (white arrows) as seen on DWI (B) and ADC (C) images.
Figure 2
Figure 2
A 60-year-old man with whole-brain radiation therapy for brain metastasis from lung cancer. Axial T2-FLAIR image demonstrates increased signal in the periventricular white matter (white arrow) with relative sparing of the subcortical U-fibers.
Figure 3
Figure 3
A 48-year-old woman with chronic renal failure and uremia presented with altered mental status. Coronal T2-FLAIR (A) MR image shows confluent increased T2-FLAIR signal (white arrow) with a corresponding diffusion restriction involving bilateral supratentorial white matter on DWI (B) and ADC map (C).
Figure 4
Figure 4
A 24-year-old man with phenylketonuria. Axial T2-FLAIR (A), DWI (B) images and ADC map (C) showing increased T2-FLAIR signal with a corresponding diffusion restriction in the periventricular parietal, and occipital white matter (white arrows).
Figure 5
Figure 5
A 40-year-old woman imaged 2 weeks following hypoxic-anoxic injury. Axial T2-FLAIR (A), DWI (B) and ADC map (C) show high T2-FLAIR signal in the periventricular white matter and centrum semiovale with associated diffusion restriction (white arrows).
Figure 6
Figure 6
A 35-year-old man with carbon monoxide poisoning. Axial T2-FLAIR image (A) on the day of poisoning shows increased T2-FLAIR signal in the globus pallidus (white arrow) along with a corresponding diffusion restriction (not shown). One month after carbon monoxide exposure, axial T2-FLAIR (B), DWI (C) and ADC map (D) show increased T2-FLAIR signal with diffusion restriction in the periventricular white matter and centrum semiovale (white arrows).
Figure 7
Figure 7
A 48-year-old woman with a history of heroin abuse. Axial T2-FLAIR images through the cerebellum (A) and temporal lobes (B) show increased signal involving the cerebellar and bilateral temporal white matter (white arrows).
Figure 8
Figure 8
A 52-year-old woman with a long-standing history of multiple sclerosis. Axial T2-FLAIR image shows areas of increased T2-FLAIR signal in the bilateral periventricular white matter (white arrows) oriented perpendicular to the ventricular surfaces.
Figure 9
Figure 9
A 31-year-old woman with SLE and hypertension presented with headache and change in vision progressing to a generalized seizure. Axial T2-FLAIR images (A–C) show symmetric T2-FLAIR hyperintensities involving the cortical and subcortical white matter of the parietal and occipital lobes, and to a lesser extent also the frontal lobes, temporal lobes, cerebellum and brainstem (white arrows), consistent with PRES.
Figure 10
Figure 10
A 40-year-old man with a history of AIDS. Axial T2-FLAIR image shows diffuse cerebral atrophy that is out of proportion to the patient’s age, and symmetrically increased T2 signal in the periventricular and deep white matter (white arrows) sparing the subcortical U-fibers.
Figure 11
Figure 11
A 45-year-old man with Progressive Multifocal Leukoencephalopathy (PML). Axial T2-FLAIR image shows a large area of increased T2 signal involving the periventricular and subcortical white matter including the subcortical U-fibers (white arrows).
Figure 12
Figure 12
A 14-year-old boy with X-linked adrenoleukodystrophy. Axial T2-FLAIR image shows increased T2 signal in the peritrigonal regions extending across the splenium of the corpus callosum (white arrow) as well as the involvement of the frontal lobe white matter bilaterally (black asterisks).
Figure 13
Figure 13
A 70-year-old man with amyloid angiopathy. Axial T2W (A), T2-FLAIR (B), contrast-enhanced T1W (C), DWI mages (D) and ADC map (E) show confluent zones of increased T2 signal (white arrow) without restricted diffusion, with the presence of multiple punctate hypointense foci on SWI (F), characteristic of cerebral amyloid angiopathy (white arrow).
Figure 14
Figure 14
A 40-year-old woman with CADASIL. Axial T2-FLAIR images show focal and confluent areas of high T2-FLAIR signal affecting the subcortical white matter and centrum semiovale with particular predilection for the frontal (A), parietal and anterior temporal regions (B).
Figure 15
Figure 15
A 50-year-old man with Gliomatosis cerebri. Axial T2W (A), post-gadolinium T1W (B), DWI (C) and ADC map (D) and mages show increased T2-FLAIR signal affecting the cerebral white matter with mass effect, mild contrast enhancement and mildly restricted diffusion (white arrows).
Figure 16
Figure 16
A 12-year-old boy 2 weeks following status epilepticus. Axial T2W (A), DWI (B) and ADC map (C) images show increased signal in the centrum semiovale bilaterally with restricted diffusion (white arrows).

References

    1. Vázquez E, Delgado I, Sánchez-Montañez A, et al. Side effects of oncologic therapies in the pediatric central nervous system: Update on neuroimaging findings. Radiographics. 2011;31:1123–39. - PubMed
    1. Valk PE, Dillon WPL. Radiation injury of the brain. Am J Neuroradiol. 1991;12(1):45–62. - PMC - PubMed
    1. Kang E, Jeon SJ, Choi S. Uremic encephalopathy with atypical magnetic resonance features on diffusion-weighted images. Korean J Radiol. 2012;13(6):808–11. - PMC - PubMed
    1. Moritani T, Smoker WRK, Sato Y, et al. Diffusion-weighted imaging of acute excitotoxic brain injury. Am J Neuroradiol. 2005;26(2):216–28. - PMC - PubMed
    1. Molloy S, Soh C, Williams TL. Reversible delayed posthypoxic leukoencephalopathy. Am J Neuroradiol. 2005;27(8):1763–65. - PMC - PubMed

LinkOut - more resources