. 2017 Dec;222(9):4219-4237.
doi: 10.1007/s00429-017-1457-4. Epub 2017 Jun 27.

Increased gyrification and aberrant adult neurogenesis of the dentate gyrus in adult rats

Affiliations

Increased gyrification and aberrant adult neurogenesis of the dentate gyrus in adult rats

Alejandra Magagna-Poveda et al. Brain Struct Funct. 2017 Dec.

Abstract

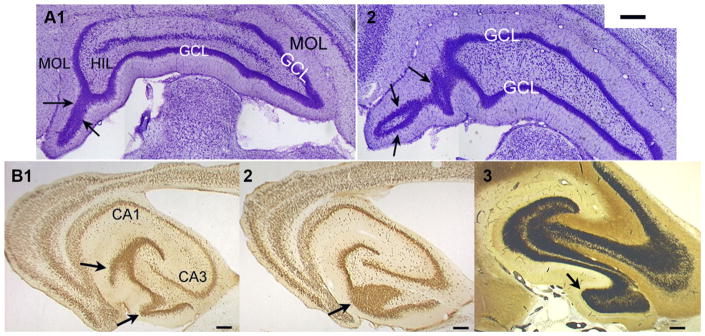
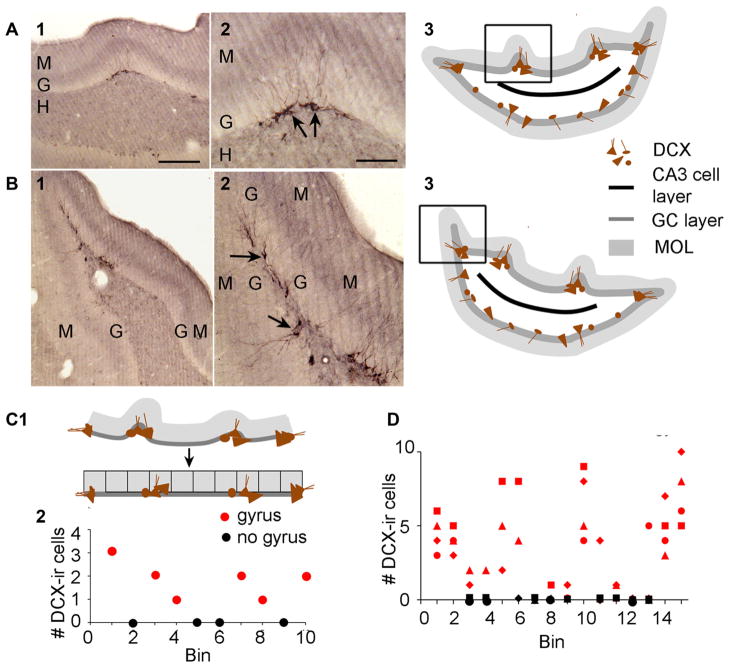
A remarkable example of maladaptive plasticity is the development of epilepsy after a brain insult or injury to a normal animal or human. A structure that is considered central to the development of this type of epilepsy is the dentate gyrus (DG), because it is normally a relatively inhibited structure and its quiescence is thought to reduce hippocampal seizure activity. This characteristic of the DG is also considered to be important for normal hippocampal-dependent cognitive functions. It has been suggested that the brain insults which cause epilepsy do so because they cause the DG to be more easily activated. One type of brain insult that is commonly used is induction of severe seizures (status epilepticus; SE) by systemic injection of a convulsant drug. Here we describe an alteration in the DG after this type of experimental SE that may contribute to chronic seizures that has not been described before: large folds or gyri that develop in the DG by 1 month after SE. Large gyri appeared to increase network excitability because epileptiform discharges recorded in hippocampal slices after SE were longer in duration when recorded inside gyri relative to locations outside gyri. Large gyri may also increase excitability because immature adult-born neurons accumulated at the base of gyri with time after SE, and previous studies have suggested that abnormalities in adult-born DG neurons promote seizures after SE. In summary, large gyri after SE are a common finding in adult rats, show increased excitability, and are associated with the development of an abnormal spatial distribution of adult-born neurons. Together these alterations may contribute to chronic seizures and associated cognitive comorbidities after SE.

Keywords: Adult neurogenesis; Epilepsy; Granule cell; Neuropathology; Pilocarpine.


Figures

Fig. 1
Fig. 1
Increased gyrification in the DG after pilocarpine-induced SE. a Nissl-stained coronal sections from one hemisphere of a control rat treated with saline. The most anterior sections are on the top and the most posterior are at the bottom. b Coronal sections in similar locations from a rat that had pilocarpine-induced SE and was perfused 2.5 months later. Arrows point to large gyri in the DG. Calibration in a and b, 250 μm
Fig. 2
Fig. 2
a Invaginations in the GC layer at the poles of the DG after SE. a1 A Nissl-stained coronal section from a pilocarpine-treated rat that had SE shows invaginations at the dorsal tip (also called the pole) of a section from the posterior DG (arrows). 2 A section from another rat at a more posterior location. In this animal, there was a complex invagination and extension of the GC layer in the dorsal pole. Dorsal is to the left and medial is down. MOL molecular layer. HIL hilus. GCL granule cell layer. Calibration, 200 μm. b Gyri after SE in horizontal sections 1, 2. Two sections from a pilocarpine-treated rat after SE that were cut in the horizontal plane. b1 is more ventral than b2. These sections were stained with an antibody to the neuronal antigen NeuN. Arrows point to areas of the GC layer corresponding to gyri cut at a tangent (1) or along the midline of the gyrus (2). 3 A Timm-stained section from another pilocarpine-treated rat that had SE shows large areas of mossy fiber sprouting in the area corresponding to the gyrus (arrow). Calibration in b1–3, 100 μm
Fig. 3
Fig. 3
Timm stained sections from an animal that had pilocarpine-induced SE show large gyri maintain their lamination. At low power (a) and at higher power (b–d), lamination appears to be normal, i.e., the GC layer and subdivisions of the molecular layer are not distorted in the gyri. IML inner molecular layer, MML middle molecular layer, OML outer molecular layer. Note that b, c are areas of a (indicated by the black bar) that are shown at higher gain. d is an area of c, indicated by the black bar, which is shown at higher power. Calibration, a 250 μm; b, c 100 μm; d 50 μm
Fig. 4
Fig. 4
Quantification of gyri in control and experimental rats. a A schematic illustrates terminology and shows the quantification of gyrus depth. The depth was defined as the distance between the peak and mouth of a gyrus, with the peak defined by the GC layer/hilar border at the apex of the gyrus, and the mouth defined as the area around the base of a gyrus. b1 Mean gyrus length and the largest gyrus length are compared for saline-treated rats with gyri and pilocarpine-treated rats >1 month after SE. Sample sizes are at the base of the bar. A two-way ANOVA showed a significant effect of treatment (F(1, 66) 18.43, p < 0.0001) but not an effect of the test (F(1, 66) 0.65, p = 0.421) and there was no interaction. Bonferroni’s post hoc test showed a significantly greater length in pilocarpine-treated rats (both mean and largest length, p < 0.05). 2 The number of gyri/hippocampus are shown for control and pilocarpine-treated rats that were >1 month after SE. Sample sizes are at the base of the bars. All controls were included. A Mann–Whitney U test showed that there were significantly more gyri in pilocarpine-treated rats (p < 0.0001). c1 KA-treated rats are compared to pilocarpine-treated rats. All animals had gyri. A two-way ANOVA showed no effect of treatment (F(1, 114) 0.24; p = 0.621). 2 Male and female kainic acid-treated rats are compared. All animals were >1 month after SE and had gyri. A two-way ANOVA showed an effect of sex (F(1, 27) 8.95, p = 0.0059) and the type of test (mean gyrus length, largest gyrus length or number of gyri; F(2, 27) 206.60, p < 0.0001) with an interaction (F(2, 27) 3.85, p = 0.034) because the one measurement that was significantly different between males and females was the largest gyrus length; it was significantly larger in females (Bonferroni’s test, p < 0.05)
Fig. 5
Fig. 5
Timecourse of increased gyrification after SE. Comparison of mean gyrus length (a), the largest gyrus (b) and the number of gyri (c) at different times after pilocarpine-induced SE showed significant differences between the earliest two time points (1–3 and 7–8 days after SE) and >1 month after SE. One-way ANOVA results for a F(3, 40) 3.68, p = 0.019; for b F(3, 40) 5.93, p = 0.002; for c F(3, 40) 5.65, p = 002). Asterisks indicate significance by Tukey–Kramer post hoc test. Sample sizes are at the base of the bars. There was no significant correlation between the age after SE and mean gyrus length (d, p = 0.320) or the largest gyrus length (e, p = 0.315) and the age after SE. Only animals aged >1 month after SE are shown
Fig. 6
Fig. 6
Greater duration of evoked burst discharges inside gyri relative to outside gyri. a1 A schematic illustrates the stimulation site in the outer molecular layer between a gyrus and an area that did not have gyri. There were two recording sites, one inside the peak of the gyrus (1) and the other outside the gyrus (2), which were similar in distance from the stimulating electrode. Recordings were made in the presence of 10 μM bicuculline. 2 The response to a stimulus elicited an epileptiform burst discharge at both recording sites 1 and 2. Arrows mark a similar time after the start of the burst when the burst had ended at site 1 but had not at site 2. 3 A diagram of the measurements of burst amplitude and duration. b Burst amplitude (1) and burst duration (2) are compared for five slices from five different rats. Two-way ANOVA with location (in or outside the gyrus) and type of measurement (amplitude or duration) as factors showed a significant effect of location (F(1, 16) 21.55, p = 0.0003) and type of measurement (F(1, 16) 282.30, p < 0.0001). There also was an interaction of factors (F(1, 16) 22.75, p = 0.0002) because there was a significantly longer burst duration inside gyri relative to outside gyri (post hoc test, p < 0.05). Burst amplitude was not significantly different between sites in and outside gyri (p >0.05)
Fig. 7
Fig. 7
GC layer length increases after SE. a One of the control Nissl-stained sections in Fig. 1 is shown with an arrow pointing to the tracing of the GC layer used to measure its length. b A section from the pilocarpine-treated rat in Fig. 1 is shown with an arrow pointing to the GC layer tracing. c A comparison of GC layer length in control and pilocarpine-treated rats shows that there was a significant increase in the length of the GC layer after pilocarpine-induced SE (Student’s t test, p < 0.0001)
Fig. 8
Fig. 8
Gyri in animals after SE contain high numbers of immature GCs. a1, a2 A section from a rat after SE is shown at low power in a1 and higher power in a2. Arrows mark DCX-ir cells in the area of a small gyrus. Calibration, 200 μm (1) or 100 μm (2). 3 Drawing of the orientation of the section in a1, 2 with a box around the areas shown in the micrographs. b1, 2 A section from a different rat than A at one of the DG poles shows DCX-ir is high near the pole. Arrows point to examples of DCX-ir cells. Calibration for b1 is shown in a1. Calibration for b2 is shown in a2. 3 Drawing of the orientation of the section in b1, 2 with a box showing the location of the micrographs. c1 A schematic depicts the preferential location of DCX-ir cells in gyri of the inferior blade of the DG in a section located relatively far from the anterior pole. The methods used to graph DCX-ir cells in d are shown. The inferior blade was stretched out to form a single line. Then it was binned into 300 μm segments. DCX-ir cells in each bin were quantified. 2 A graph of the DCX-ir cell numbers per bin shows that when DCX-ir cells were present, they either were near the poles of the DG or the bin corresponded to the location of a gyrus (denoted by red symbols). When there was no detectable DCX-ir, there was no gyrus (black symbols). d Quantification of DCX-ir cells in bins of the inferior blade in four sections (four rats) show areas of high DCX labeling are where gyri were present. At the start and end of the graph, where the DG poles are located, DCX labeling is also high. When cells are located near a gyrus the symbol is red and when there was no gyrus the symbol is black
Fig. 9
Fig. 9
DCX-ir in the DG is altered by time after SE. a A schematic illustrates the groups that were compared, 3–5 months (b) or 7–11 months after SE (c). Immuno = Immunohistochemistry. b1, 2 DCX-ir 4 months after SE. The area in 1 that is outlined by the box is shown at higher gain in 2. There is DCX staining in (arrows in 2) and beside (arrowheads in 2) a small gyrus. 3 A graph shows that animals that were examined 3–5 months after SE (n = 3) had DCX-ir cells in (red) and outside (black) gyri. Data from different rats are denoted by a different symbol. c1, 2 In a rat that was examined 10 months after SE, DCX-ir was only detected in gyri (arrows in 2). 3 A graph of four animals that were examined 7–11 months after SE shows DCX-ir in gyri more selectively than at the earlier ages graphed in b
Fig. 10
Fig. 10
BrdU labeling shows decreased adult neurogenesis 6 months after SE. a1 A timeline shows animals were injected with BrdU 6 months after SE (50 mg/kg, i.p., 2 times per day for six consecutive days, n = 5) and examined 1 month later. 2 A timeline shows other animals were injected early after SE (5–11 days after SE; n = 5) and examined 1 month later. b1 A micrograph of a representative section of the DG for a rat that was injected as shown in a1. BrdU-labeled nuclei (black arrow) were rare. NeuN immunoreactivity is orange/brown. Calibration, 10 μm. 2 An example of robust BrdU labeling and double labeling (arrows) in a rat that was injected with BrdU as shown in a2. This image was created by merging three focal planes. c BrdU-labeled cells in the inferior blade of the posterior sections of the DG were quantified for five animals per group, either injected at young (blue) or old (green) ages. The older animals were injected as shown in a1 and the younger group was injected as shown in a2. The total number of double-labeled cells and cells with only BrdU labeling are compared. The total number of BrdU/NeuN-labeled cells was greater in the younger group than the older group (Student’s t test, p < 0.0001; asterisk) but the total number of BrdU-positive cells that lacked NeuN labeling was low in both the younger and older group (p > 0.05). These data suggest a higher proliferation rate and more neurogenesis at young ages. Sample sizes are at the base of the bars. d The percent of cells that were double-labeled is shown for young and old rats. The percentage was defined as the number of double-labeled cells divided by all BrdU-labeled cells. The data in c, d were analyzed by two-way ANOVA with the age as a main factor and the type of comparison a main factor. There was a significant effect of age (F(1, 30) 86.85, p < 0.0001). There also was a significant effect of the type of comparison (F(2, 30) 81.26, p < 0.0001) and an interaction of factors (F(2, 30) 38.78, p < 0.0001). Bonferroni’s post hoc tests showed that there were significantly more double-labeled cells in younger animals than older animals (p < 0.05) in c, d but there was no difference between the numbers of cells that were labeled with BrdU only. The results suggest that the percentage of cells which became neurons was higher in the younger group

Similar articles

Cited by

References

    1. Alvarez-Buylla A, Herrera DG, Wichterle H. The subventricular zone: source of neuronal precursors for brain repair. Prog Brain Res. 2000;127:1–11. - PubMed
    1. Ang CW, Carlson GC, Coulter DA. Massive and specific dysregulation of direct cortical input to the hippocampus in temporal lobe epilepsy. J Neurosci. 2006;26:11850–11856. - PMC - PubMed
    1. Armstrong E, Schleicher A, Omran H, Curtis M, Zilles K. The ontogeny of human gyrification. Cereb Cortex. 1995;5:56–63. - PubMed
    1. Ben-Ari Y, Lagowska J, Tremblay E, Le Gal La Salle G. A new model of focal status epilepticus: intra-amygdaloid application of kainic acid elicits repetitive secondarily generalized convulsive seizures. Brain Res. 1979;163:176–179. - PubMed
    1. Binder DK, Hubbard JA. Astrocytes and epilepsy. Academic Press; New York: 2016.

MeSH terms

LinkOut - more resources