

Whole-body MRI quantitative biomarkers are associated significantly with treatment response in patients with newly diagnosed symptomatic multiple myeloma following bortezomib induction
- PMID: 28656463
- PMCID: PMC5674123
- DOI: 10.1007/s00330-017-4907-8
Whole-body MRI quantitative biomarkers are associated significantly with treatment response in patients with newly diagnosed symptomatic multiple myeloma following bortezomib induction
Abstract
Objectives: To evaluate whole-body MRI (WB-MRI) parameters significantly associated with treatment response in multiple myeloma (MM).
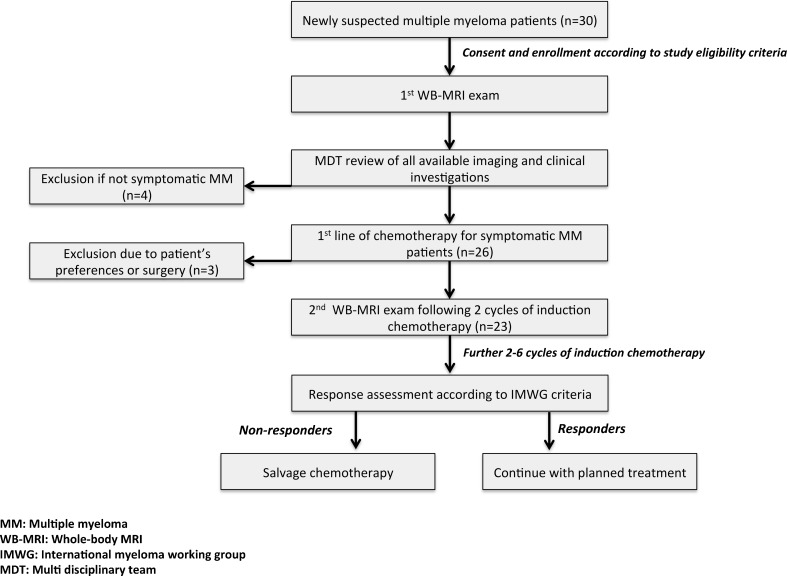
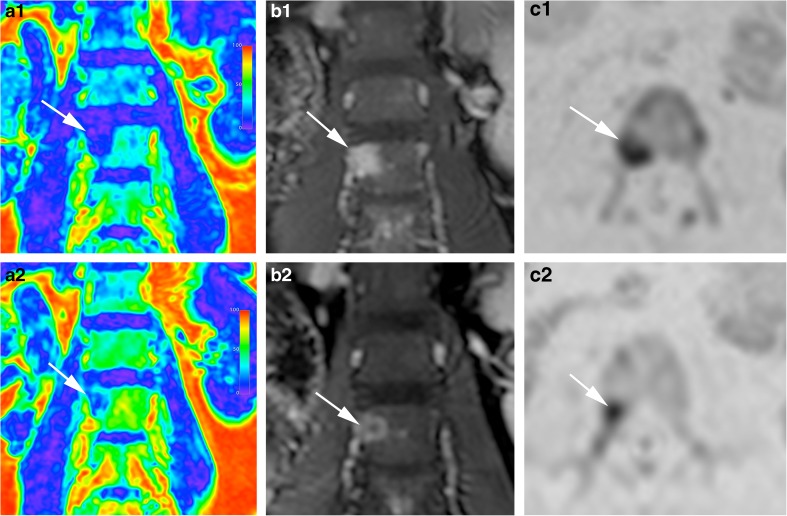
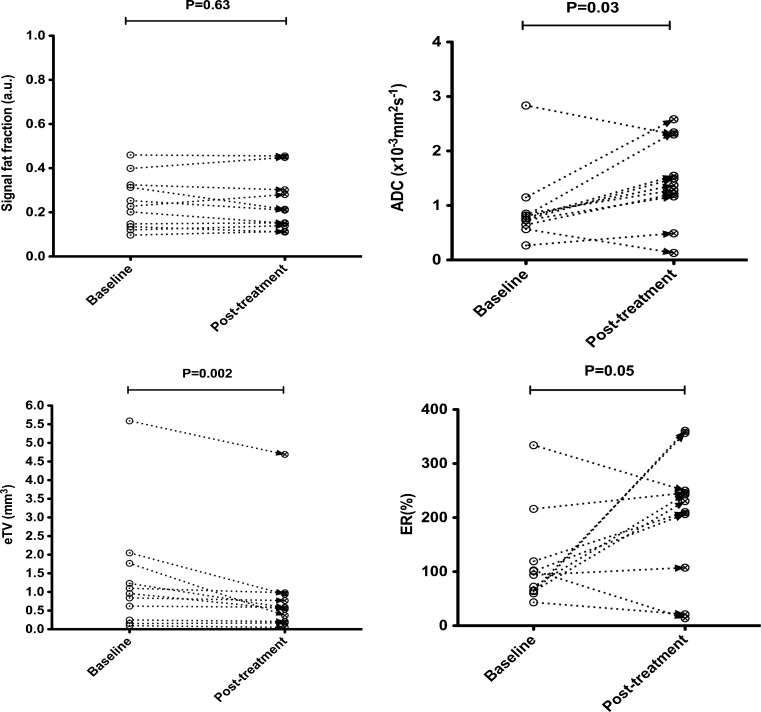
Methods: Twenty-one MM patients underwent WB-MRI at diagnosis and after two cycles of chemotherapy. Scans acquired at 3.0 T included T2, diffusion-weighted-imaging (DWI) and mDixon pre- and post-contrast. Twenty focal lesions (FLs) matched on DWI and post-contrast mDixon were selected for each time point. Estimated tumour volume (eTV), apparent diffusion coefficient (ADC), enhancement ratio (ER) and signal fat fraction (sFF) were derived. Clinical treatment response to chemotherapy was assessed using conventional criteria. Significance of temporal parameter change was assessed by the paired t test and receiver operating characteristics/area under the curve (AUC) analysis was performed. Parameter repeatability was assessed by interclass correlation (ICC) and Bland-Altman analysis of 10 healthy volunteers scanned at two time points.
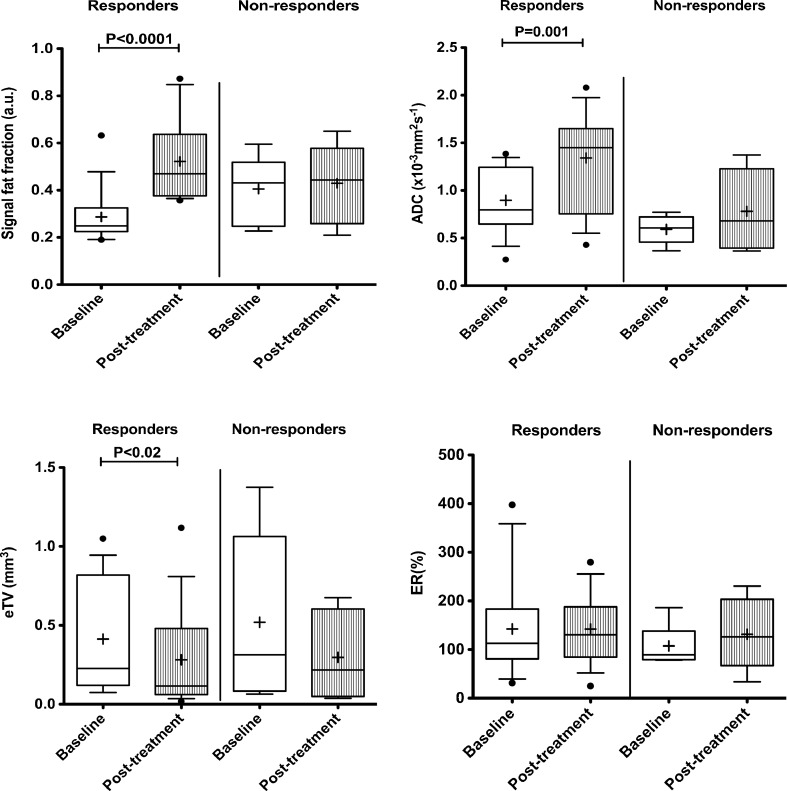
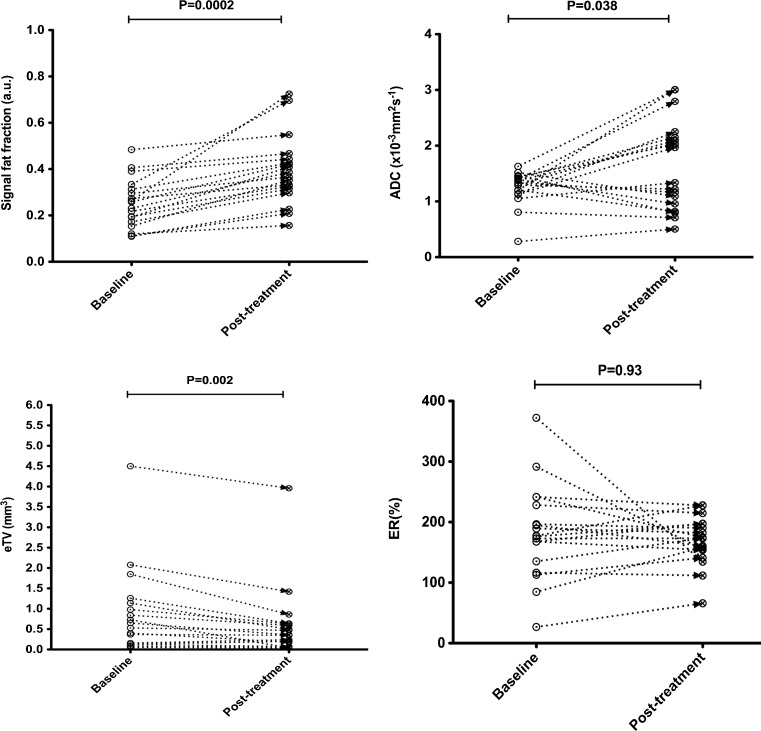
Results: Fifteen of 21 patients responded to treatment. Of 254 FLs analysed, sFF (p < 0.0001) and ADC (p = 0.001) significantly increased in responders but not non-responders. eTV significantly decreased in 19/21 cases. Focal lesion sFF was the best discriminator of treatment response (AUC 1.0). Bone sFF repeatability was excellent (ICC 0.98) and better than bone ADC (ICC 0.47).
Conclusion: WB-MRI derived focal lesion sFF shows promise as an imaging biomarker of treatment response in newly diagnosed MM.
Key points: • Bone signal fat fraction using mDixon is a robust quantifiable parameter • Fat fraction and ADC significantly increase in myeloma lesions responding to treatment • Bone lesion fat fraction is the best discriminator of myeloma treatment response.
Keywords: Bortezomib; MRI; Multiple myeloma; Response monitoring; Whole body.
Conflict of interest statement
Guarantor
The scientific guarantor of this publication is Dr Shonit Punwani.
Conflict of interest
The authors of this manuscript declare no relationships with any companies whose products or services may be related to the subject matter of the article.
Funding
This study has received funding by:
AL was supported by a Cancer Research UK/ Engineering and Physical Sciences Research Council (CRUK/EPSRC) award (C1519/A10331 and C1519/A16463) from the University College London/King’s College London (UCL/KCL) Comprehensive Cancer Imaging Centre (CCIC).
ND was supported by UK Engineering and Physical Sciences Research Council (EPSRC) grants EP/I018700/1 and EP/H046410/1.
Support was provided to KY by the National Institute for Health Research (NIHR), the University College London Hospitals (UCLH) Biomedical Research Centre (BRC) and the Cancer Research UK (CRUK) University College London Experimental Cancer Medicine Centre.
Statistics and biometry
Professor Allan Hackshaw (Cancer Research UK and UCL Cancer Trial Centre Cancer Institute, University College London) has kindly provided statistical advice for this manuscript
Informed consent
Written informed consent was obtained from all subjects (patients) in this study.
Ethical approval
Institutional review board approval was obtained.
Methodology
• prospective
• observational
• performed at one institution
Figures

References
Publication types
MeSH terms
Substances
Grants and funding
LinkOut - more resources
Full Text Sources
Other Literature Sources
Medical
