. 2017 Aug 15;56(32):4219-4234.
doi: 10.1021/acs.biochem.7b00300. Epub 2017 Aug 4.

Adenosine Monophosphate Binding Stabilizes the KTN Domain of the Shewanella denitrificans Kef Potassium Efflux System

Affiliations

Adenosine Monophosphate Binding Stabilizes the KTN Domain of the Shewanella denitrificans Kef Potassium Efflux System

Christos Pliotas et al. Biochemistry. .

Abstract

Ligand binding is one of the most fundamental properties of proteins. Ligand functions fall into three basic types: substrates, regulatory molecules, and cofactors essential to protein stability, reactivity, or enzyme-substrate complex formation. The regulation of potassium ion movement in bacteria is predominantly under the control of regulatory ligands that gate the relevant channels and transporters, which possess subunits or domains that contain Rossmann folds (RFs). Here we demonstrate that adenosine monophosphate (AMP) is bound to both RFs of the dimeric bacterial Kef potassium efflux system (Kef), where it plays a structural role. We conclude that AMP binds with high affinity, ensuring that the site is fully occupied at all times in the cell. Loss of the ability to bind AMP, we demonstrate, causes protein, and likely dimer, instability and consequent loss of function. Kef system function is regulated via the reversible binding of comparatively low-affinity glutathione-based ligands at the interface between the dimer subunits. We propose this interfacial binding site is itself stabilized, at least in part, by AMP binding.


Conflict of interest statement

The authors declare no competing financial interest.

Figures

Figure 1
Figure 1
Summary of the HPLC program.
Figure 2
Figure 2
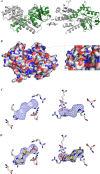
(A) X-ray crystal structure that shows SdKefQCTD as dimeric, with each nucleotide-binding pocket occupied by an AMP molecule (PDB entry 5NC8). (B) View of the Kef protein looking from the membrane, in a surface view. AMP occupies both nucleotide-binding pockets and is depicted as sticks (yellow carbons). (C) Two views of the FoFc electron density map contoured at 3.0σ. The phases were calculated from a model that had not included AMP. (D) The same FoFc map now with the final position of the AMP molecule shown as sticks.
Figure 3
Figure 3
Two AMP-binding pockets of SdKefQCTD from S. denitrificans (PDB entry 5NC8, AMP carbons colored yellow). The key residues involved in AMP binding are highlighted as lines, with the residues from chain a shown with white carbons and the residues from chain b shown with green carbons. The gray dotted line indicates the dimer interface.
Figure 4
Figure 4
Comparison of the AMP-binding pocket of SdKefQCTD (A, PDB entry 5NC8, AMP carbons colored yellow) and the AMP-binding pocket of the C-terminal domain of EcKefQCTD from E. coli (B, PDB entry 3L9W, AMP carbons colored orange). The key residues involved in AMP binding are highlighted as lines and are conserved between the two proteins. The equivalent residue of H434 was not well resolved in the SdKefQCTD X-ray crystal structure.
Figure 5
Figure 5
CPMG-edited 1H NMR spectra (700 MHz, 278 K) of the native (top) and denatured (middle) SdKefQCTD protein with the reference AMP spectrum (bottom). The red stars denote resonances corresponding to AMP that appear in the SdKefQCTD protein spectrum after denaturation, consistent with the release of AMP from SdKefQCTD following denaturation.
Figure 6
Figure 6
Determination of the stoichiometry of binding of AMP to SdKefQCTD through native mass spectrometry. (A) Mass spectra of SdKefQCTD reveal the sequential removal of two AMP molecules with an increasing level of collisional activation. (B) Proportion of bound SdKefQCTD, as a function of collision voltage, averaged across all charge states.
Figure 7
Figure 7
(A) DSF experiments to determine the effect of nucleotides on the stabilization of SdKefQCTD. It is shown that AMP is most effective at stabilizing SdKefQCTD with a ΔTm of +15 °C. (B) DSF experiments to determine the effect of both AMP and ESG on the stabilization of SdKefQCTD. Little stabilization is provided by GSH, whereas ESG shows a ΔTm of +7 °C. The stabilization in the presence of both AMP and ESG is +18 °C, which is consistent with separate binding sites for these two ligands.
Figure 8
Figure 8
AMP-binding residues that have been investigated by mutagenesis studies are highlighted with purple carbons. AMP is shown as a stick representation (yellow carbons). Image generated using PyMOL and the X-ray crystal structure of SdKefQCTD (PDB entry 5NC8).
Figure 9
Figure 9
Western blot of the (A) full-length SdKef and (B) truncated SdKefQCTD mutants. The wild type (WT) and the mutants in each plasmid were expressed in MJF373 cells and overproduced by induction with 0.3 mM IPTG. (A) Membrane fractions or (B) soluble fractions were isolated; 15 μg of protein per well was separated via SDS–PAGE and transferred to a nitrocellulose membrane, and an antibody against the C-terminal His6 tag was used for detection of the proteins. MJF373 alone was used as a control (Δkef).
Figure 10
Figure 10
AMP percentage of retention calculated by comparing the absorption at 280 nm (A280) of the denatured proteins and AMP standards that were run the same day, at equal concentrations, at equal sample volumes, and in identical buffers. A representative example is shown. Mutants D436A and D436E were studied; 100 μL of a 200 μM sample was treated as described in Materials and Methods, and all resulting single peaks appearing in the gel filtration profiles were subjected to further mass spectrometry analysis for nucleotide identification (Figure S5D–F).
Figure 11
Figure 11
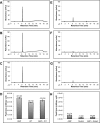
HPLC analysis of AMP released from heat-denatured SdKefQCTD and SdKefQCTD(R416E). All experiments were conducted under the same HPLC conditions (see Materials and Methods for details). (A) HPLC profile of 50 μM pure adenosine monophosphate (AMP). (B) HPLC profile of 50 μM denatured wild-type protein (WT) – SdKefQCTD. (C) Spiking experiment containing equal concentrations (25 μM each) of pure AMP and denatured WT (i.e., AMP + WT). (D) Quantification of HPLC peak areas of panels A–C. Data shown are mean ± standard deviation (SD) values from three different experiments (n = 3). (E) HPLC profile of 8.6 μM pure AMP. (F) HPLC profile of 8.6 μM denatured mutant protein (Mutant) – SdKefQCTD(R416E). (G) Spiking experiment containing equal concentrations (4.3 μM each) of pure AMP and the denatured mutant (i.e., AMP + Mutant). (H) Quantification of HPLC peak areas of panels E–G. Data shown are mean ± SD values from three different experiments (n = 3).
Figure 12
Figure 12
(A) Per-residue root-mean-square fluctuations (RMSF) of the Cα atoms of a homology model of SdKefQCTD in the presence of either GSH and AMP (blue) or only GSH (red). (B) Per-residue RMSF of the Cα atoms of a homology model of SdKefQCTD in the presence of either ESG and AMP (green) or only GSH (yellow). (C) Temporal root-mean-square deviation (relative to the starting structure) for Cα atoms during a 40 ns MD simulation for SdKefQCTD in complex with GSH (red), GSH and AMP (blue), ESG (purple), or ESG and AMP (green).

References

    1. Jiang Y.; Pico A.; Cadene M.; Chait B. T.; MacKinnon R. (2001) Structure of the RCK Domain from the E. coli K+ Channel and Demonstration of Its Presence in the Human BK Channel. Neuron 29, 593–601. 10.1016/S0896-6273(01)00236-7. - DOI - PubMed
    1. Follmann M.; Becker M.; Ochrombel I.; Ott V.; Krämer R.; Marin K. (2009) Potassium transport in corynebacterium glutamicum is facilitated by the putative channel protein CglK, which is essential for pH homeostasis and growth at acidic pH. J. Bacteriol. 191, 2944–2952. 10.1128/JB.00074-09. - DOI - PMC - PubMed
    1. Adams M. J.; Ford G. C.; Koekoek R.; Lentz P. J.; McPherson A.; Rossmann M. G.; Smiley I. E.; Schevitz R. W.; Wonacott A. J. (1970) Structure of Lactate Dehydrogenase at 2.8 Ǻ Resolution. Nature 227, 1098–1103. 10.1038/2271098a0. - DOI - PubMed
    1. Loi V. V.; Rossius M.; Antelmann H. (2015) Redox regulation by reversible protein S-thiolation in bacteria. Front. Microbiol. 6, 187.10.3389/fmicb.2015.00187. - DOI - PMC - PubMed
    1. Newton G. L.; Rawat M.; La Clair J. J.; Jothivasan V. K.; Budiarto T.; Hamilton C. J.; Claiborne A.; Helmann J. D.; Fahey R. C. (2009) Bacillithiol is an antioxidant thiol produced in Bacilli. Nat. Chem. Biol. 5, 625–627. 10.1038/nchembio.189. - DOI - PMC - PubMed

Publication types

MeSH terms

Substances