. 2017 Jun 28:8:15974.
doi: 10.1038/ncomms15974.

Light controlled 3D micromotors powered by bacteria

Affiliations

Light controlled 3D micromotors powered by bacteria

Gaszton Vizsnyiczai et al. Nat Commun. .

Abstract

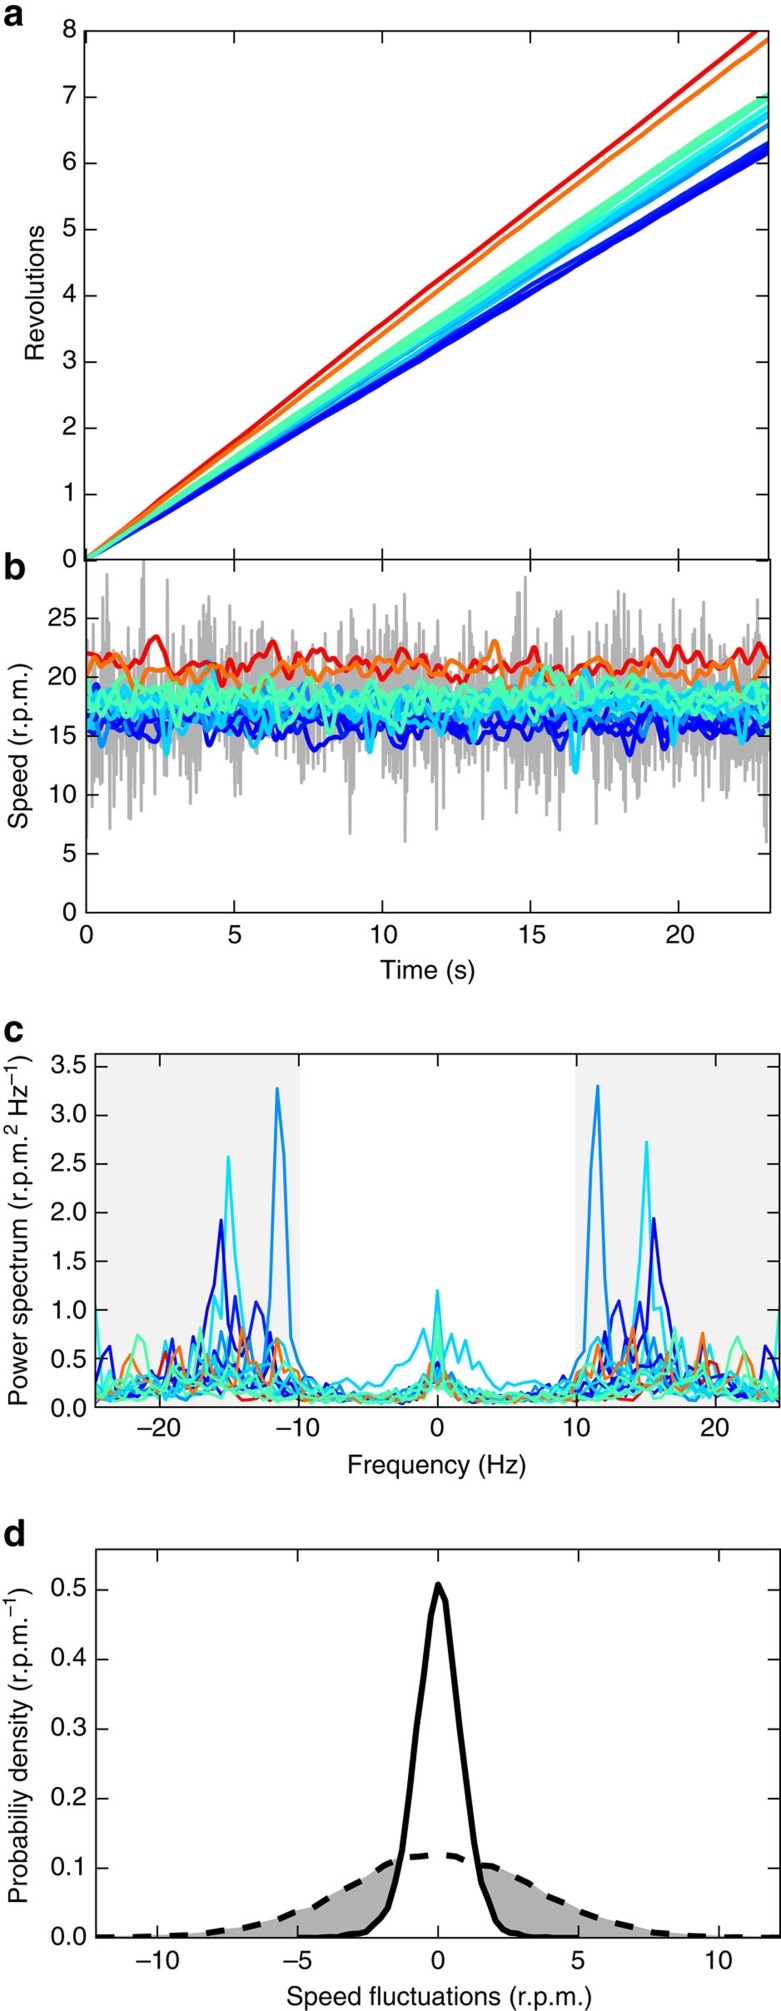
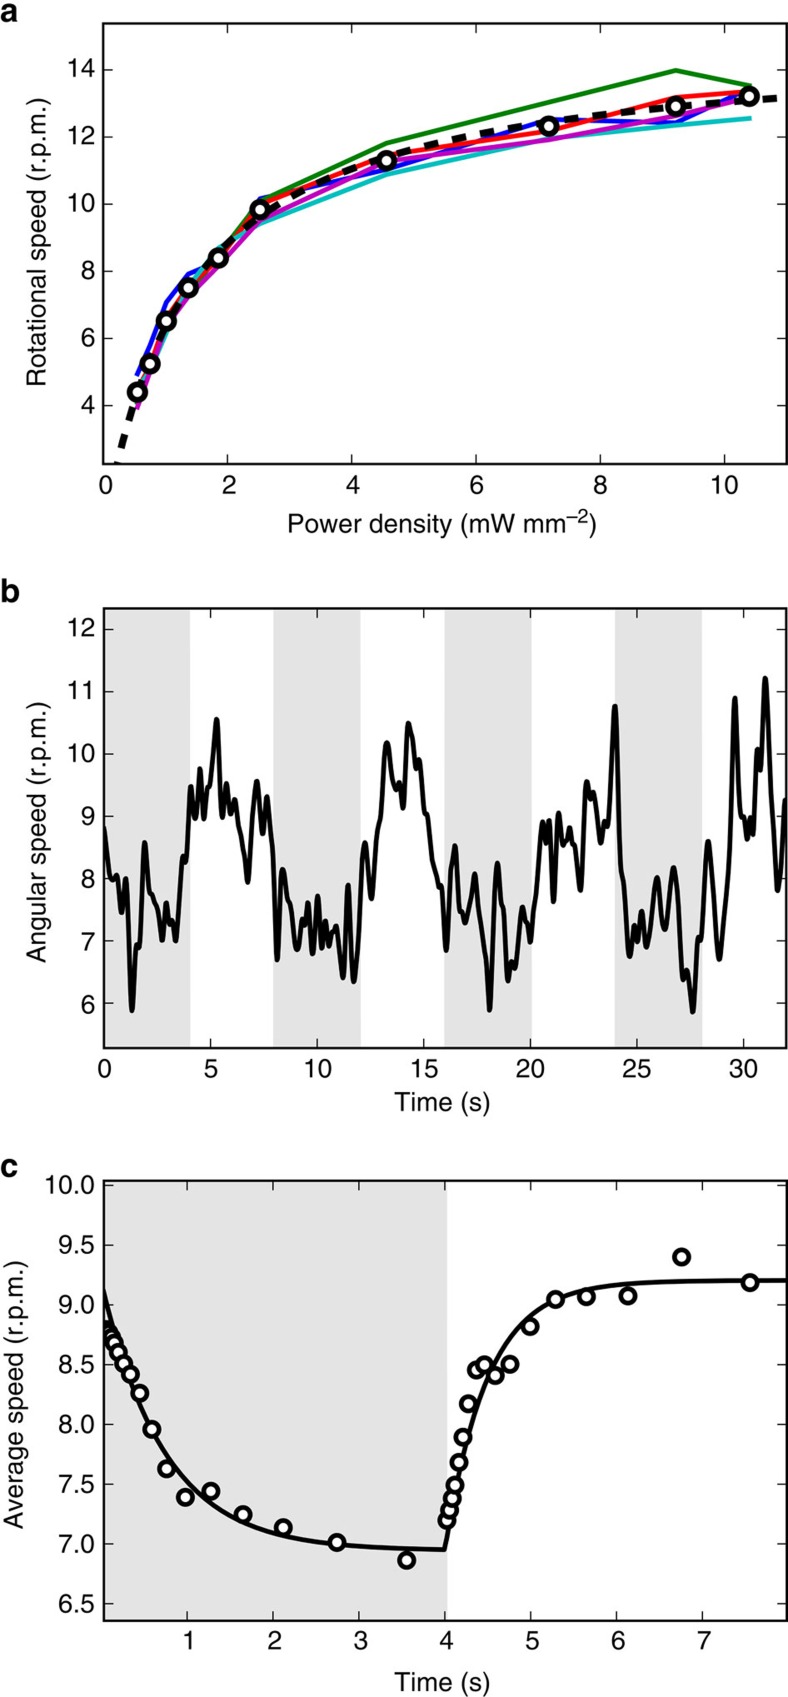
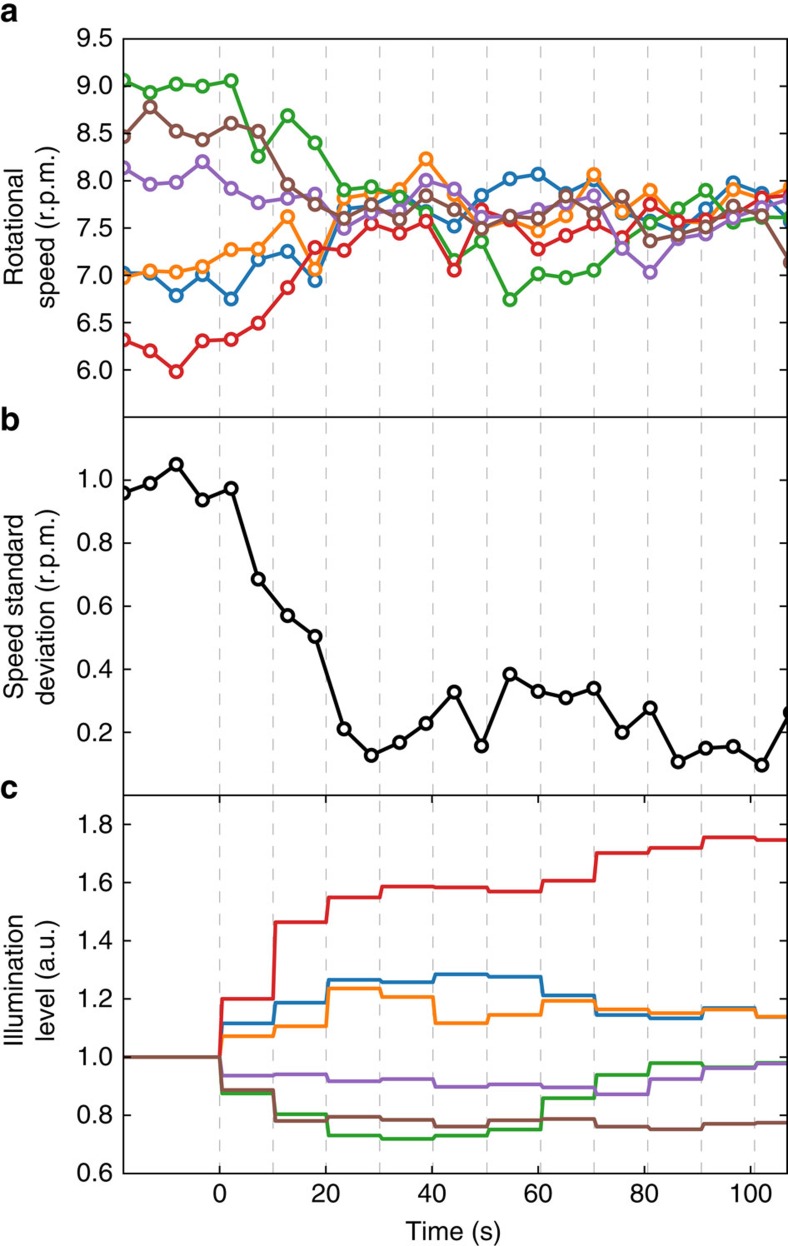
Self-propelled bacteria can be integrated into synthetic micromachines and act as biological propellers. So far, proposed designs suffer from low reproducibility, large noise levels or lack of tunability. Here we demonstrate that fast, reliable and tunable bio-hybrid micromotors can be obtained by the self-assembly of synthetic structures with genetically engineered biological propellers. The synthetic components consist of 3D interconnected structures having a rotating unit that can capture individual bacteria into an array of microchambers so that cells contribute maximally to the applied torque. Bacterial cells are smooth swimmers expressing a light-driven proton pump that allows to optically control their swimming speed. Using a spatial light modulator, we can address individual motors with tunable light intensities allowing the dynamic control of their rotational speeds. Applying a real-time feedback control loop, we can also command a set of micromotors to rotate in unison with a prescribed angular speed.


Conflict of interest statement

The authors declare no competing financial interests.

Figures

Figure 1
Figure 1. Design of 3D micromotors.
(a,b) 3D model of the micromotor structure. Colours highlight distinct component parts: ramp (red), axis (blue) and rotor (green). The dashed white line schematically depicts the trajectory of a cell guided by the ramp structure into a rotor microchamber. (c,d) Scanning electron microscope images of the 3D micromotors. (c) shows a bird’s eye view on a set of four micromotors. (d) shows a close view of microchambers.
Figure 2
Figure 2. Micromotors in a bacterial suspension.
(a) Bright-field microscopy image of 36 rotating micromotors (Supplementary Movie 3). The scale bar is 20 μm. (b,c) Array of 16 rotors used to characterize the rotational dynamics (Fig. 4). Cell bodies are clearly visible in fluorescence (c) showing the high occupancy fraction of microchambers. The scale bar is 20 μm for both (b,c). (d,e) Zoomed view on one of the rotors in b,c. Cell bodies are fitted with an ellipsoidal shape shown as a dashed line in e. Solid lines illustrate the construction used to measure the lever arm formula image
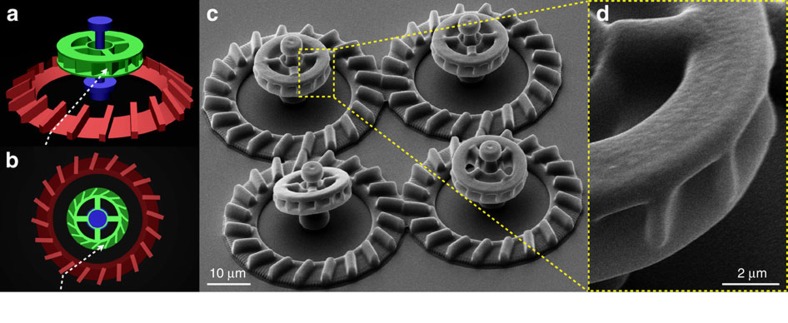
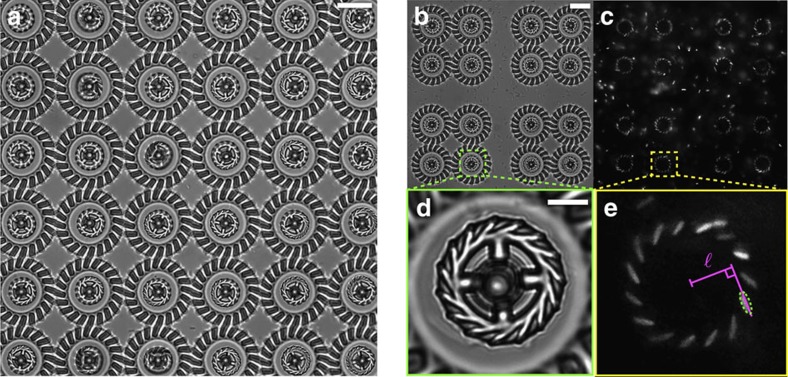
. The scale bar is 5 μm for both d,e.
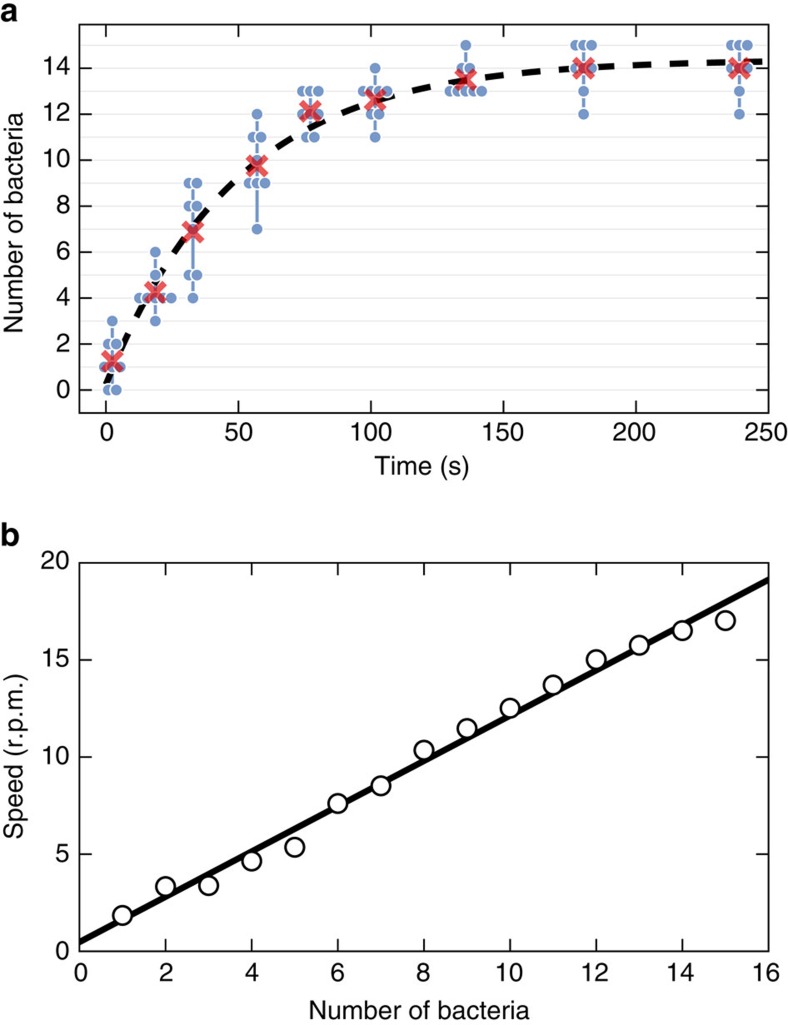
Figure 3
Figure 3. Self-assembly dynamics.
(a) The number of captured bacteria as a function of time is plotted as blue disks for 8 micromotors. Groups of blue dots connected by vertical lines refer to the same time instant. The average over the 8 micromotor group is plotted with red crosses and fitted to the exponential law shown as dashed line (τ=49 s). (b) Rotational speed as a function of the number of captured bacteria (open circles). Linear fit (black line) gives a slope of 1.2 r.p.m. per cell.
Figure 4
Figure 4. Characterization of rotational dynamics.
(a) Cumulative angle as a function of time for the 16 micromotors shown in Fig. 2b, colour scale encodes the average rotational speed from low (blue) to high (red). (b) Instantaneous rotational speed of the 16 rotors before filtering (grey line, only shown for one rotor) and after the low pass (10 Hz) frequency filtering (coloured lines, shown for all rotors). (c) Power spectra of the speed fluctuations. High frequency regions (>10 Hz) are marked with a grey background and filtered out. (d) Probability distribution of the fluctuations of the rotational speed before filtering (dashed line) and after filtering (full line).
Figure 5
Figure 5. Light modulation of rotational speed.
(a) Solid lines represent the rotational speed of 5 micromotors obtained by progressively lowering the illumination power. The power dependence of the 5 rotor average speed (open circles) is very well fitted by a hyperbola (dashed line). (b) Dynamic response of rotational speed (full line) to a square wave-modulated light intensity (8 s period). The half periods with low light are represented with a grey background. (c) Rotational speed averaged over 10 periods (points), the full line represent a fit with two exponentials.
Figure 6
Figure 6. Closed loop control of individual micromotor speeds.
(a) Rotational speeds of 6 micromotors driven by light powered bacteria. A feedback control loop is turned on at t=0 and adjusts light levels on each rotor based on its current speed. The feedback loop operates with a 10 s time interval shown as vertical dashed lines. (b) The s.d. of the speed in the 6 rotor sample quickly drops when we switch on the feedback control (t=0). (c) Solid lines represent the light levels over each micromotor (colour coding same as in a).

References

    1. Bechinger C. et al. Active particles in complex and crowded environments. Rev. Mod. Phys. 88, 045006 (2016).
    1. Marchetti M. et al. Hydrodynamics of soft active matter. Rev. Mod. Phys. 85, 1143 (2013).
    1. Cates M. Diffusive transport without detailed balance in motile bacteria: does microbiology need statistical physics? Rep. Prog. Phys. 75, 042601 (2012). - PubMed
    1. Behkam B. & Sitti M. Bacterial flagella-based propulsion and on/off motion control of microscale objects. Appl. Phys. Lett. 90, 023902 (2007).
    1. Steager E. et al. Control of microfabricated structures powered by flagellated bacteria using phototaxis. Appl. Phys. Lett. 90, 263901 (2007).

Publication types

Substances

LinkOut - more resources