

Comparison of low- and ultralow-dose computed tomography protocols for quantitative lung and airway assessment
- PMID: 28657201
- PMCID: PMC5603212
- DOI: 10.1002/mp.12436
Comparison of low- and ultralow-dose computed tomography protocols for quantitative lung and airway assessment
Abstract
Purpose: Quantitative computed tomography (CT) measures are increasingly being developed and used to characterize lung disease. With recent advances in CT technologies, we sought to evaluate the quantitative accuracy of lung imaging at low- and ultralow-radiation doses with the use of iterative reconstruction (IR), tube current modulation (TCM), and spectral shaping.
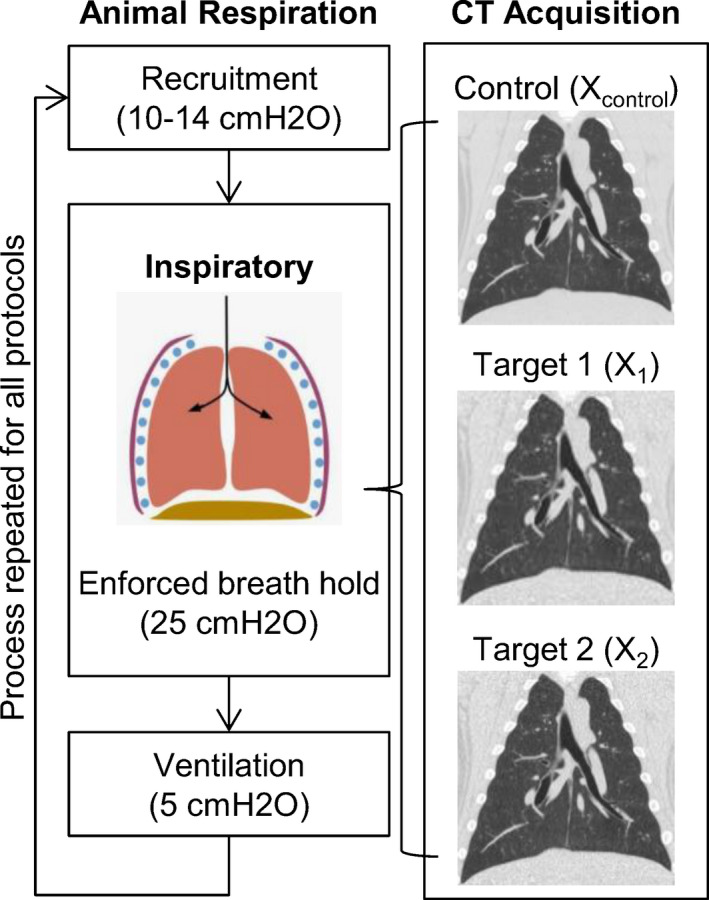
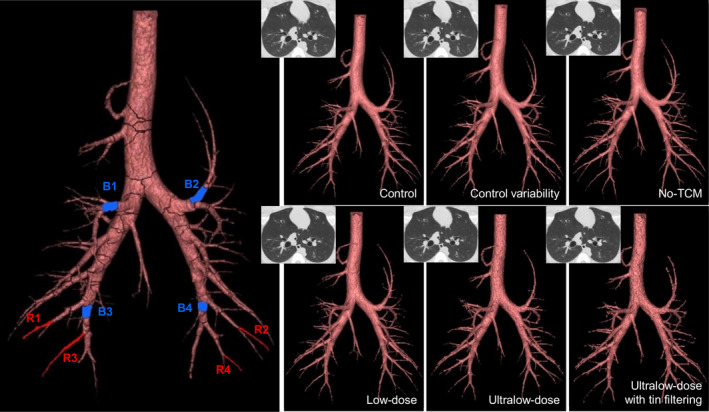
Methods: We investigated the effect of five independent CT protocols reconstructed with IR on quantitative airway measures and global lung measures using an in vivo large animal model as a human subject surrogate. A control protocol was chosen (NIH-SPIROMICS + TCM) and five independent protocols investigating TCM, low- and ultralow-radiation dose, and spectral shaping. For all scans, quantitative global parenchymal measurements (mean, median and standard deviation of the parenchymal HU, along with measures of emphysema) and global airway measurements (number of segmented airways and pi10) were generated. In addition, selected individual airway measurements (minor and major inner diameter, wall thickness, inner and outer area, inner and outer perimeter, wall area fraction, and inner equivalent circle diameter) were evaluated. Comparisons were made between control and target protocols using difference and repeatability measures.
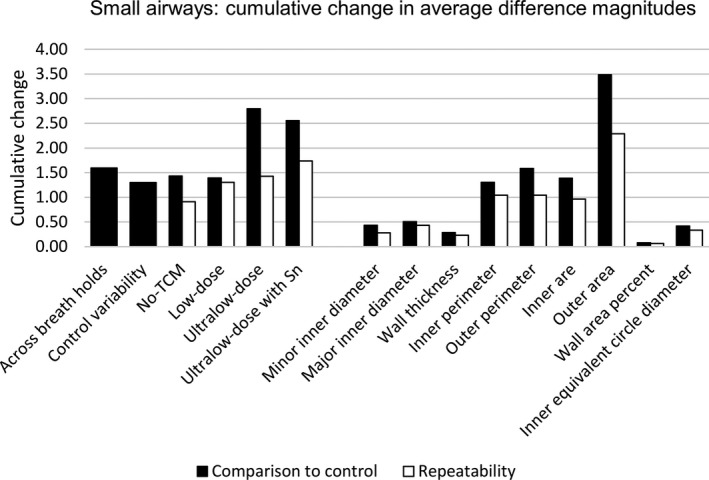
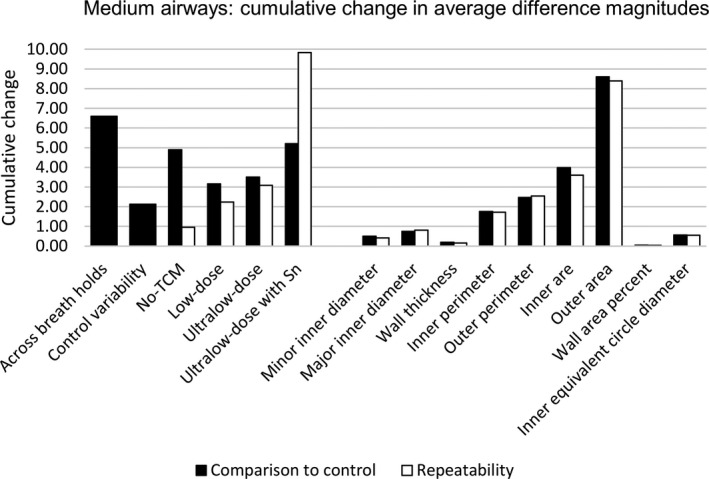
Results: Estimated CT volume dose index (CTDIvol) across all protocols ranged from 7.32 mGy to 0.32 mGy. Low- and ultralow-dose protocols required more manual editing and resolved fewer airway branches; yet, comparable pi10 whole lung measures were observed across all protocols. Similar trends in acquired parenchymal and airway measurements were observed across all protocols, with increased measurement differences using the ultralow-dose protocols. However, for small airways (1.9 ± 0.2 mm) and medium airways (5.7 ± 0.4 mm), the measurement differences across all protocols were comparable to the control protocol repeatability across breath holds. Diameters, wall thickness, wall area fraction, and equivalent diameter had smaller measurement differences than area and perimeter measurements.
Conclusions: In conclusion, the use of IR with low- and ultralow-dose CT protocols with CT volume dose indices down to 0.32 mGy maintains selected quantitative parenchymal and airway measurements relevant to pulmonary disease characterization.
Keywords: airway measurements; chronic obstructive pulmonary disease; low-dose computed tomography; lung disease assessment; quantitative CT protocols.
© 2017 American Association of Physicists in Medicine.
Conflict of interest statement
E.A.H. is a founder and shareholder of VIDA Diagnostics, Inc. a company commercializing lung image analysis software developed, in part, at the University of Iowa. J.D.N. is a paid consultant for VIDA Diagnostics, Inc. and has stock options in the company. J.C.S. has VIDA Diagnostics, Inc. stock options. J.P.S. is an employee and shareholder in VIDA Diagnostics, Inc. Siemens Healthcare has provided in‐kind support for hardware and software residing at the University of Iowa and used in this project.
Figures
References
-
- Niimi A, Matsumoto H, Amitani R, et al. Airway wall thickness in asthma assessed by computed tomography. Relation to clinical indices. Am J Respir Crit Care Med. 2000;162:1518–1523. - PubMed
-
- Montaudon M, Lederlin M, Reich S, et al. Bronchial measurements in patients with asthma: comparison of quantitative thin‐section CT findings with those in healthy subjects and correlation with pathologic findings. Radiology. 2009;253:844–853. - PubMed
-
- Besir FH, Mahmutyazicioglu K, Aydin L, Altin R, Asil K, Gundogdu S. The benefit of expiratory‐phase quantitative CT densitometry in the early diagnosis of chronic obstructive pulmonary disease. Diagn Interv Radiol (Ankara, Turkey). 2012;18:248–254. - PubMed
MeSH terms
Grants and funding
LinkOut - more resources
Full Text Sources
Other Literature Sources
Molecular Biology Databases
