

Causality on longitudinal data: Stable specification search in constrained structural equation modeling
- PMID: 28657454
- PMCID: PMC6249641
- DOI: 10.1177/0962280217713347
Causality on longitudinal data: Stable specification search in constrained structural equation modeling
Abstract
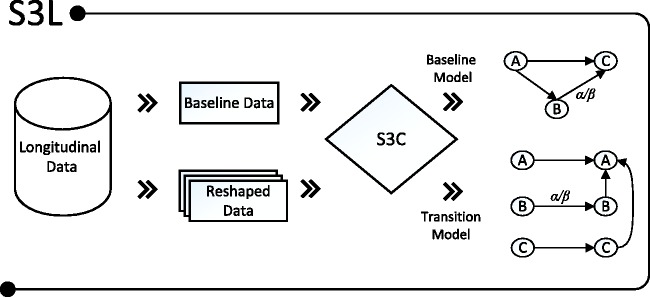
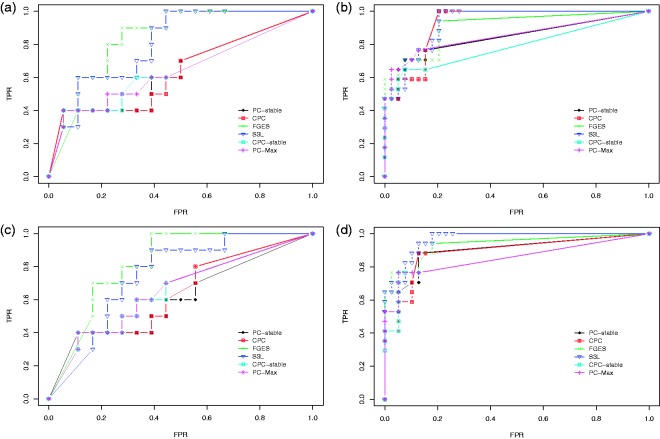
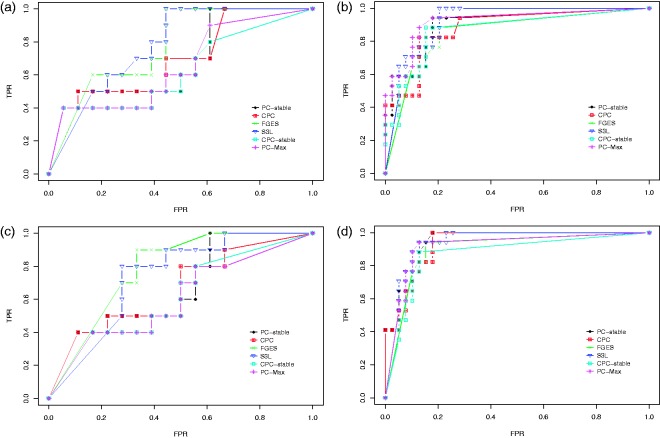
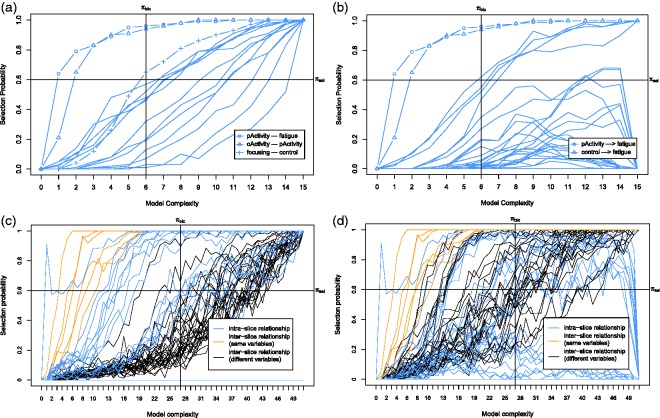
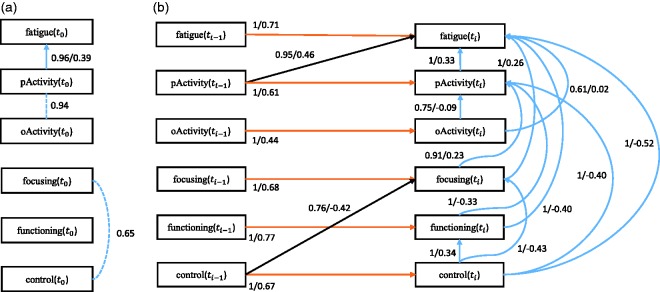
A typical problem in causal modeling is the instability of model structure learning, i.e., small changes in finite data can result in completely different optimal models. The present work introduces a novel causal modeling algorithm for longitudinal data, that is robust for finite samples based on recent advances in stability selection using subsampling and selection algorithms. Our approach uses exploratory search but allows incorporation of prior knowledge, e.g., the absence of a particular causal relationship between two specific variables. We represent causal relationships using structural equation models. Models are scored along two objectives: the model fit and the model complexity. Since both objectives are often conflicting, we apply a multi-objective evolutionary algorithm to search for Pareto optimal models. To handle the instability of small finite data samples, we repeatedly subsample the data and select those substructures (from the optimal models) that are both stable and parsimonious. These substructures can be visualized through a causal graph. Our more exploratory approach achieves at least comparable performance as, but often a significant improvement over state-of-the-art alternative approaches on a simulated data set with a known ground truth. We also present the results of our method on three real-world longitudinal data sets on chronic fatigue syndrome, Alzheimer disease, and chronic kidney disease. The findings obtained with our approach are generally in line with results from more hypothesis-driven analyses in earlier studies and suggest some novel relationships that deserve further research.
Keywords: Alzheimer’s disease; Longitudinal data; causal modeling; chronic fatigue syndrome; chronic kidney disease; multi-objective evolutionary algorithm; stability selection; structural equation model.
Figures
Similar articles
-
Challenges and Opportunities with Causal Discovery Algorithms: Application to Alzheimer's Pathophysiology.Sci Rep. 2020 Feb 19;10(1):2975. doi: 10.1038/s41598-020-59669-x. Sci Rep. 2020. PMID: 32076020 Free PMC article.
-
Longitudinal Exposure-Response Modeling of Multiple Indicators of Alzheimer's Disease Progression.J Prev Alzheimers Dis. 2023;10(2):212-222. doi: 10.14283/jpad.2023.13. J Prev Alzheimers Dis. 2023. PMID: 36946448 Clinical Trial.
-
A Bayesian latent class approach to causal inference with longitudinal data.Stat Methods Med Res. 2025 Jan;34(1):55-68. doi: 10.1177/09622802241298704. Epub 2024 Dec 12. Stat Methods Med Res. 2025. PMID: 39668594 Free PMC article.
-
Causal evidence in health decision making: methodological approaches of causal inference and health decision science.Ger Med Sci. 2022 Dec 21;20:Doc12. doi: 10.3205/000314. eCollection 2022. Ger Med Sci. 2022. PMID: 36742460 Free PMC article. Review.
-
Investigating effective brain connectivity from fMRI data: past findings and current issues with reference to Granger causality analysis.Brain Connect. 2012;2(5):235-45. doi: 10.1089/brain.2012.0091. Brain Connect. 2012. PMID: 23016794 Free PMC article. Review.
Cited by
-
Predicting kidney failure from longitudinal kidney function trajectory: A comparison of models.PLoS One. 2019 May 9;14(5):e0216559. doi: 10.1371/journal.pone.0216559. eCollection 2019. PLoS One. 2019. PMID: 31071186 Free PMC article.
-
Methodology of the DCCSS later fatigue study: a model to investigate chronic fatigue in long-term survivors of childhood cancer.BMC Med Res Methodol. 2021 May 16;21(1):106. doi: 10.1186/s12874-021-01298-7. BMC Med Res Methodol. 2021. PMID: 33993873 Free PMC article.
-
Longitudinal outcome monitoring in patients with chronic gastroduodenal symptoms investigated using the Gastric Alimetry system: study protocol.BMJ Open. 2023 Nov 27;13(11):e074462. doi: 10.1136/bmjopen-2023-074462. BMJ Open. 2023. PMID: 38011983 Free PMC article.
-
From hype to reality: data science enabling personalized medicine.BMC Med. 2018 Aug 27;16(1):150. doi: 10.1186/s12916-018-1122-7. BMC Med. 2018. PMID: 30145981 Free PMC article.
-
Potential mechanisms of the fatigue-reducing effect of cognitive-behavioral therapy in cancer survivors: Three randomized controlled trials.Psychooncology. 2021 Sep;30(9):1476-1484. doi: 10.1002/pon.5710. Epub 2021 May 3. Psychooncology. 2021. PMID: 33899978 Free PMC article.
References
-
- Daniel RM, Kenward MG, Cousens SN, et al. Using causal diagrams to guide analysis in missing data problems. Stat Methods Med Res 2012; 21: 243–256. - PubMed
-
- Hoover KD. Causality in economics and econometrics. In: Steven N Durlauf and Lawrence E Blume (eds) The new Palgrave dictionary of economics. Basingstoke: Palgrave Mcmillan, 2008, p.2.
-
- Abu-Bader S, Abu-Qarn AS. Government expenditures, military spending and economic growth: causality evidence from Egypt, Israel, and Syria. J Policy Model 2003; 25: 567–583.
-
- Pearl J. Causal inference from indirect experiments. Artif Intell Med 1995; 7: 561–582. - PubMed
Publication types
MeSH terms
Grants and funding
LinkOut - more resources
Full Text Sources
Other Literature Sources
