

Groupwise registration of MR brain images with tumors
- PMID: 28657551
- PMCID: PMC5759775
- DOI: 10.1088/1361-6560/aa7c41
Groupwise registration of MR brain images with tumors
Abstract
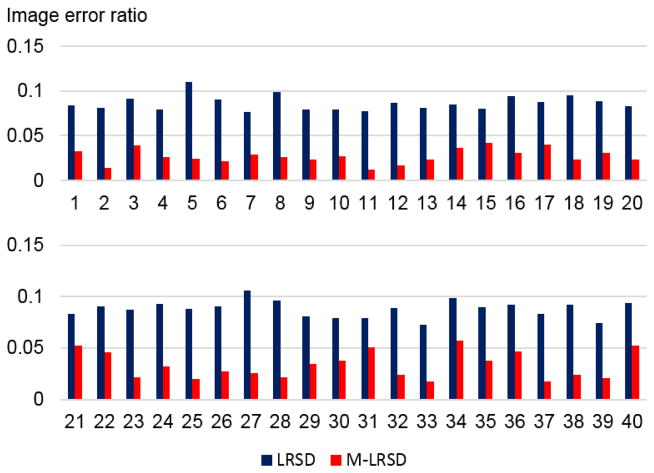
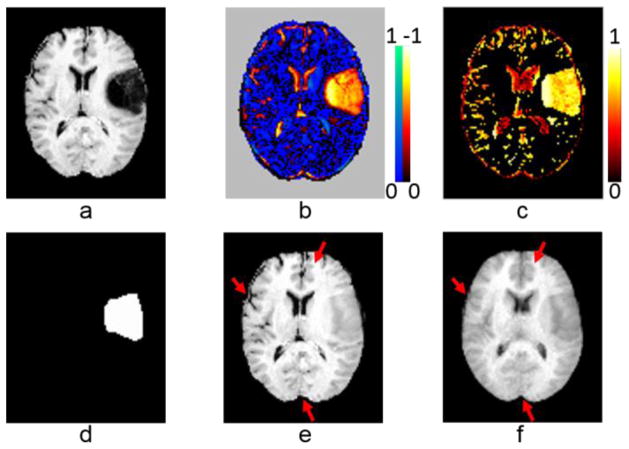
A novel groupwise image registration framework is developed for registering MR brain images with tumors. Our method iteratively estimates a normal-appearance counterpart for each tumor image to be registered and constructs a directed graph (digraph) of normal-appearance images to guide the groupwise image registration. Particularly, our method maps each tumor image to its normal appearance counterpart by identifying and inpainting brain tumor regions with intensity information estimated using a low-rank plus sparse matrix decomposition based image representation technique. The estimated normal-appearance images are groupwisely registered to a group center image guided by a digraph of images so that the total length of 'image registration paths' to be the minimum, and then the original tumor images are warped to the group center image using the resulting deformation fields. We have evaluated our method based on both simulated and real MR brain tumor images. The registration results were evaluated with overlap measures of corresponding brain regions and average entropy of image intensity information, and Wilcoxon signed rank tests were adopted to compare different methods with respect to their regional overlap measures. Compared with a groupwise image registration method that is applied to normal-appearance images estimated using the traditional low-rank plus sparse matrix decomposition based image inpainting, our method achieved higher image registration accuracy with statistical significance (p = 7.02 × 10⁻⁹).
Figures


Similar articles
-
Groupwise Image Registration Guided by a Dynamic Digraph of Images.Neuroinformatics. 2016 Apr;14(2):131-45. doi: 10.1007/s12021-015-9285-2. Neuroinformatics. 2016. PMID: 26585712
-
PCA-based groupwise image registration for quantitative MRI.Med Image Anal. 2016 Apr;29:65-78. doi: 10.1016/j.media.2015.12.004. Epub 2015 Dec 19. Med Image Anal. 2016. PMID: 26802910
-
Multi-Atlas Segmentation of MR Tumor Brain Images Using Low-Rank Based Image Recovery.IEEE Trans Med Imaging. 2018 Oct;37(10):2224-2235. doi: 10.1109/TMI.2018.2824243. Epub 2018 Apr 6. IEEE Trans Med Imaging. 2018. PMID: 29993928 Free PMC article.
-
Improved image registration by sparse patch-based deformation estimation.Neuroimage. 2015 Jan 15;105:257-68. doi: 10.1016/j.neuroimage.2014.10.019. Epub 2014 Oct 16. Neuroimage. 2015. PMID: 25451481 Free PMC article.
-
A Review of Point Set Registration: From Pairwise Registration to Groupwise Registration.Sensors (Basel). 2019 Mar 8;19(5):1191. doi: 10.3390/s19051191. Sensors (Basel). 2019. PMID: 30857205 Free PMC article. Review.
Cited by
-
A New Image Similarity Metric for Improving Deformation Consistency in Graph-Based Groupwise Image Registration.IEEE Trans Biomed Eng. 2019 Aug;66(8):2192-2199. doi: 10.1109/TBME.2018.2885436. Epub 2018 Dec 6. IEEE Trans Biomed Eng. 2019. PMID: 30530309 Free PMC article.
-
Symmetric-Constrained Irregular Structure Inpainting for Brain MRI Registration with Tumor Pathology.Brainlesion. 2021;12658:80-91. doi: 10.1007/978-3-030-72084-1_8. Epub 2021 Mar 27. Brainlesion. 2021. PMID: 34013242 Free PMC article.
-
Evaluating normalized registration and preprocessing methodologies for the analysis of brain MRI in pediatric patients with shunt-treated hydrocephalus.Front Neurosci. 2024 May 30;18:1405363. doi: 10.3389/fnins.2024.1405363. eCollection 2024. Front Neurosci. 2024. PMID: 38887369 Free PMC article.
-
Brain MR Atlas Construction Using Symmetric Deep Neural Inpainting.IEEE J Biomed Health Inform. 2022 Jul;26(7):3185-3196. doi: 10.1109/JBHI.2022.3149754. Epub 2022 Jul 1. IEEE J Biomed Health Inform. 2022. PMID: 35139030 Free PMC article.
References
-
- Ashburner J. A fast diffeomorphic image registration algorithm. Neuroimage. 2007;38:95–113. - PubMed
-
- Boykov Y, Veksler O, Zabih R. Fast Approximate Energy Minimization via Graph Cuts. IEEE Transactions on Pattern Analysis & Machine Intelligence. 2001;23:1222–1239.
-
- Brett M, Leff AP, Rorden C, Ashburner J. Spatial normalization of brain images with focal lesions using cost function masking. NeuroImage. 2001;14:486–500. - PubMed
-
- Cheng B, Yang JC, Yan SC, Fu Y, Huang TS. Learning With l(1)-Graph for Image Analysis. Ieee Transactions on Image Processing. 2010;19:858–866. - PubMed
MeSH terms
Grants and funding
LinkOut - more resources
Full Text Sources
Other Literature Sources
Medical