Observational Study
. 2017 Jun;96(26):e7347.
doi: 10.1097/MD.0000000000007347.

16S sequencing and functional analysis of the fecal microbiome during treatment of newly diagnosed pediatric inflammatory bowel disease

Affiliations
Observational Study

16S sequencing and functional analysis of the fecal microbiome during treatment of newly diagnosed pediatric inflammatory bowel disease

James J Ashton et al. Medicine (Baltimore). 2017 Jun.

Abstract

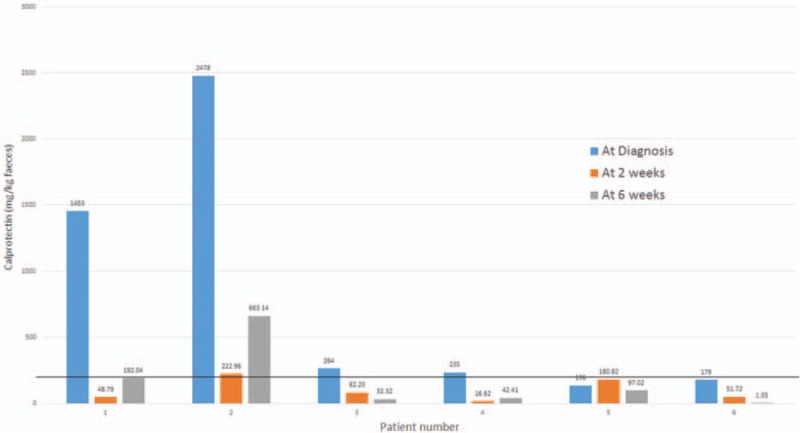
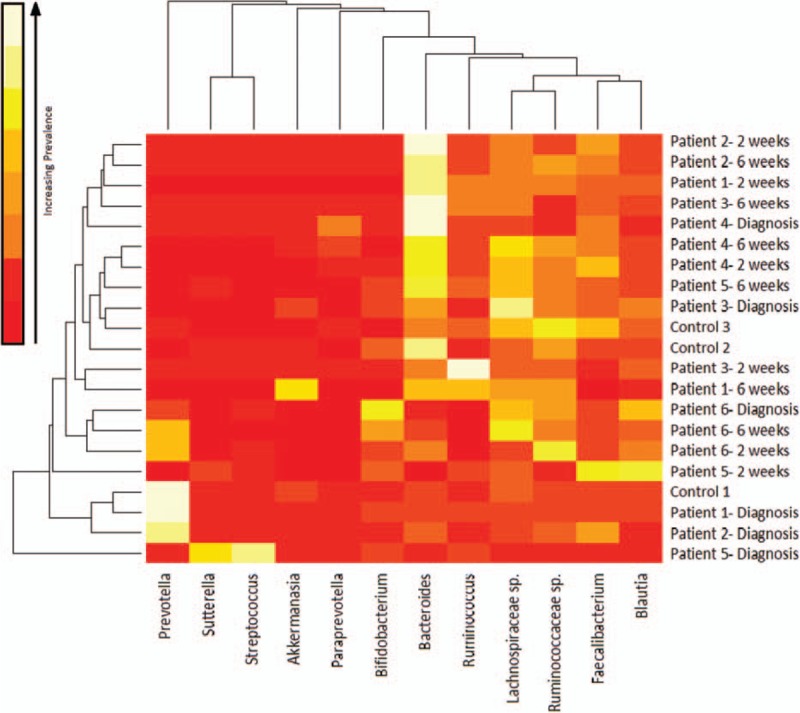
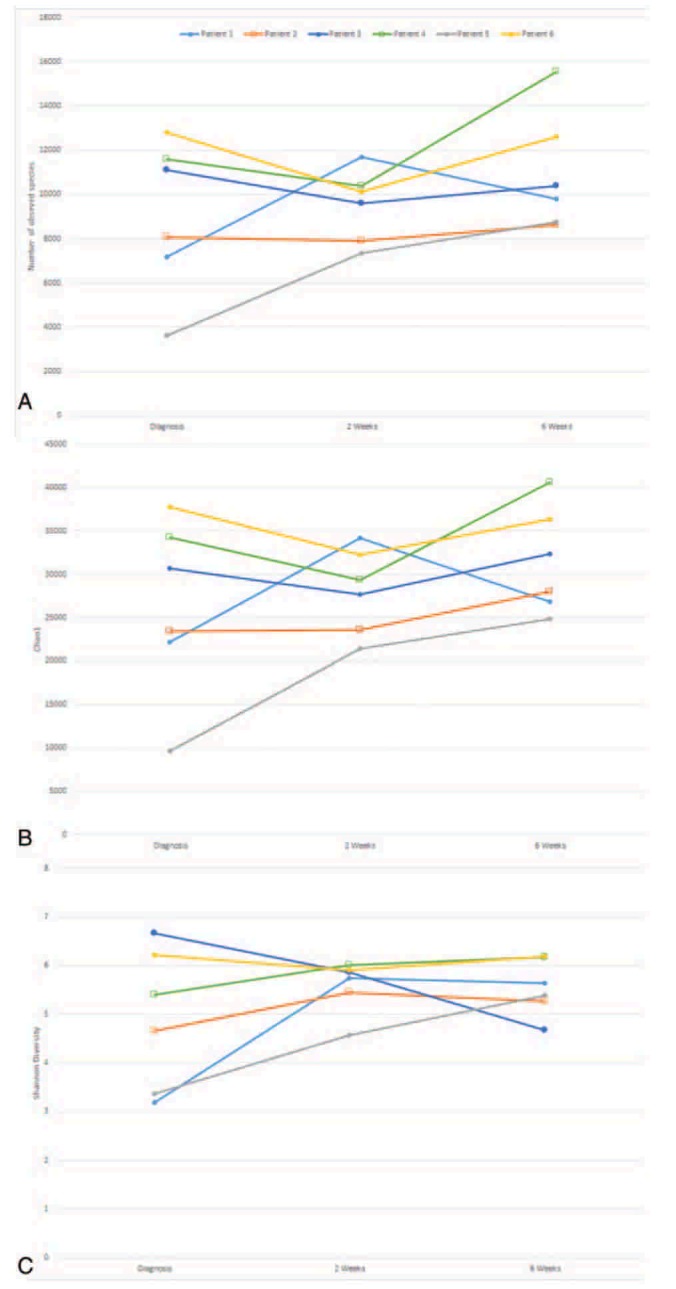
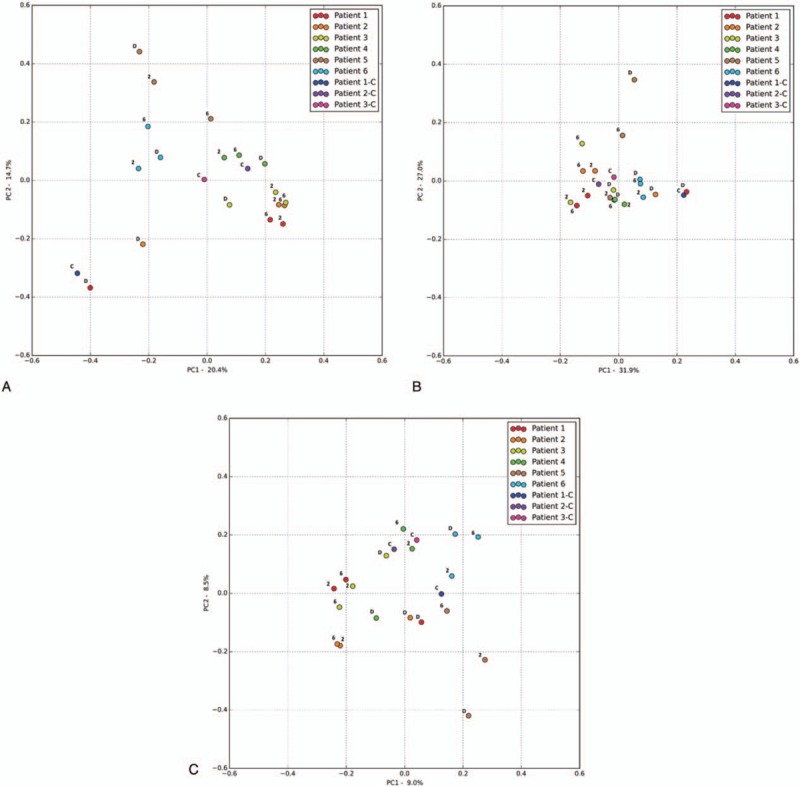
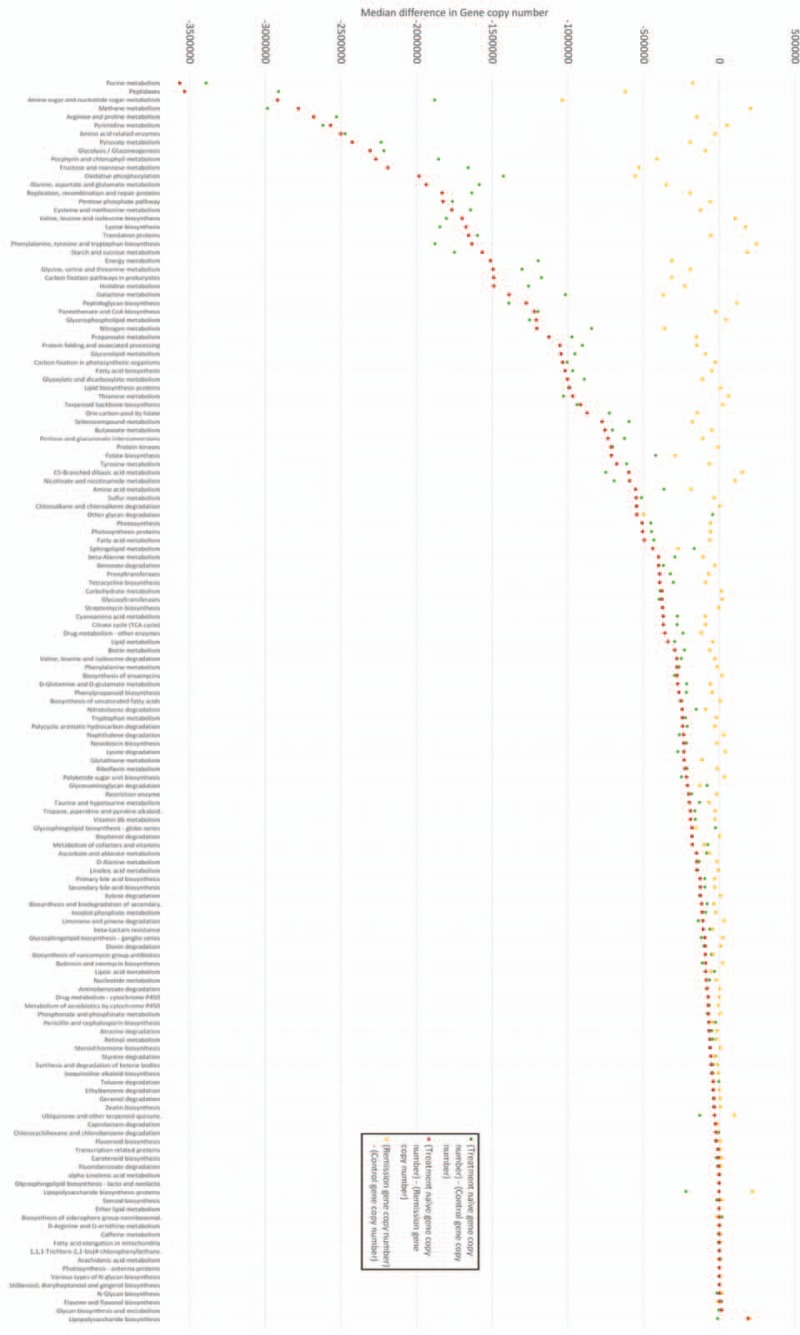
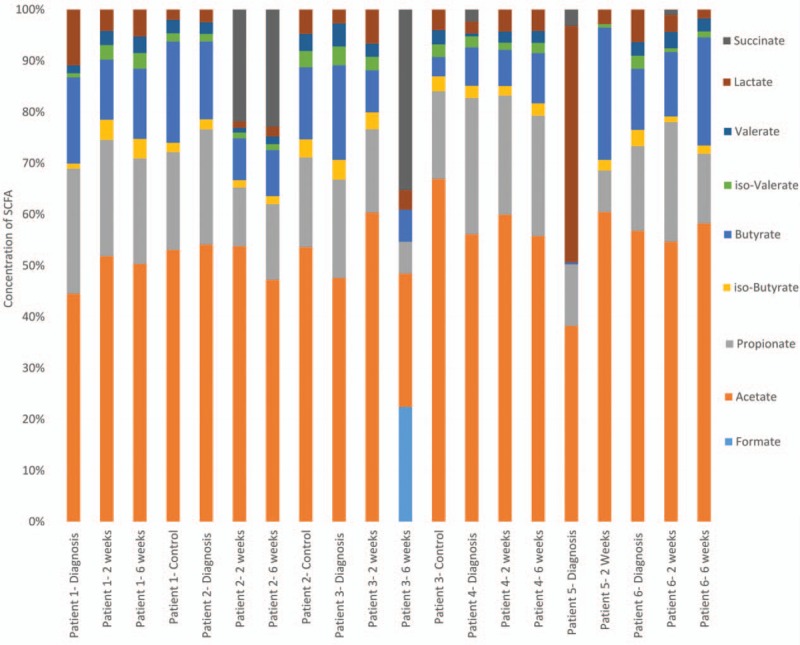
The human microbiome is of considerable interest to pediatric inflammatory bowel disease (PIBD) researchers with 1 potential mechanism for disease development being aberrant immune handling of the intestinal bacteria. This study analyses the fecal microbiome through treatment in newly diagnosed PIBD patients and compares to cohabiting siblings where possible. Patients were recruited on clinical suspicion of PIBD before diagnosis. Treatment-naïve fecal samples were collected, with further samples at 2 and 6 weeks into treatment. Samples underwent 16S ribosomal ribonucleic acid (RNA) gene sequencing and short-chain fatty acids (SCFAs) analysis, results were analyzed using quantitative-insights-into-microbial-ecology. Six PIBD patients were included in the cohort: 4 Crohn disease (CD), 1 ulcerative colitis (UC), 1 inflammatory bowel disease (IBD) unclassified, and median age 12.6 (range 10-15.1 years); 3 patients had an unaffected healthy sibling recruited. Microbial diversity (observed species/Chao1/Shannon diversity) was reduced in treatment-naïve patients compared to siblings and patients in remission. Principal coordinate analysis using Bray-Curtis dissimilarity and UniFrac revealed microbial shifts in CD over the treatment course. In treatment-naïve PIBD, there was reduction in functional ability for amino acid metabolism and carbohydrate handling compared to controls (P = .038) and patients in remission (P = .027). Metabolic function returned to normal after remission was achieved. SCFA revealed consistent detection of lactate in treatment-naïve samples. This study adds in-depth 16S rRNA sequencing analysis on a small longitudinal cohort to the literature and includes sibling controls and patients with UC/IBD unclassified. It highlights the initial dysbiosis, reduced diversity, altered functional potential, and subsequent shifts in bacteria from diagnosis over time to remission.


Conflict of interest statement

The authors have no conflicts of interest to disclose.

Figures

Figure 1
Figure 1
Changes in fecal calprotectin across time. Solid line demonstrates the threshold for active intestinal inflammation (>200 mg/kg), with the normal range 5 to 50 mg/kg. Patient numbers correspond to those described in Table 1.
Figure 2
Figure 2
Heatmap of common genera in all samples across treatment produced using Bray–Curtis dissimilarity—lighter colors indicates more abundance of that genera (white is most abundant). The degree of similarity of microbiota can be observed using the dendrogram on the x-axis. The degree of similarity of sample can be observed using the dendrogram on the y-axis.
Figure 3
Figure 3
(A) Observed species for individual patients across treatment, (B) Chao1 diversity for individual patients across treatment, (C) Shannon diversity for individual patients across treatment. (○ Indicates patients who went into remission at 2 weeks, □ indicates patients who went into remission at 6 weeks).
Figure 4
Figure 4
(A) Principal coordinate analysis (PCoA) Bray–Curtis dissimilarity PC1 vs PC2, D = before diagnosis, 2 = 2 weeks into treatment, 6 = 6 weeks into treatment, C = control. For patients details please see Table 1. (B) PCoA weighted UniFrac PC1 vs PC2, D = before diagnosis, 2 = 2 weeks into treatment, 6 = 6 weeks into treatment, C = control. For patients details please refer to Table 1. (C) PCoA unweighted UniFrac PC1 vs PC2, D = before diagnosis, 2 = 2 weeks into treatment, 6 = 6 weeks into treatment, C = control. For patients details please refer to Table 1.
Figure 5
Figure 5
Comparison of 147 common metabolic pathways in IBD fecal microbiome samples-markers indicate absolute difference in predicted function (gene copy number) between samples, a value of 0 indicates no difference in predicted function (gene copy number). Negative difference in gene copy numbers indicate loss of function in treatment-naïve (TN) patients in that metabolic pathway. Differences are calculated by subtracting the predicted gene copy number in 1 group from another (refer to this figure). For example, the metabolic pathway associated with purine metabolism (first pathway on x-axis) displayed the greatest loss of function in TN samples compared to both control samples and samples from patients in remission. There was a median reduction of −3391,471 (TN—control) and −356,6025 (TN—remission) gene copies between samples indicating significantly reduced functional capability in this metabolic pathway in patients with TN IBD. Controls and patients in remission were not statistically different (P = .86). There are statistically significant differences in function (gene copy number) between both TN and controls (P = .038), and TN and patients in remission (P = .027) across all 147 Kyoto Encyclopaedia of Genes and Genomes (KEGG) pathways. Statistical analysis was with Shapiro–Wilk normality test (distribution of data) and Mann–Whitney U test (functional analysis). Please refer to Supplementary table 1 for clarification of KEGG pathways and exact gene copy number differences. IBD = inflammatory bowel disease.
Figure 6
Figure 6
Fecal short-chain fatty acid relative concentration over time in pediatric inflammatory bowel disease patients and controls—for absolute abundance refer to Supplementary table 2.

References

    1. Henderson P, van Limbergen JE, Wilson DC, et al. Genetics of childhood-onset inflammatory bowel disease. Inflamm Bowel Dis 2011;17:346–61. - PubMed
    1. Kaser A, Zeissig S, Blumberg RS. Inflammatory bowel disease. Annu Rev Immunol 2010;28:573–621. - PMC - PubMed
    1. Ashton JJ, Wiskin AE, Ennis S, et al. Rising incidence of paediatric inflammatory bowel disease (PIBD) in Wessex, Southern England. Arch Dis Child 2014;99:659–64. - PubMed
    1. Henderson P, Hansen R, Cameron FL, et al. Rising incidence of pediatric inflammatory bowel disease in Scotland. Inflamm Bowel Dis 2012;18:999–1005. - PubMed
    1. Turnbaugh PJ, Ley RE, Hamady M, et al. The human microbiome project. Nature 2007;449:804–10. - PMC - PubMed

Publication types

MeSH terms